
 Download:


-
Introduction: Chikungunya virus (CHIKV), an arthropod-borne alphavirus transmitted by Aedes aegypti and Aedes albopictus, causes fever, severe joint pain, and rash. By 2025, it has triggered outbreaks in 119 countries, endangering 5.5 million people. Recent epidemics in Foshan, China, have strained healthcare systems, underscoring the need to characterize viral load dynamics across infection phases.
Methods: We collected 1,156 clinical samples from four Foshan hospitals in July 2025, spanning 6 days before to 12 days after symptom onset. Specimens included serum (904 valid), saliva (22), urine (4), throat swabs (3), and stool (37). CHIKV RNA was quantified via qRT-PCR; timepoints and specimen types with insufficient samples were excluded.
Results: Serum showed the highest positivity (90%), followed by saliva (68%), throat swabs (15%), and urine (11%); stool was negative (0%). Serum also had the highest viral loads, confirming its optimal utility. Viral RNA was detectable as early as 1 day pre-symptom onset (day-1). Days 0–7 post-onset marked explosive replication and elevated loads, representing the optimal sampling window. From Day 8 onward, loads declined, requiring IgG testing to avoid false negatives.
Conclusions: Serum is the gold standard for acute CHIKV diagnosis, with superior positivity and viral loads. Pre-symptomatic viral shedding (day-1) supports enhanced port-of-entry screening to intercept imported cases. Days 0–7 post-onset is the optimal sampling window for acute infection. During clearance (day 8+), IgG testing complements molecular diagnostics to reduce gaps. These findings inform evidence-based diagnosis, outbreak control, and resource allocation.
-
Chikungunya virus (CHIKV), a representative pathogen of the genus Alphavirus within the family Togaviridae, is primarily transmitted by Aedes aegypti and Aedes albopictus mosquitoes (1). As a single-stranded, positive-sense RNA virus (ssRNA), its spherical viral particles consist of only one serotype. Based on genomic phylogenetic analysis, CHIKV can be classified into three distinct subtypes: West African, East-Central-South African (ECSA), and Asian (2).
The virus was initially isolated and identified in 1952 from a febrile patient in Tanzania, but large-scale epidemics began with the 2004 outbreak in Kenya, followed by a significant public health crisis on Réunion Island (France) during 2005–2006 (3–5). Over the past 20 years, Chikungunya fever has primarily persisted in sub-Saharan Africa and the tropical and subtropical regions of Southeast Asia (4). Prior to 2025, China documented predominantly imported cases with limited local transmission, though sporadic infections persisted. As of July 22, 2025, CHIKV transmission has expanded to 119 countries and territories, endangering approximately 5.5 million people through mosquito-borne infection and severely straining global health systems (6).
Typical clinical manifestations of CHIKV infection include sudden onset high fever, a maculopapular rash, and severe arthralgia (joint pain), often accompanied by myalgia (muscle pain), headache, and extreme fatigue (7). The incubation period typically ranges from two to 10 days (8), and the disease course can be clearly divided into two distinct phases: the acute phase (within the first 10 days after symptom onset) is characterized by fever (the most core symptom), arthralgia, and rash, lasting approximately seven to 10 days (9); this is followed by the recovery phase, during which the viral load in the patient’s blood significantly decreases or becomes undetectable, and clinical symptoms gradually subside (5). Notably, arthritic symptoms often persist longer; while a minority of patients recover within weeks, prolonged manifestations like systemic myalgia may occur during this period (8).
The large-scale Chikungunya fever outbreak in Shunde District, Foshan City, Guangdong Province, China, in 2025 has drawn widespread attention (6,10), as of August 1, over 6,000 confirmed cases have been reported in the district. Currently, there are no approved specific therapeutic drugs or vaccines for this disease; clinical management relies primarily on non-steroidal anti-inflammatory drugs (NSAIDs) for symptomatic relief. At the fundamental research level, systematic spatiotemporal characterization of CHIKV infection remains incomplete, particularly the lack of integrated studies analyzing different infection phases together with tissue distribution. The relationship between viral distribution patterns among tissues and the pathological mechanisms of the acute phase also requires further clarification. Based on this knowledge gap, the present study aims to systematically elucidate the spatiotemporal transmission patterns of CHIKV by detecting its viral load and distribution characteristics in different tissues at various infection stages, thereby providing a critical theoretical foundation for investigating CHIKV pathogenicity, optimizing clinical diagnostic strategies, and developing antiviral drugs or vaccines.
During July 2025, the Guangdong Provincial Center for Disease Control and Prevention systematically collected 1,156 clinical specimens from four hospitals in Shunde District, Foshan City, Guangdong Province: Shunde First People’s Hospital, Shunde Third People’s Hospital, Lecong Hospital, and Chencun Hospital. Sample collection encompassed a comprehensive disease timeline spanning 6 days before to 12 days after symptom onset. To characterize CHIKV tissue distribution patterns across different infection stages, we obtained specimens from multiple anatomical sites: 1,024 blood samples, 37 stool samples, 37 urine samples, 38 saliva samples, and 20 throat swab samples. Following quality control procedures that excluded samples yielding no cycle threshold (CT) values, the final analytical dataset comprised 904 valid blood samples, 22 valid saliva samples, 4 valid urine samples, and 3 valid throat swab samples. Detection rates varied significantly across specimen types: blood demonstrated the highest positivity at 90% (923 positive of 1,024 tested), followed by saliva at 68% (26 positive of 38 tested), throat swabs at 15% (3 positive of 20 tested), and urine at 11% (4 positive of 37 tested). Notably, all fecal specimens tested negative (0 positive of 37 tested, 0% positivity rate). Specimens were systematically distributed across defined timepoints relative to symptom onset, ensuring comprehensive coverage of pre-symptomatic, acute, and convalescent phases: day -6 (1 specimen), day −1 (5 specimens), day 0 (77 specimens), day 1 (228 specimens), day 2 (296 specimens), day 3 (163 specimens), day 4 (141 specimens), day 5 (75 specimens), day 6 (51 specimens), day 7 (29 specimens), day 10 (5 specimens), day 11 (1 specimen), and day 12 (1 specimen). All patient specimens originated from individuals presenting with either mild symptoms (collected post-symptom onset) or asymptomatic infections (collected pre-symptom onset). The entire cohort demonstrated favorable clinical outcomes following treatment, with no severe cases documented in this infection series to date.
Viral load quantification was performed using quantitative reverse transcription polymerase chain reaction (qRT-PCR). CHIKV-specific detection utilized the Chikungunya Virus Nucleic Acid Detection Kit following the manufacturer's protocol; this commercial kit does not disclose primer/probe sequences or technical specifications. The experimental workflow comprised the following standardized steps: 1) Reaction Assembly: Each 25 μL reaction mixture contained 12 μL Universal Reaction Mix, 4 μL Enzyme Master Mix, 4 μL CHIKV-Specific Primer-Probe Cocktail, and 5 μL extracted nucleic acid template. 2) Amplification Protocol: Thermal cycling conditions were as follows: reverse transcription at 50 °C for 10 minutes (1 cycle), initial denaturation at 95 °C for 5 minutes (1 cycle), followed by 40 amplification cycles consisting of denaturation at 95 °C for 10 seconds and annealing/extension at 55 °C for 40 seconds with real-time fluorescence detection in the FAM channel. All reactions included appropriate positive and negative controls, with the kit’s limit of detection established at 500 copies/μL.
To determine the optimal clinical specimen for CHIKV detection across infection phases, we analyzed CT values from different specimen types collected on Days 2, 3, 4, and 5 post-symptom onset (Figure 1). Statistical analysis was restricted to timepoints with adequate sample sizes (≥3 specimens per category). Days 2 and 5 were excluded from comparative analysis due to insufficient non-serum specimens: Day 2 yielded only single samples each for saliva, throat swabs, and urine; Day 5 provided single replicates for both saliva and urine. Similarly, Day 3 throat swabs and urine specimens, and Day 4 urine samples were excluded due to inadequate sample numbers. Rigorous statistical comparison was therefore feasible only for Days 3 and 4 (Figure 1B and 1C), which revealed significantly lower viral loads in saliva compared to serum (higher CT values indicate reduced viral concentrations).
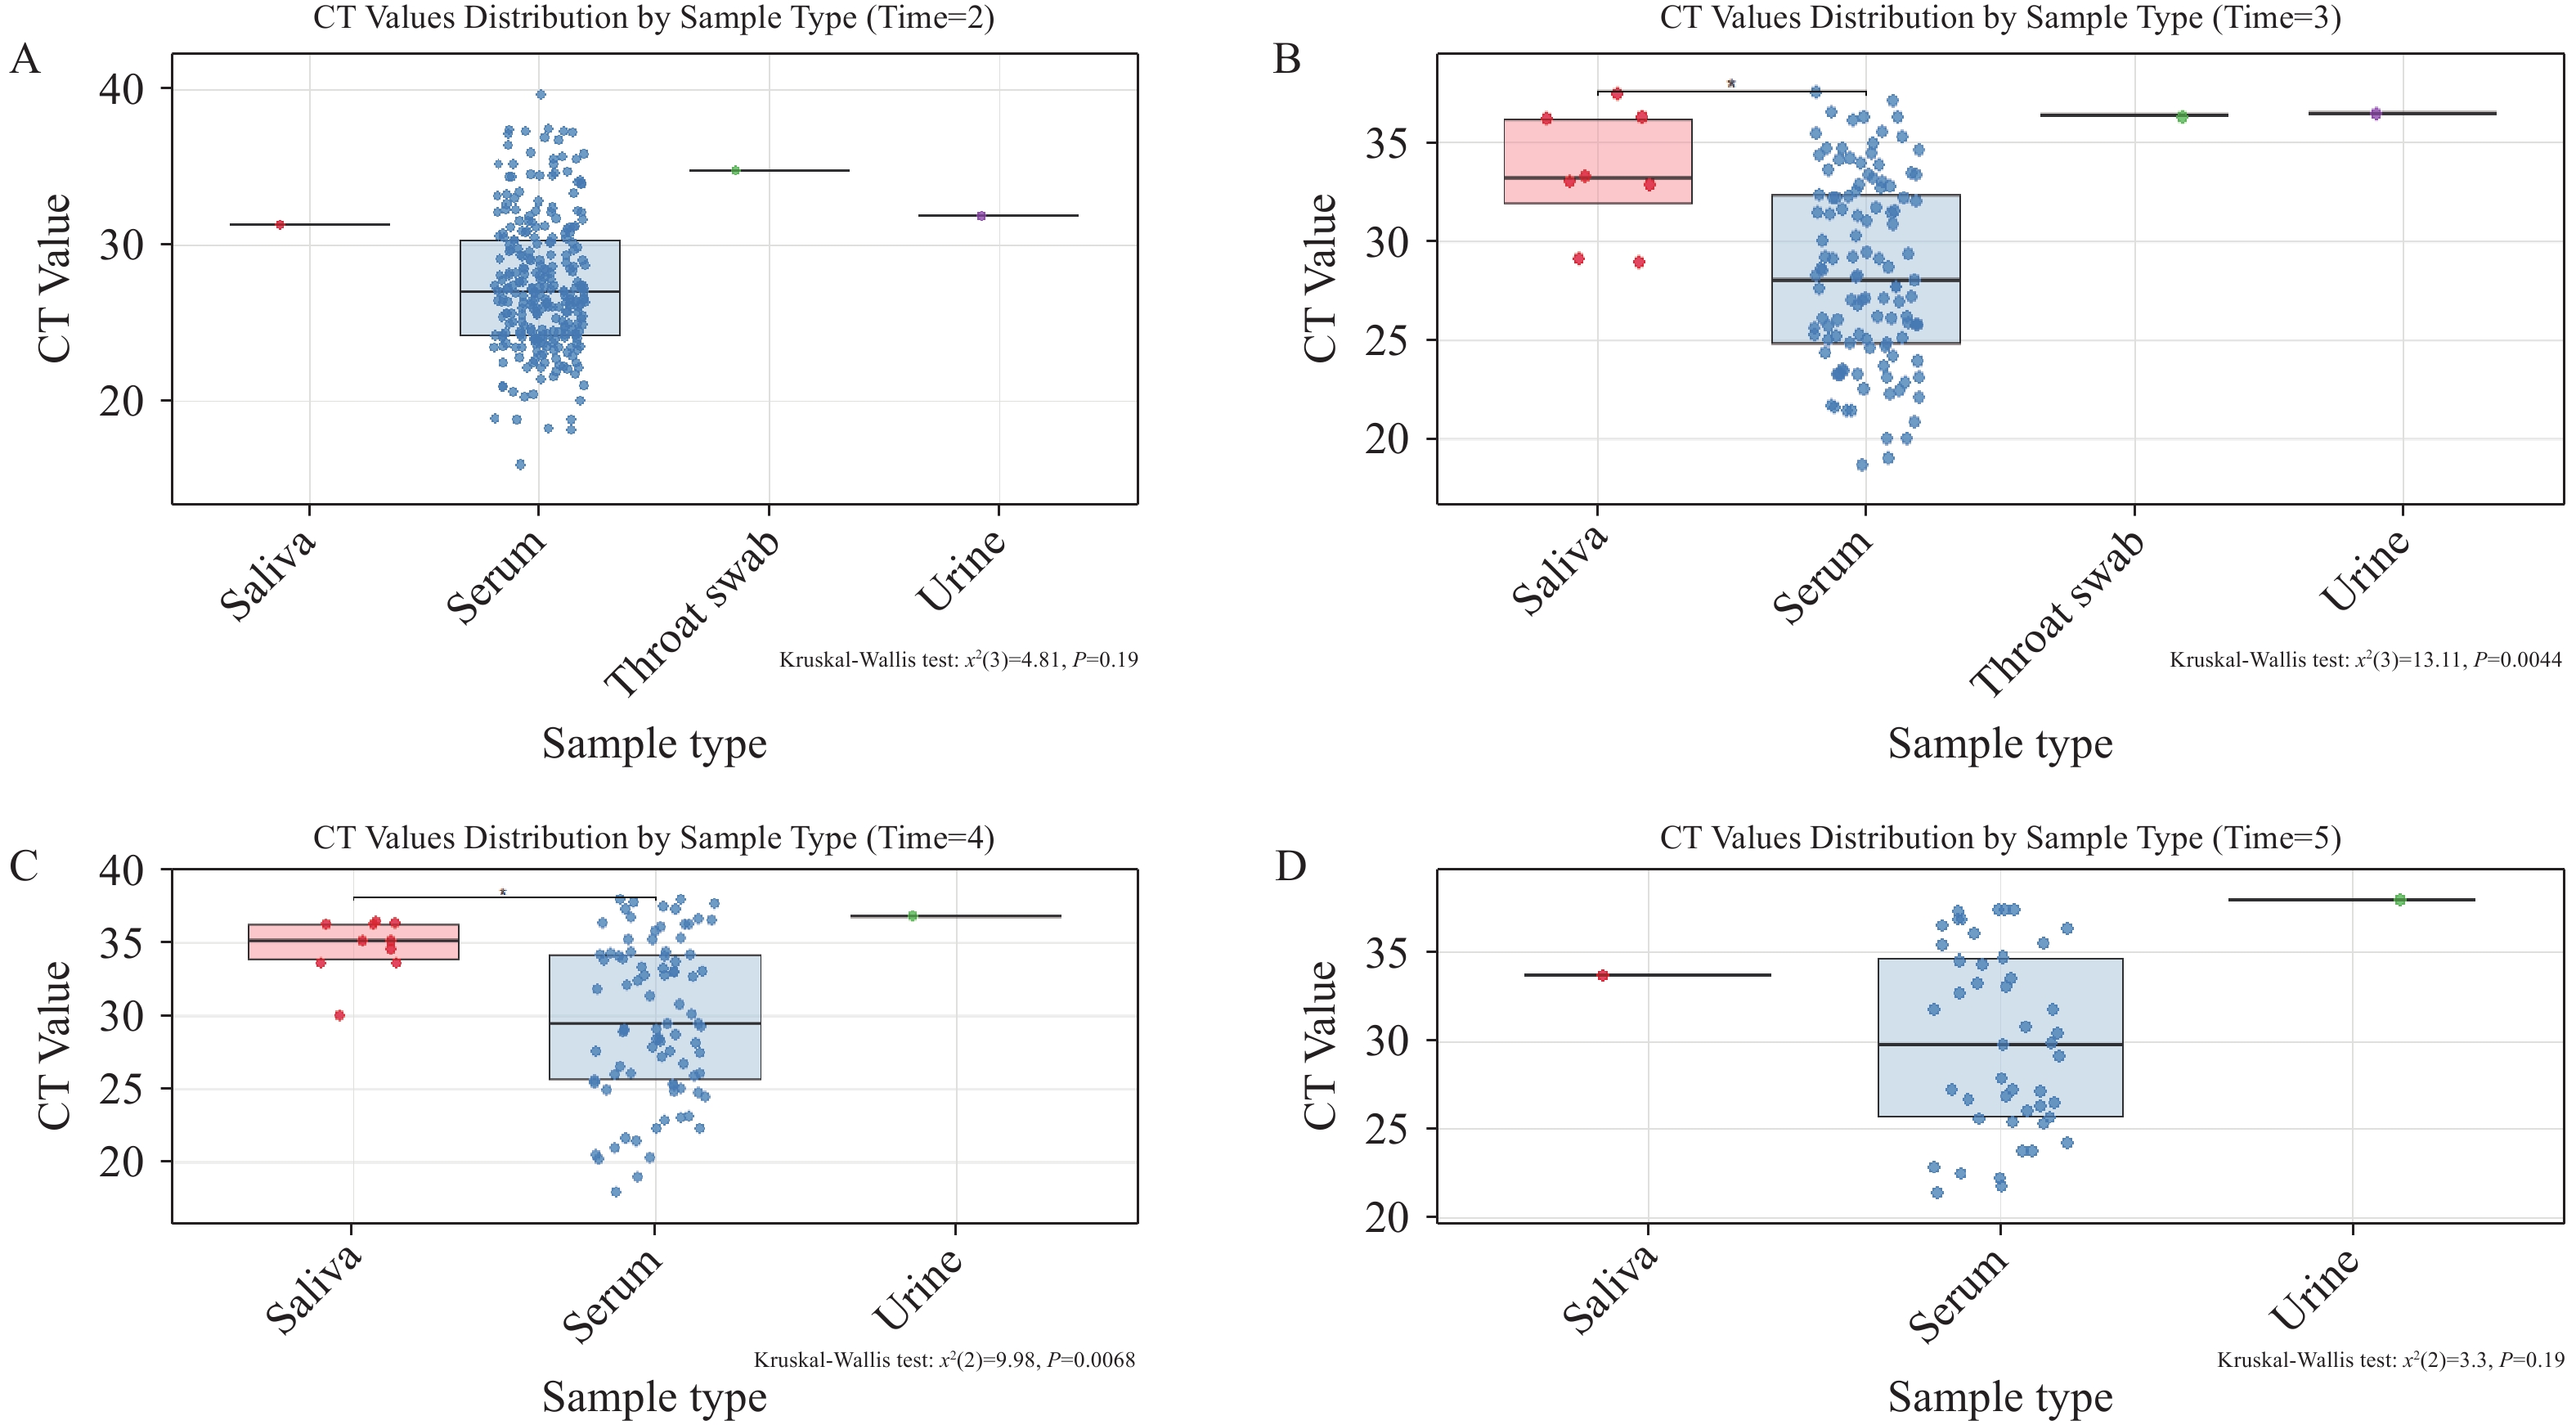 Figure 1.
shows CT values of CHIKV nucleic acid in different specimen types on the same day representing viral loads on (A) day 2, (B) day 3, (C) day 4 and (D) day 5 post-symptom onset.
Note: For the box-and-whisker plots in these figures: The box represents the IQR, containing the middle 50% of the data. The line inside the box is the median (the 50th percentile). The whiskers extend to the minimum and maximum values within 1.5 times the IQR from the quartiles. Outliers, if present, are plotted as individual points beyond the whiskers.
Abbreviation: IQR=interquartile range; CT=cycle threshold; CHIKV=Chikungunya virus.
Our findings establish serum as the gold-standard specimen for clinical CHIKV RNA detection. Saliva samples cannot serve as a reliable substitute for serum in chikungunya virus diagnostics. While urine and throat swabs demonstrate detectable viral loads — albeit at substantially lower concentrations as indicated by elevated CT values — no CHIKV RNA was detected in any stool specimens. Importantly, the current viral load quantification in serum primarily reflects viral RNA levels in plasma, and we cannot entirely exclude the possibility of higher viral loads in blood cells during active viremia. As a hallmark of acute CHIKV infection, viremia encompasses not only free viral particles in plasma but also potential viral replication or sequestration within circulating blood cells — a dynamic that may contribute to overall viral persistence and transmission potential. Despite this consideration, the consistently high viral loads detected in serum confirm its position as the optimal matrix for reliable CHIKV virological testing in both clinical and public health settings.
To determine the optimal diagnostic window and minimize false-negative risks, we analyzed viral replication and clearance kinetics within the human host. We conducted a comparative analysis of valid serum samples collected at specific timepoints relative to symptom onset: −1, 0, 1, 2, 3, 4, 5, 6, 8, 9, 10, and 12 days post-symptom onset. Timepoints with fewer than three specimens were excluded from statistical analysis to ensure robust comparisons. Consequently, Day 10 and Day 12, each yielding only one specimen, were omitted from temporal analyses.
The temporal dynamics revealed distinct phases of viral activity (Figure 2). On Day −1, lower CT values indicated substantial viral loads approaching the clinical threshold, yet patients remained asymptomatic at this pre-symptomatic stage. From Day 0 through Day 5, CHIKV entered an explosive replication phase characterized by high viral loads and severe pathological symptoms. Interestingly, viral loads demonstrated a secondary increase on Days 6 and 7, confirming that Days 0–7 collectively constitute the high viral activity phase and represent the optimal period for specimen collection. Beginning on Day 8, the data exhibited greater variability with progressively fewer samples, suggesting viral entry into the recovery phase coinciding with symptom alleviation. Statistical analysis revealed significant differences in viral loads compared to Day 0 on Days 4 and 5 (P<0.05). When compared to Day 2, statistically significant differences emerged on Days 3, 4, 5, 6, and 7, with an additional significant difference observed between Days 2 and 4. These findings demonstrate clear temporal dynamics of CHIKV viremia throughout disease progression. Our analysis establishes that pre-symptomatic testing (Day −1) provides critical opportunities for screening imported cases and high-risk contacts, while the peak viremic window (Days 0–7) represents both maximal symptom severity and the optimal timeframe for clinical sampling to minimize false negatives.
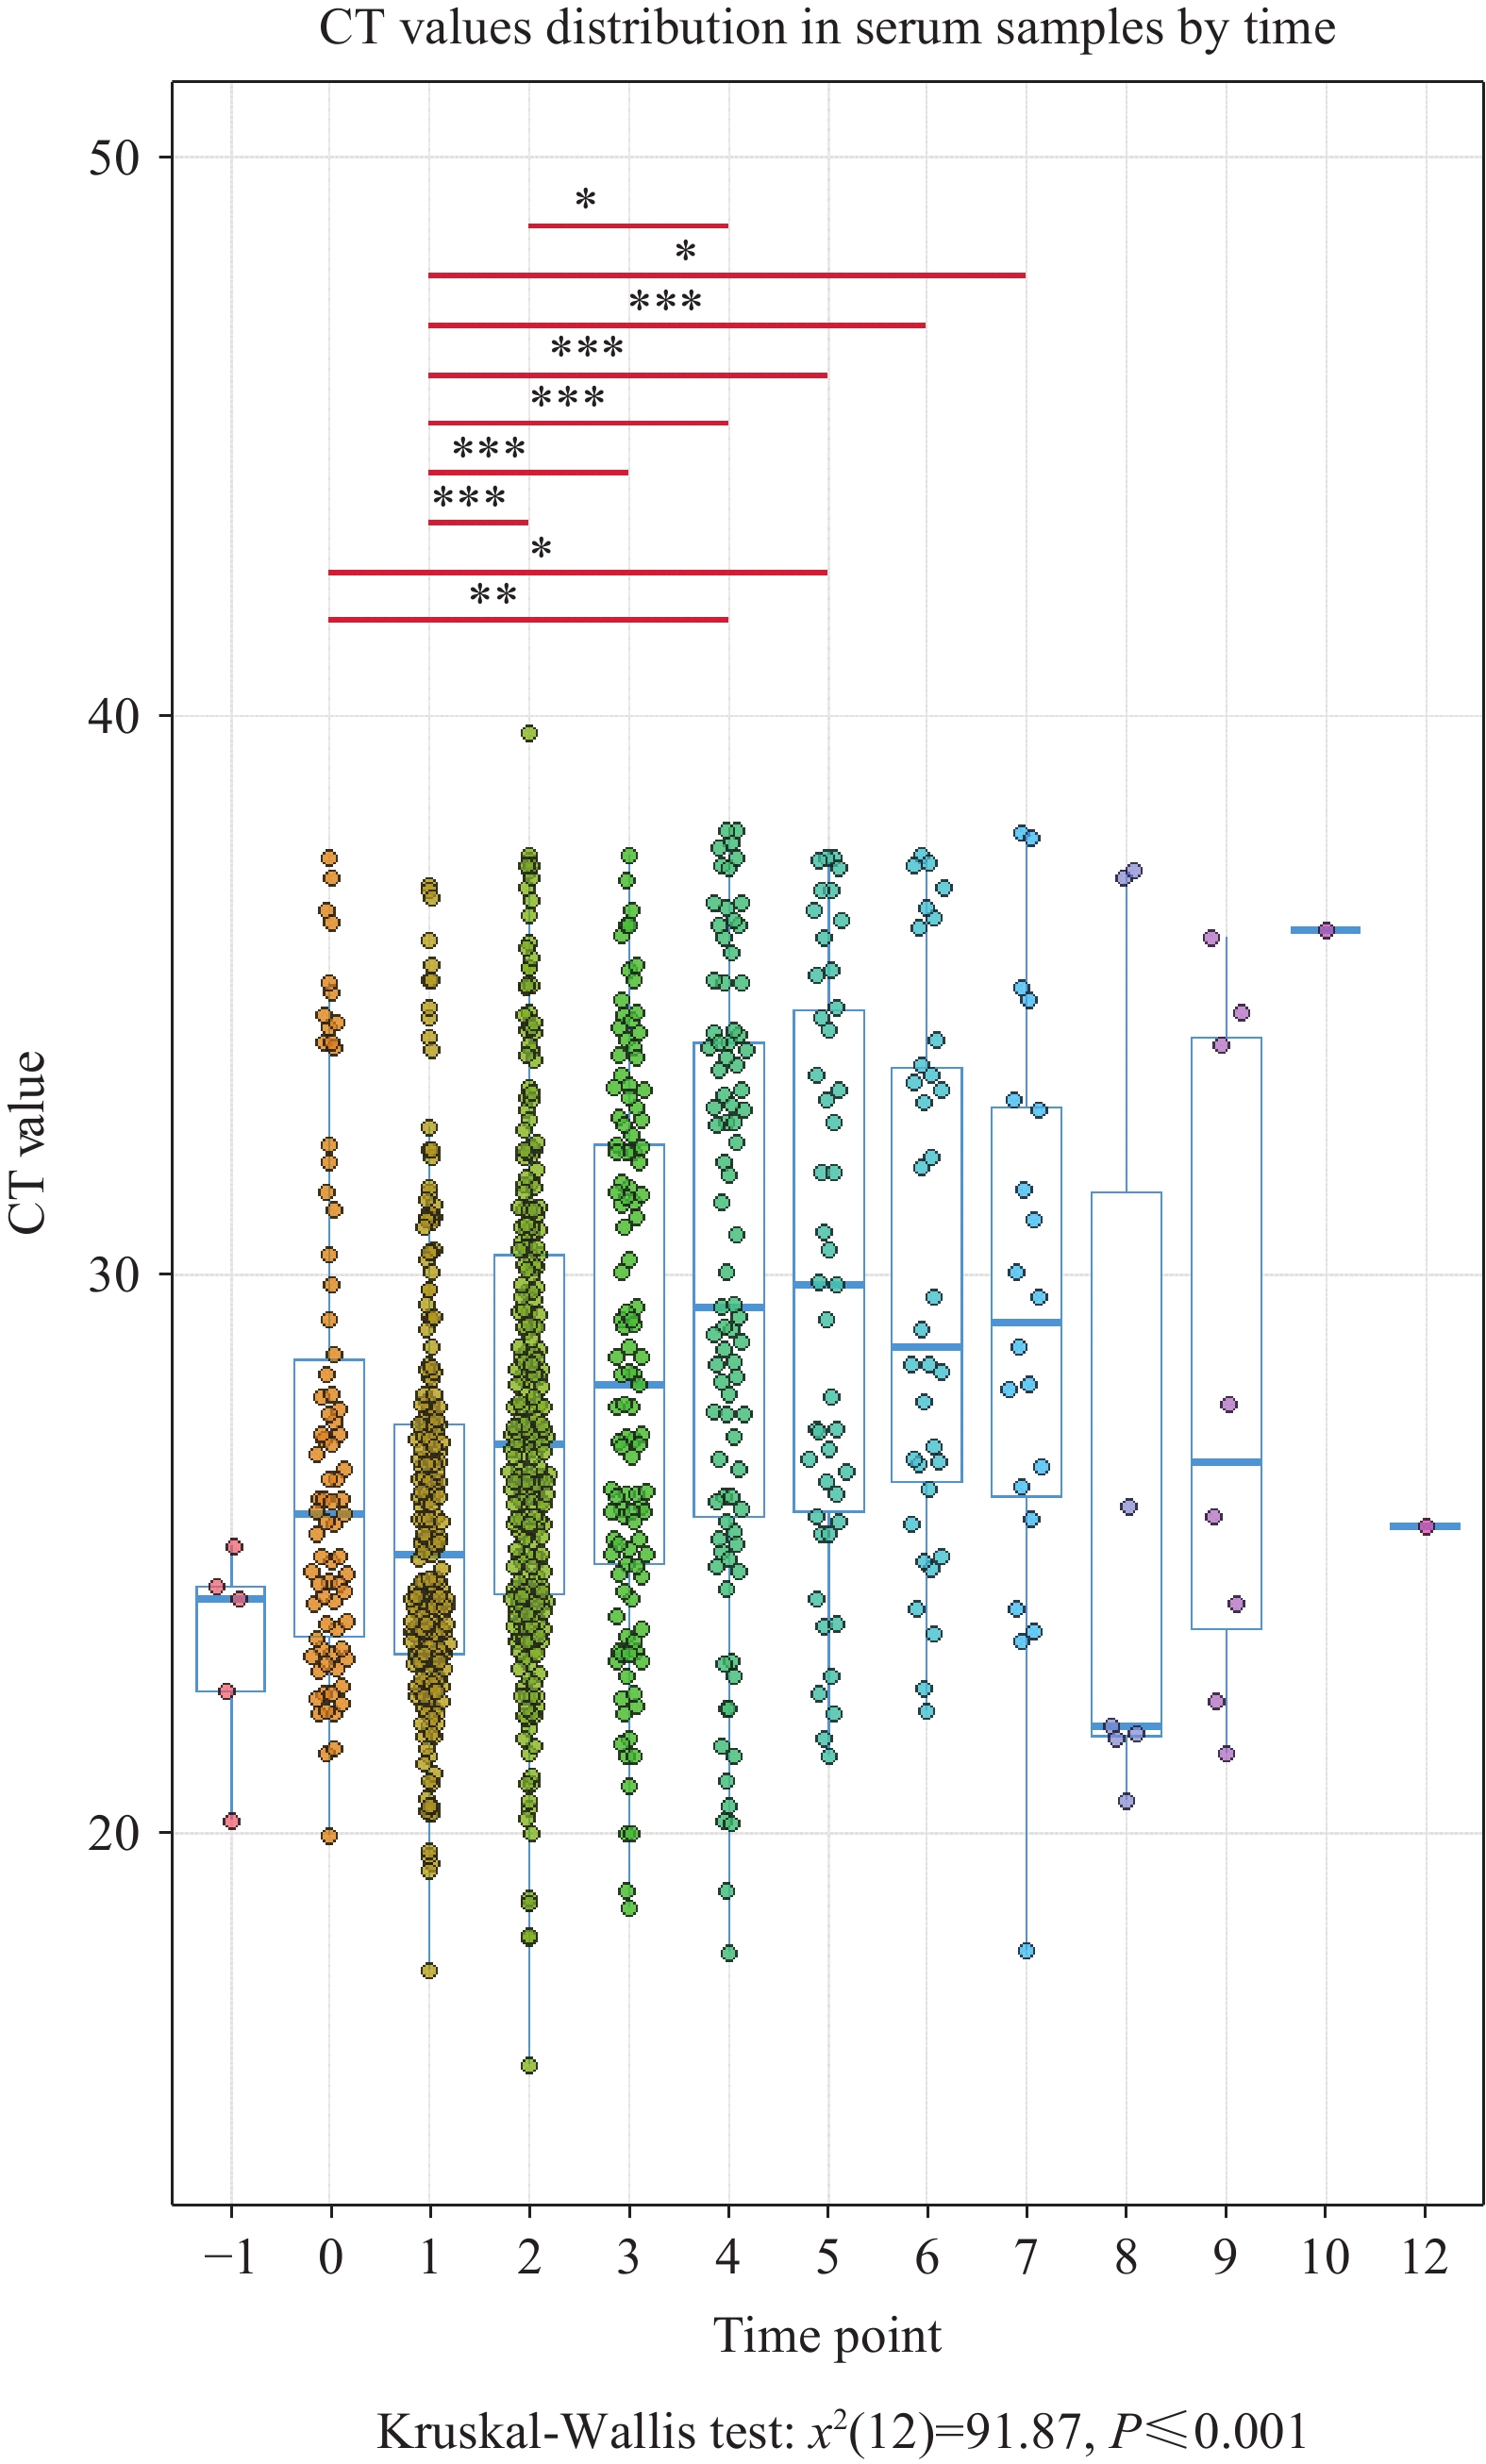 Figure 2.
Comparison of CT values for viral nucleic acid in serum across different time points post-symptom onset.
Note: For the box-and-whisker plots in these figures: The box represents the interquartile range (IQR), containing the middle 50% of the data. The line inside the box is the median (the 50th percentile). The whiskers extend to the minimum and maximum values within 1.5 times the IQR from the quartiles. Outliers, if present, are plotted as individual points beyond the whiskers.
Abbreviation: IQR=interquartile range; CT=cycle threshold; CHIKV= Chikungunya virus.
-
Chikungunya fever represents a significant public health challenge caused by the CHIKV, an arthropod-borne pathogen transmitted through Aedes mosquito vectors. Following transmission, infected individuals typically develop debilitating symptoms, most notably severe polyarthralgia that can persist for months beyond the acute phase (11).
Our comprehensive analysis of 1,156 clinical specimens collected by the Guangdong Provincial Center for Disease Control and Prevention from four hospitals in Shunde District yielded several critical insights with immediate implications for clinical practice and outbreak management. First, serum consistently demonstrated superior performance as the diagnostic specimen of choice for CHIKV detection, exhibiting substantially higher viral loads compared to alternative sample types such as saliva, urine, and throat swabs. This finding reinforces serum’s established role as the gold standard for acute-phase viral diagnosis. Second, our detection of viral RNA in serum samples collected 24 hours before symptom onset represents a pivotal discovery for public health surveillance. This pre-symptomatic detectability provides a crucial window for intercepting imported cases at ports of entry and enables more effective contact tracing protocols during epidemic responses. Third, we identified Days 0–7 post-symptom onset as the optimal diagnostic window, characterized by peak viral replication and maximal detection sensitivity. Beyond Day 8, viral clearance begins, necessitating the integration of serological testing to complement molecular diagnostics and prevent false-negative results during the convalescent phase.
Several limitations warrant consideration in interpreting these findings. The restricted sample sizes for non-serum specimens (saliva, urine, throat swabs) may limit the generalizability of our comparative analyses across specimen types. Additionally, our cohort consisted primarily of mild to moderate cases, potentially limiting applicability to severe disease presentations. Future studies should incorporate larger sample sizes across all specimen types and include patients with varying disease severity to validate these temporal patterns. The practical implications of our findings extend beyond clinical diagnostics to encompass broader outbreak control strategies. The demonstration of pre-symptomatic viral detectability supports enhanced screening protocols at international borders, particularly for travelers from endemic regions. Furthermore, the clearly defined optimal sampling window (Days 0–7) enables healthcare systems to allocate diagnostic resources more efficiently while minimizing false-negative rates. These evidence-based recommendations provide a robust framework for improving both individual patient care and population-level disease surveillance during chikungunya outbreaks.
-
Approval from the Medical Research Ethics Committee of the Guangdong Provincial Center for Disease Control and Prevention under approval number W96-027E-202516.
HTML
| Citation: |

|