
 Download:


HTML
-
Introduction: Southern Xinjiang Uygur Autonomous Region, China, experiences a substantial tuberculosis burden, yet comprehensive genotypic characterization of Mycobacterium tuberculosis strains in this region remains limited.
Methods: This study collected Mycobacterium tuberculosis strains and corresponding epidemiological data from patients between 2021 and 2023. Bacterial isolates underwent whole-genome sequencing using the Illumina next-generation sequencing platform. We constructed phylogenetic trees using iqtree and generated minimum spanning trees based on GraphSNP analysis, applying a clustering threshold of 12 single nucleotide polymorphisms (SNPs) to identify transmission clusters.
Results: Lineage 2 emerged as the predominant strain type, accounting for the majority of isolates, followed by Lineages 4 and 3. Notably, Lineage 2 demonstrated significantly elevated clustering rates compared to other lineages. Genetic diversity analysis revealed that Lineage 2 strains exhibited the most limited intra-lineage variation, whereas Lineage 3 displayed the greatest genetic heterogeneity among strains.
Conclusion: Our investigation demonstrates substantial genetic polymorphism among Mycobacterium tuberculosis strains circulating in southern Xinjiang. These findings highlight the critical need for enhanced transmission control strategies, with particular emphasis on intensive surveillance and prevention measures targeting Lineage 2 strains.
-
Tuberculosis (TB), a chronic infectious disease caused by Mycobacterium tuberculosis (MTB), continues to pose a substantial global public health challenge. According to the World Health Organization’s 2023 Global TB Report, China ranked third in estimated TB incidence among 30 high-burden countries in 2022 (1). Within China, Xinjiang Uygur Autonomous Region has consistently maintained one of the highest tuberculosis burdens nationwide. Despite this epidemiological significance, the genotypic characteristics of circulating MTB strains in Xinjiang remain inadequately characterized. To date, nine human-adapted lineages of Mycobacterium tuberculosis have been identified (2–3), each demonstrating distinct geographical distribution patterns and unique global dissemination trajectories (4–6). Given Xinjiang’s strategic geographical position at the crossroads of Central Asia, the region has likely developed distinctive MTB lineage characteristics that warrant comprehensive investigation.
We collected M. tuberculosis isolates and corresponding patient information from seven counties and cities in southern Xinjiang between 2021 and 2023. Written informed consent was obtained from all participants, and the study received approval from the central ethics review committee prior to sample collection. All isolates underwent subculturing on Lowenstein-Jensen media before DNA extraction using the cetyltrimethylammonium bromide (CTAB) method. Genomic DNA from each isolate was sequenced using Illumina PE 150 technology with 350 bp paired-end reads. For samples where the proportion of sequence classification to Mycobacterium tuberculosis complex (MTBC) fell below the established threshold of 90%, subsequent analytical modules were excluded to eliminate potential interference from nontuberculous mycobacteria and sample contamination.
Raw sequencing data underwent quality filtering using Fastp software. Strain identification was performed using Kraken 2, while lineage identification and drug resistance prediction were conducted using TB-Profiler. SNP detection was carried out using Samtools and bcftools. SNP differences were visualized through R-generated heatmaps, and population evolutionary analysis was performed using RAxML.
Supplementary Table S1 presents the demographic characteristics of 472 isolates across population, temporal, and geographical parameters. The majority of cases (62.5%) occurred in the 56–75 age group, with a relatively balanced gender distribution (46.2% male, 53.8% female). Of the 472 isolates analyzed, 437 were confirmed as M. tuberculosis.Supplementary Table S2 details the distribution of M. tuberculosis lineages and their respective clustering rates (SNP distance <12 served as the clustering criterion). Lineage 2 predominated (46.9%), followed by lineage 4 (25.6%) and lineage 3 (23.3%). Although lineage 2 exhibited a higher clustering rate (25.9%) compared to lineages 3 and 4 (both 19.6%), these differences were not statistically significant (χ2=2.136, P=0.314).A comprehensive heatmap was constructed to visualize SNP differences among all samples, incorporating drug resistance classifications and lineage identification data (Figure 1). Additionally, a population evolutionary tree was generated based on whole genome sequencing data, integrating lineage identification and drug resistance prediction results (Figure 2).
 Figure 1.
SNP distance heatmap.
Note: The hierarchical clustering dendrograms displayed on the left and top margins represent sample clustering patterns based on SNP differences. The upper panel illustrates drug resistance classifications and lineage information for each sample, with corresponding color annotations detailed in the legend. The central heatmap visualizes the SNP difference matrix, where each cell represents the SNP difference between samples corresponding to the horizontal and vertical axes. The color scale on the right indicates the magnitude of SNP differences. The heatmap clearly demonstrates the correlation patterns between lineage distributions and SNP differences.
Abbreviation: SNP=single nucleotide polymorphism.
 Figure 2.
Population evolutionary tree diagram.
Note: A population evolutionary tree constructed from whole-genome sequencing SNP data of Mycobacterium tuberculosis, with branch lengths representing evolutionary distances. The right panel displays lineage identification and drug resistance prediction results. The color scheme for lineage identification and drug resistance classification is detailed in the legend. For individual drug resistance results, black indicates resistance while gray indicates susceptibility.
Abbreviation: SNP=single nucleotide polymorphism.
Figure 3 illustrates the genetic distance networks within transmission clusters. While most transmission clusters remained geographically localized, four clusters demonstrated cross-regional transmission, exemplified by the largest cluster (C1) spanning Aksu City, Wushi County, and Shache County. Among all clusters, 10 contained 22 strains exhibiting genotypic resistance. Figure 4A reveals significant lineage-specific variations in genetic diversity, with lineage 2 demonstrating the lowest intra-lineage genetic variation and lineage 3 displaying the highest. Figure 4B demonstrates that while lineage 2 generally exhibits higher clustering rates, at lower thresholds (e.g., 5 SNPs), lineage 3 shows the highest clustering rate and lineage 2 the lowest. These patterns suggest sustained long-term transmission of lineage 2 in the region, whereas lineages 3 and 4 demonstrate evidence of increased recent transmission activity (within the past decade).
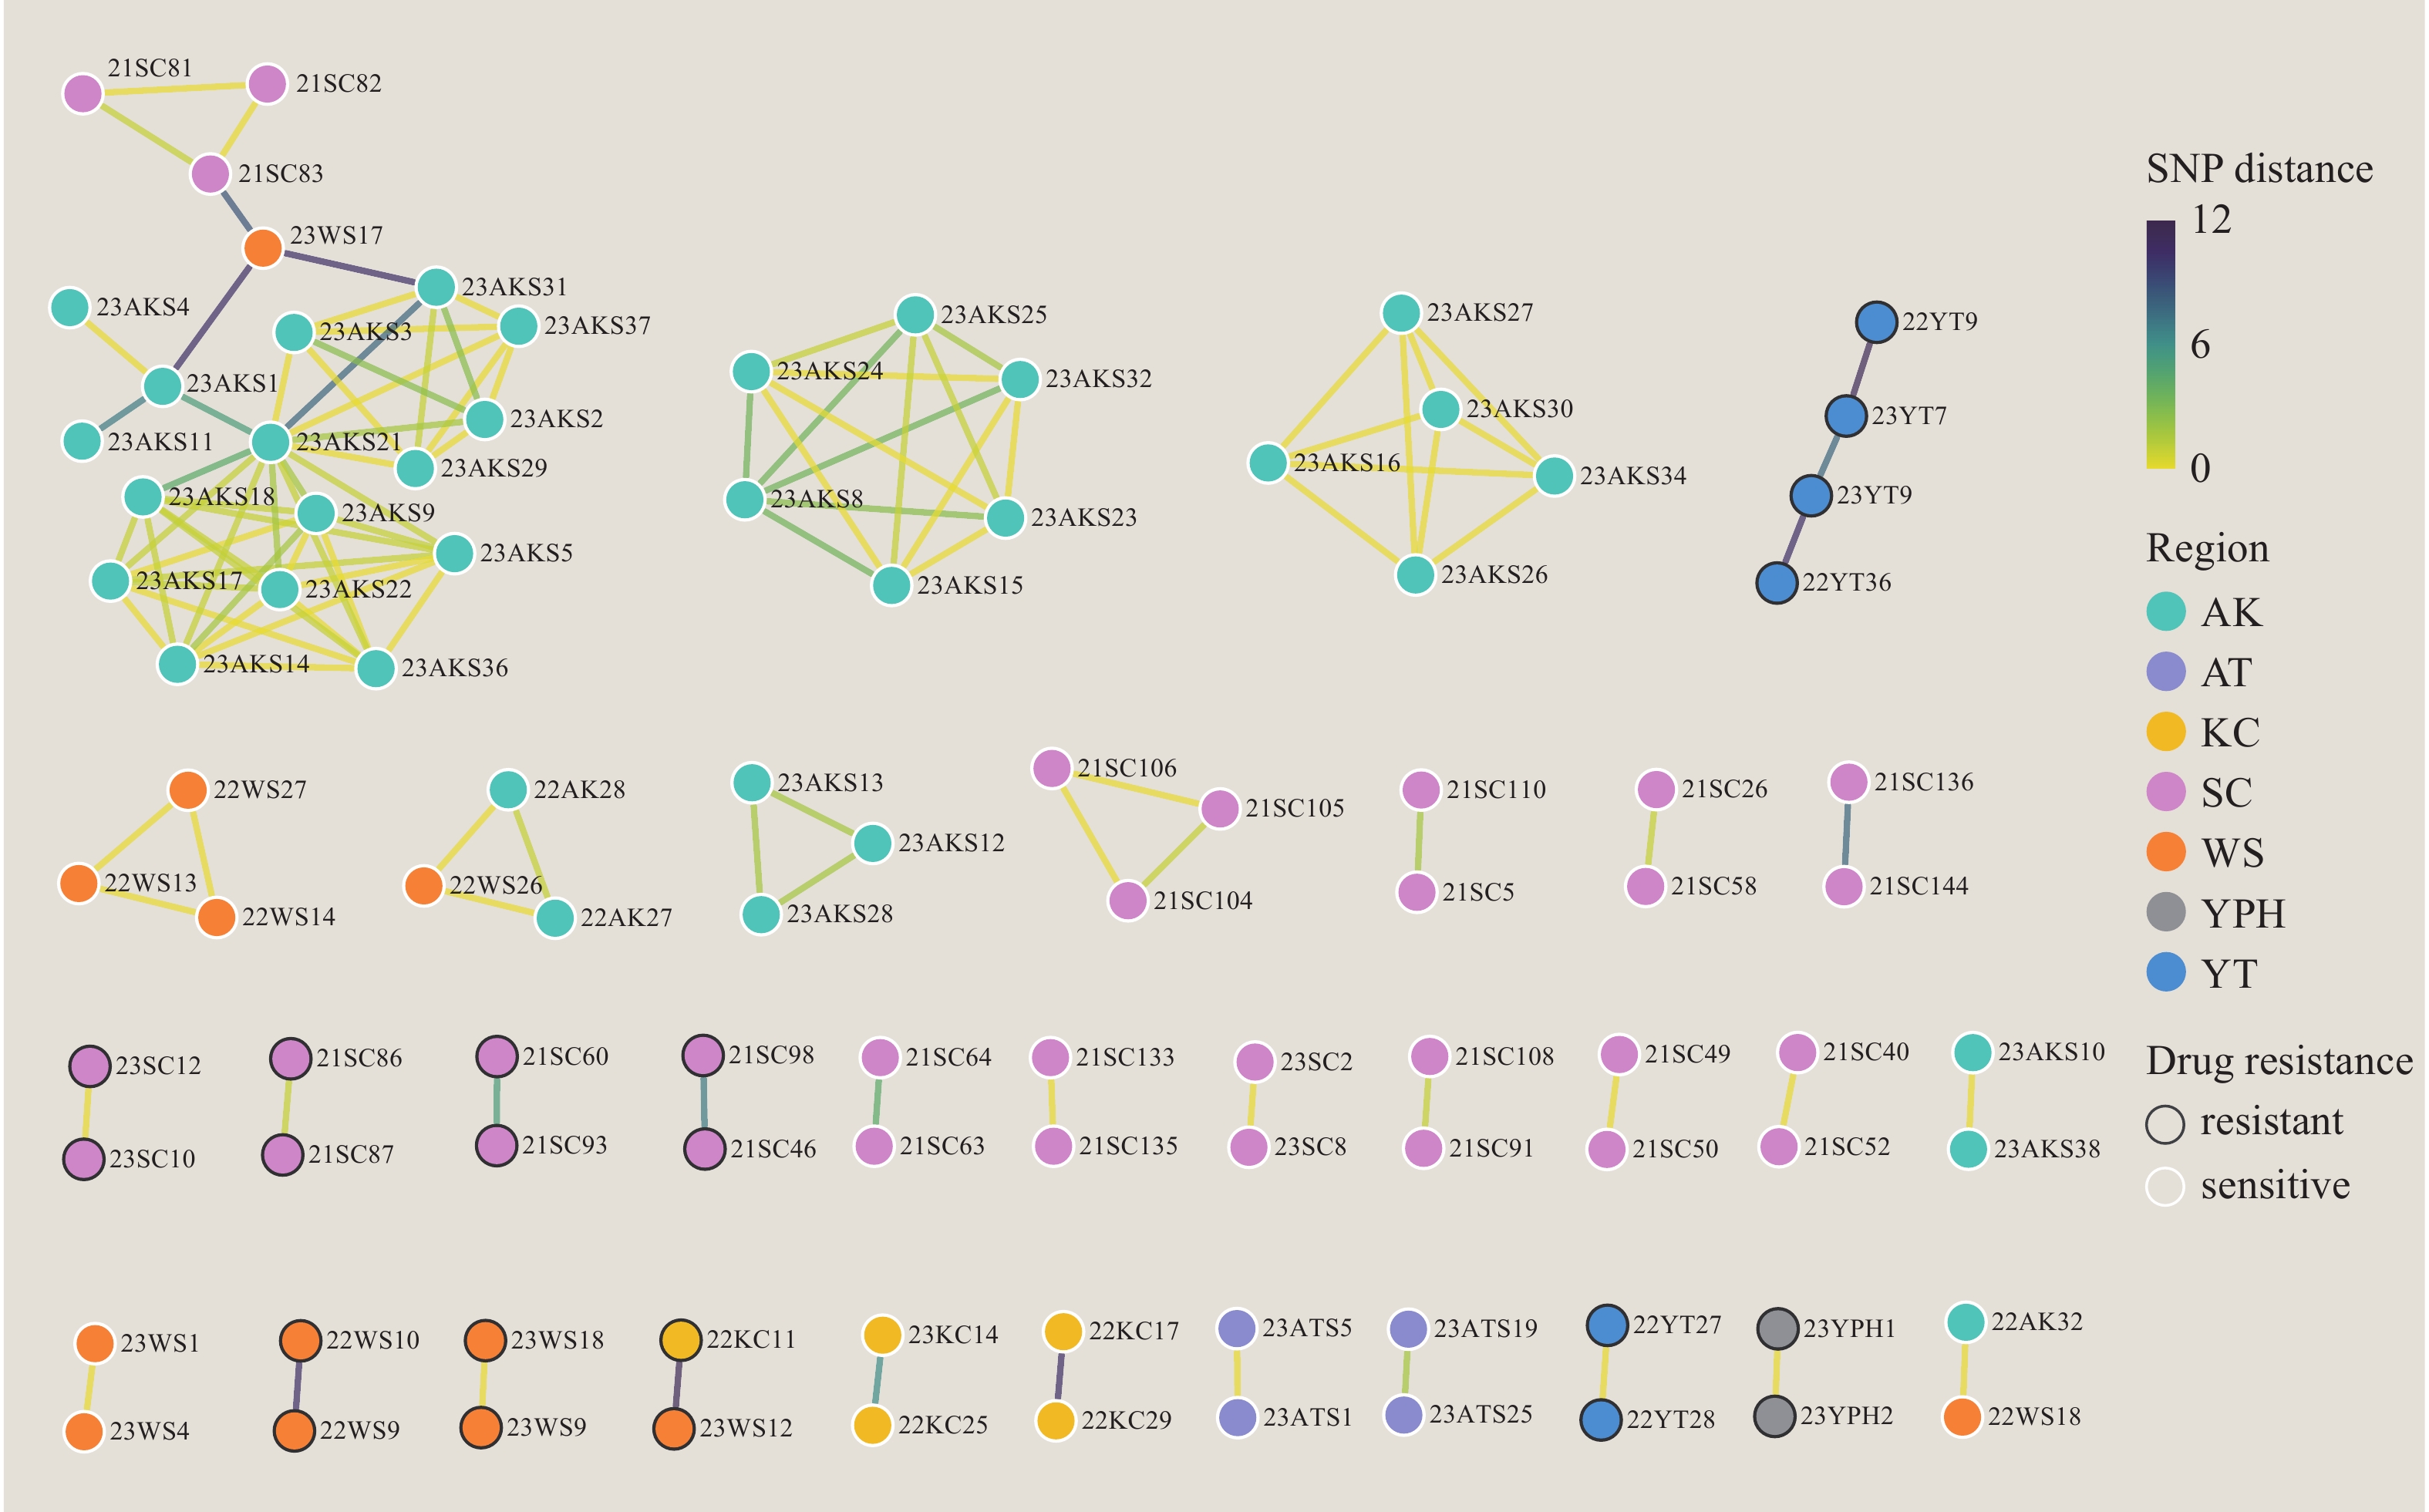 Figure 3.
Visual network of all transmission clusters.
Note: Network visualization depicting strain relationships where individual nodes represent bacterial strains and connecting edges indicate SNP differences between strains. Node interior colors denote sampling regions, while outer ring colors indicate the presence of drug-resistance mutations. Edge colors transition from yellow to green, representing SNP differences ranging from 0 to 12.
Abbreviation: AK=Aksu; WS=Wushi; KC=Kuche; YT=Yutian; YP=Yuepuhu; SC=Shache; AT=Atushi; SNP=single nucleotide polymorphism.
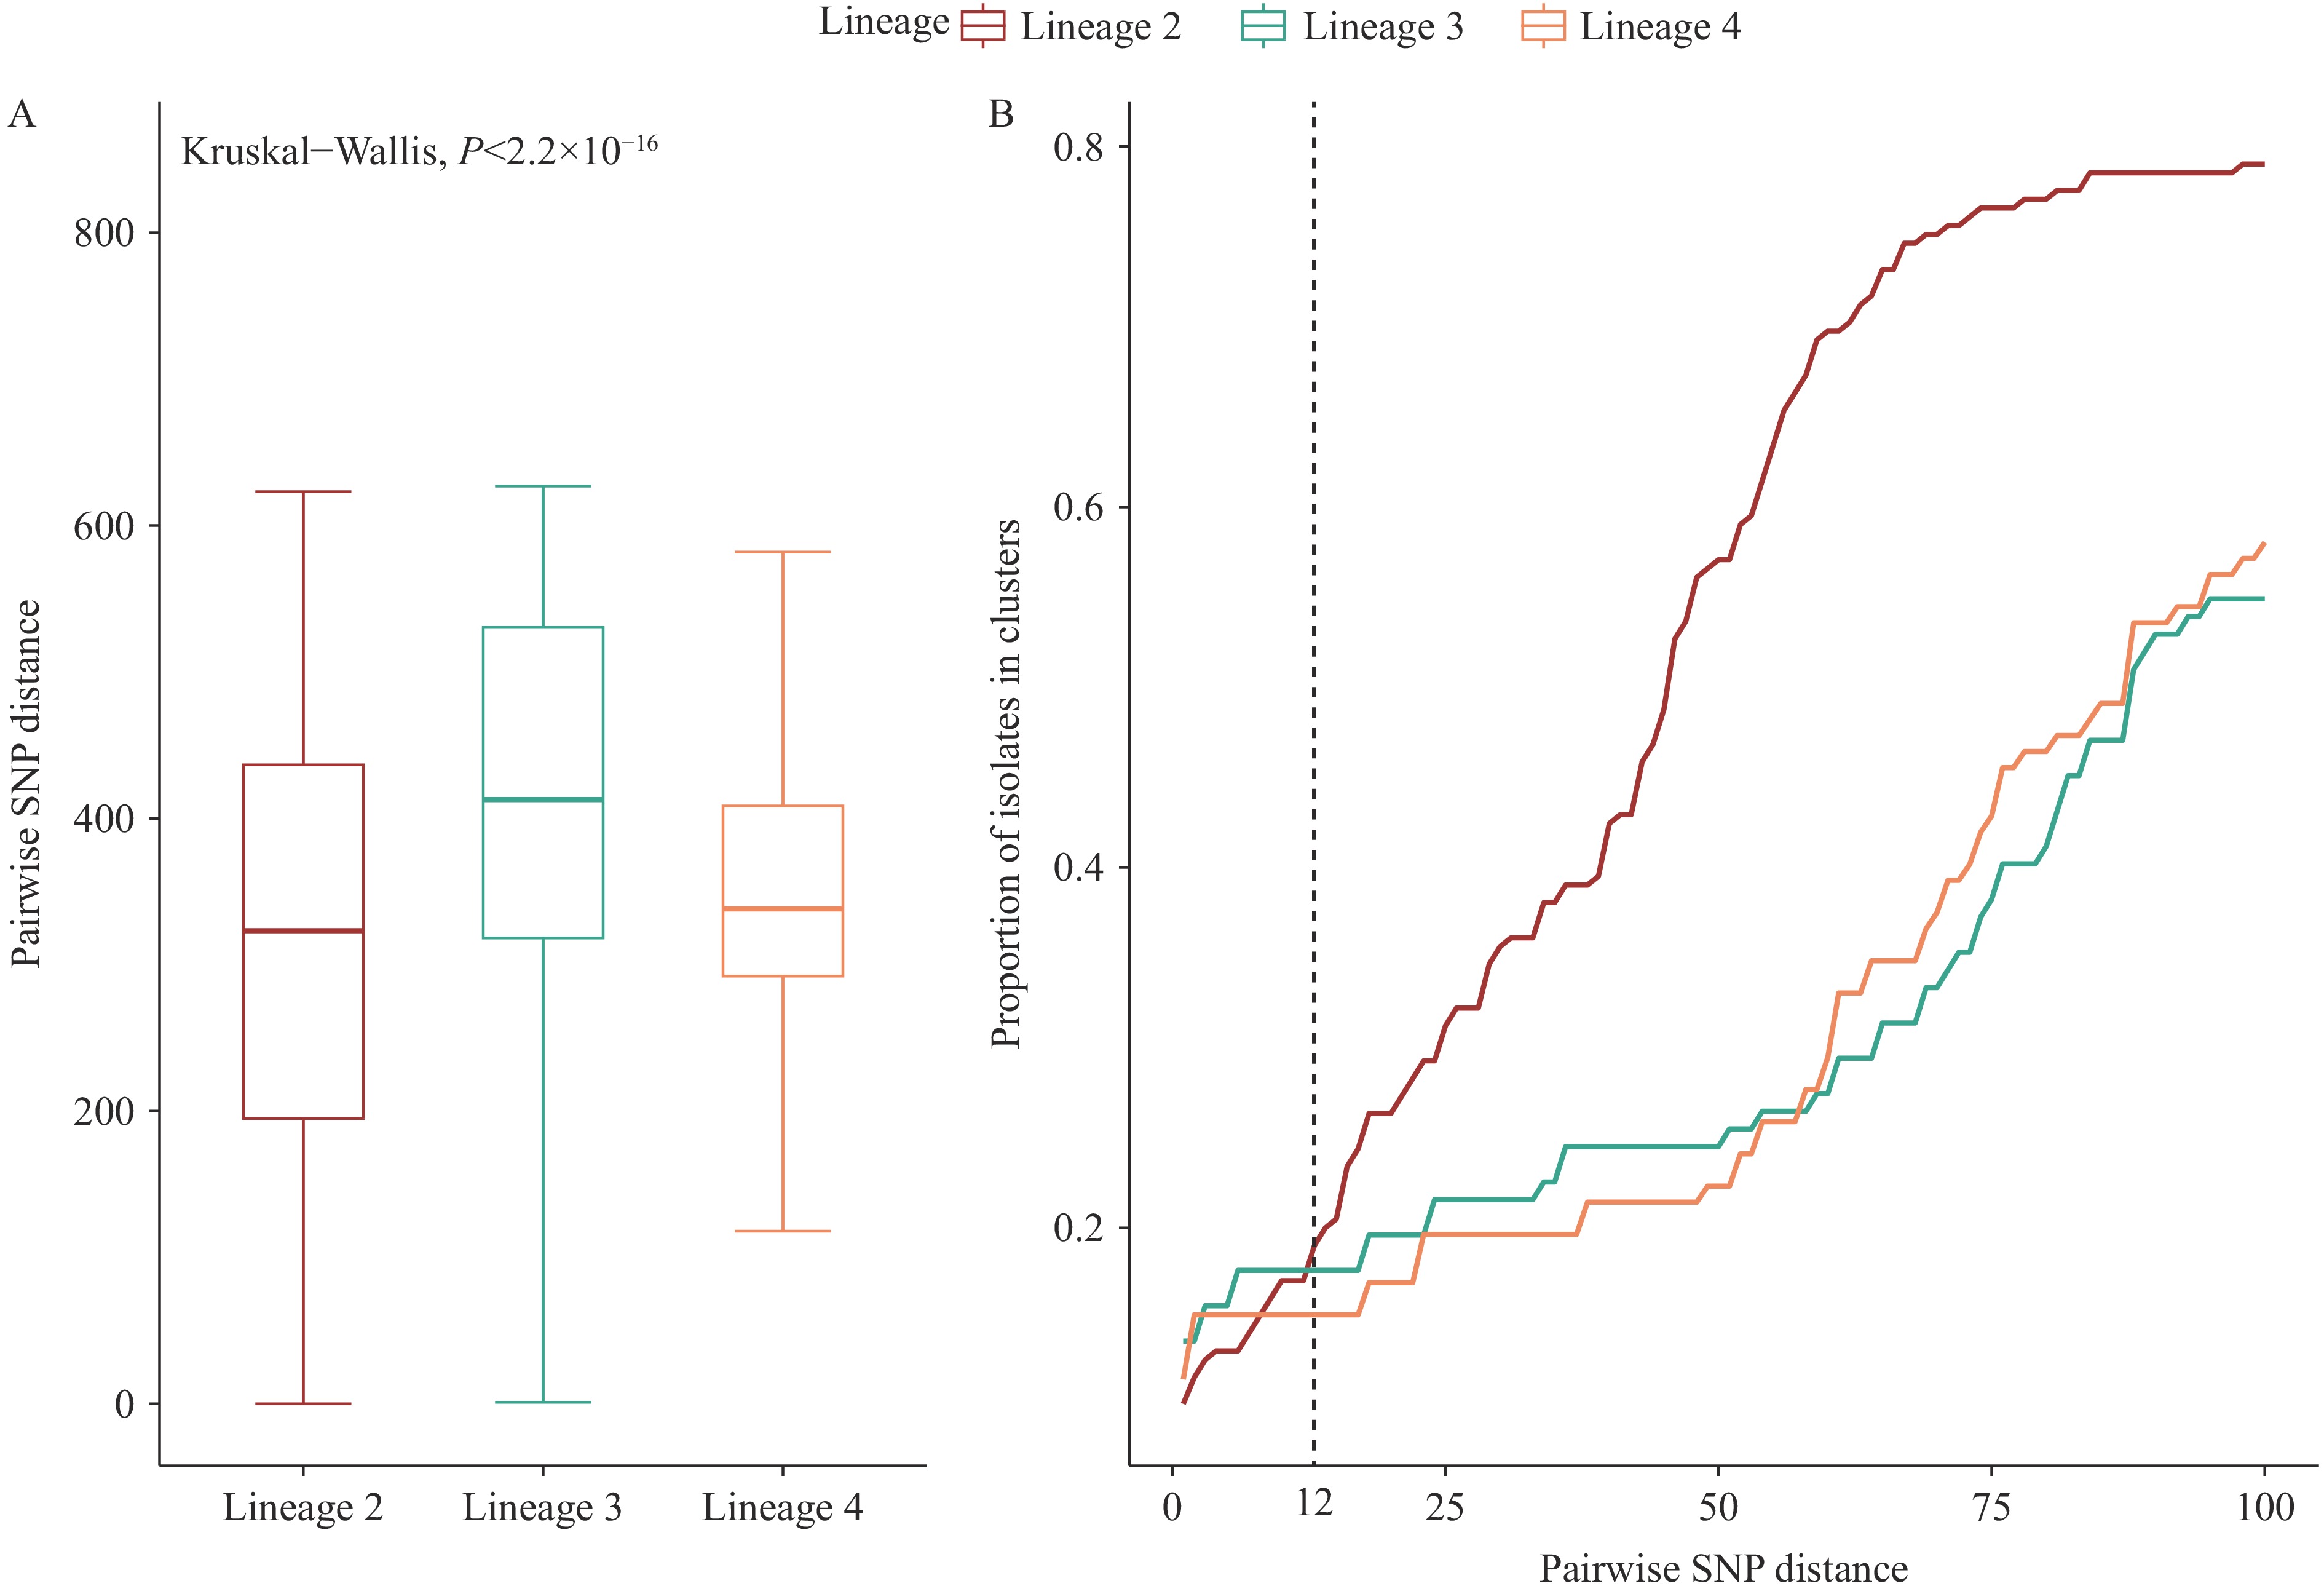 Figure 4.
Comparison of genetic distance and clustering among different lineages. (A) Box plot distribution of inter-strain SNP differences across the three lineages. (B) Cumulative clustering ratio curves for the three bacterial lineages using varying SNP difference thresholds (1–100) for transmission clustering.
Note: For (B), the clustering rates at different thresholds reflect lineage-specific clustering patterns and indirectly indicate transmission scales across different time periods.
-
Understanding the molecular epidemiology of tuberculosis is essential for achieving the World Health Organization’s “End TB” strategy goals. This research provides comprehensive molecular-level insights into TB transmission dynamics across southern Xinjiang, revealing important patterns that inform regional control strategies. The Beijing genotype (Lineage 2) predominates in southern Xinjiang, accounting for 46.9% of isolates. This prevalence is notably lower than previous regional studies, including reports by Yuan et al. (7) (57.5%) and Anwaierjiang, A et al. (8) (58.4%), as well as findings from northern and southern China (76.5% and 53.2%, respectively) (9). While Lineages 2 and 4 demonstrate widespread global distribution (10-11), our findings reflect Xinjiang’s distinctive position as a historical crossroads along the ancient Silk Road Economic Belt. Notably, Lineage 3, which has been extensively documented throughout historical Silk Road regions and northwestern China (12), was also identified in neighboring provinces, including Tibet and Qinghai (13). The rapid global expansion of Lineage 2 over the past two centuries may be attributed to its enhanced transmission capacity and propensity for drug resistance development, which correlates with the higher clustering rate observed for Lineage 2 in our study (14).
Genetic distance analysis enables precise characterization of tuberculosis transmission patterns and identification of potential multiple transmission sources within communities. The overall clustering rate of 22.2% observed in southern Xinjiang approximates that reported in Shanghai (25.2%) while substantially exceeding rates documented in Shenzhen (12.2%) (15-16). Our investigation revealed mixed lineage infections across all seven studied counties and cities, indicating elevated levels of recent transmission activity. This transmission pattern likely reflects the complex interplay of local cultural practices, housing conditions, and socioeconomic determinants that facilitate disease spread, warranting comprehensive epidemiological investigation.
As Xinjiang assumes an increasingly pivotal role in China’s Belt and Road Initiative, expanding economic cooperation and human mobility with the five Central Asian republics necessitates enhanced infectious disease surveillance systems. This evolving landscape demands strengthened international collaboration in tuberculosis control, particularly through research and development of innovative diagnostic technologies, targeted support for border regions, and establishment of robust cross-border prevention mechanisms. Such coordinated multilateral efforts are fundamental to achieving the ambitious “End TB” strategy objectives by 2030. Future research should incorporate larger sample sizes and extended temporal frameworks to strengthen these preliminary findings and guide evidence-based policy development.
-
Dr. Wang Xiaoyin’s team at the Zhejiang Provincial Center for Disease Control and Prevention for their invaluable contributions. The essential support and assistance provided by the Centers for Disease Control and Prevention in Kashgar, Hotan, Kezhou, and Aksu regions.
| Citation: |

|