
 Download:


-
Tuberculosis (TB) remains a significant global public health challenge. In 2022, approximately 10.6 million cases and 1.3 million deaths were reported worldwide (1). China has achieved substantial progress in reducing TB incidence, with a 3.1% annual decline between 2010 and 2022 (2–3). In 2022, the estimated number of new TB cases in China was 748,000 (1). However, a considerable gap persists between this progress and the World Health Organization (WHO)’s goal of ending TB by 2035. In 2023, the reported incidence rate of tuberculosis in China decreased to 43.49 per 100,000 people. However, significant disparities persist in reported incidence rates across different regions and populations, underscoring the need for targeted control measures tailored to specific areas and groups to enhance disease prevention effectiveness. Understanding the characteristics of diverse populations facilitates precise and localized interventions, with the migrant population emerging as a key demographic requiring focused attention. Many studies have demonstrated that human migration is an important factor that needs to be taken into consideration in the endeavor of preventing and controlling infectious diseases (4). Population mobility also has an impact on TB control (4–5).
In China, unbalanced economic development drives migration patterns, with individuals from less-developed regions commonly relocating to developed provincial-level administrative divisions (PLADs) seeking enhanced employment opportunities and higher incomes. According to the seventh National Population Census conducted by the National Bureau of Statistics of China in 2020, China’s population movement has become increasingly active, with the migrant population growth rate accelerating and approaching 380 million individuals (6). Multiple factors create substantial challenges for TB prevention and control among migrant populations. Migrant populations, particularly manual laborers whose living conditions and medical security are inferior to those of local workers, face circumstances that impede effective TB prevention and control. To enhance TB patient management within this demographic, the Chinese Anti-Tuberculosis Association issued the “Guidelines for the Management of Tuberculosis in Migrant Population” in 2021, emphasizing the critical importance of standardized TB management for this population (7).
Based on administrative divisions, the migrant population is categorized into intra-provincial and inter-provincial groups. Compared to intra-provincial migrants, inter-provincial migrants exhibit distinct characteristics (8–9). First, regarding the size of the floating population, recent trends in cross-provincial mobility have revealed new trends. Between 2007 and 2022, inter-provincial migration peaked in 2020 but demonstrated a sharp decline in subsequent years, with certain first-tier cities (e.g., Beijing) experiencing negative growth in their floating population sizes. Several provinces, including Henan, Jiangxi, and Hunan, exhibited net out-migration patterns in 2022, indicating regional shifts in migration attractiveness. Second, inter-provincial population movement primarily followed unidirectional inflow or outflow patterns, with relatively limited bidirectional interaction. This contrasts with the more cyclical or reciprocal movement patterns typically observed within provincial boundaries and suggests persistent pressures in inflow cities. Third, due to administrative divisions, service provision and management for inter-provincial floating populations face more complex challenges than those for intra-provincial mobility.This study focuses on epidemiological analysis of TB cases among inter-provincial migrants (TBIM) to provide evidence-based recommendations for improved prevention and control of TBIM.
HTML
-
China’s Tuberculosis Information Management System (TBIMS) is a web-based database launched in 2005, which encompasses all collected TB patients’ basic information, diagnosis, treatment, management and outcome information and other related details. We extracted data on reported TB cases from 2019–2023 from the TBIMS, including both confirmed and clinically diagnosed cases across 31 PLADs in China. After removing personally identifiable information, we extracted relevant variables including sex, age, year of diagnosis, registration address, current address code, permanent address code, and treatment-related information. However, we excluded cases with extrapulmonary tuberculosis only, cases with diagnostic changes to other diseases, cases with virtual medical records, and cases with nontuberculous mycobacteria (NTM).
We defined inter-provincial migrants as individuals whose current address code differed from their permanent address code in the first two digits, which represent provincial administrative divisions. We analyzed the characteristics of inter-provincial migrants, including demographic features, inter-provincial mobility patterns, diagnostic classifications, treatment outcomes, and other epidemiological factors. We performed all data processing and statistical analyses using R software (version 4.4.0, Vienna, Austria) and Microsoft Excel 2021 (Redmond, USA). We described the data using rates and constituent ratios as appropriate. Trend statistical analysis was performed using the Cochran-Armitage trend test.
-
A total of 3,077,951 TB cases were reported from 2019 to 2023, of which 123,945 cases (4.03%) were inter-provincial migrants. TBMI cases decreased from 30,425 in 2019 to 19,801 in 2023. Among TBIM cases, males comprised 66.2% of the population. Individuals aged 15–44 years represented 65.6% of cases, constituting the predominant demographic group. The proportion of the 45–64 age group demonstrated a significant annual increase (Z=20.42, P<0.001), rising from 24.9% in 2019 to 32.6% in 2023, corresponding to an average annual growth rate of 6.9%. Similarly, the ≥65 age group exhibited a marked upward trend (Z=21.59, P<0.001), rising from 4.5% to 8.8% during the same period, reflecting an 18.25% average annual increase. The occupational distribution of inter-provincial TB migrants is presented in Table 1.
Groups 2019 n (%) 2020 n (%) 2021 n (%) 2022 n (%) 2023 n (%) Total n (%) Sex Male 20,362 (66.9) 16,859 (65.7) 18,110 (65.8) 13,532 (65.9) 13,185 (66.6) 82,048 (66.2) Female 10,063 (33.1) 8,814 (34.3) 9,406 (34.2) 6,998 (34.1) 6,616 (33.4) 41,897 (33.8) Age (years) 0–14 160 (0.5) 145 (0.6) 123 (0.4) 114 (0.6) 103 (0.5) 645 (0.5) 15–44 21,296 (70.0) 17,587 (68.5) 18,065 (65.7) 12,852 (62.6) 12,502 (58.1) 81,302 (65.6) 45–64 7,585 (24.9) 6,715 (26.2) 7,680 (27.9) 6,126 (29.8) 6,450 (32.6) 34,556 (27.9) ≥65 1,384 (4.5) 1,226 (4.8) 1,648 (6.0) 1,438 (7.0) 1,746 (8.8) 7,442 (6.0) Occupations Children/students/teachers 1,605 (5.3) 1,251 (4.9) 1,309 (4.8) 902 (4.4) 834 (4.2) 5,901 (4.8) Staff/workers 12,429 (40.9) 10,245 (39.9) 10,559 (38.4) 7,034 (34.3) 5,950 (30.0) 46,217 (37.3) Farmers/herdsmen/fishermen/seafarers 4,762 (15.7) 3,926 (15.3) 3,856 (14.0) 3,299 (16.1) 3,568 (18.0) 19,411 (15.7) Retired/housework/unemployed 9,811 (32.2) 8,885 (34.6) 10,464 (38.0) 8,167 (39.8) 8,222 (41.5) 45,549 (36.7) Unknown and others 1,818 (6.0) 1,366 (5.3) 1,328 (4.8) 1,128 (5.5) 1,227 (6.2) 6,867 (5.5) Table 1. Characteristics of inter-provincial migrants in China, 2019–2023.
Among tuberculosis cases in inter-provincial migrants, the vast majority (93.0%) were newly treated patients. The proportion of re-treated cases showed a progressive annual rise (Z=7.48, P<0.001), increasing from 6.7% in 2019 to 8.2% in 2023. Laboratory confirmation was achieved in 70,858 cases (57.2%), while clinical diagnosis was established for 49,873 cases (40.2%). Cases lacking etiological evidence demonstrated a significant decreasing trend (Z=12.79, P<0.001), declining consistently over the study period. Drug susceptibility testing revealed that most patients (120,912 cases, 97.6%) harbored drug-susceptible strains, whereas 2.4% demonstrated drug resistance. Secondary tuberculosis represented the predominant disease classification (116,023 cases, 93.6%), with other forms comprising less than 7% of cases: primary tuberculosis (596 cases, 0.5%), hematogenous disseminated tuberculosis (580 cases, 0.5%), tracheobronchial tuberculosis (72 cases, 0.1%), and tuberculous pleurisy (5,845 cases, 4.7%). Treatment outcomes showed that 41.8% of inter-provincial tuberculosis migrants (51,812 cases) achieved cure, while 47.7% (59,166 cases) completed treatment successfully (Table 2).
Type 2019 n (%) 2020 n (%) 2021 n (%) 2022 n (%) 2023 n (%) Total n (%) Treatment classification Newly treated 28,388 (93.3) 24,075 (93.8) 25,670 (93.3) 18,989 (92.5) 18,187 (91.8) 115,309 (93.0) Re-treated 2,037 (6.7) 1,598 (6.2) 1,846 (6.7) 1,541 (7.5) 1,614 (8.2) 8,636 (7.0) Bacteriological diagnosis Positive 15,181 (49.9) 13,906 (54.2) 15,830 (57.5) 12,692 (61.8) 13,249 (66.9) 70,858 (57.2) Negative 14,138 (46.5) 11,150 (43.4) 11,028 (40.1) 7,318 (35.6) 6,239 (31.5) 49,873 (40.2) Missing 1,106 (3.6) 617 (2.4) 658 (2.4) 520 (2.5) 313 (1.6) 3,214 (2.6) Drug susceptibility Susceptible 29,683 (97.6) 24,995 (97.4) 26,862 (97.6) 20,052 (97.7) 19,320 (97.6) 120,912 (97.6) Resistant 742 (2.4) 678 (2.6) 654 (2.4) 478 (2.3) 481 (2.4) 3,033 (2.4) Classification of TB Primary TB 58 (0.2) 170 (0.7) 234 (0.9) 67 (0.3) 67 (0.3) 596 (0.5) Hematogenous disseminated TB 127 (0.4) 125 (0.5) 122 (0.4) 104 (0.5) 105 (0.5) 580 (0.5) Secondary TB 28,688 (94.3) 24,176 (94.2) 26,017 (94.6) 19,341 (94.2) 18,627 (94.1) 116,023 (93.6) Tracheobronchial TB 0 (0) 1 (0.0) 1 (0.0) 37 (0.2) 33 (0.2) 72 (0.1) Tuberculous pleurisy 1,552 (5.1) 1,201 (4.7) 1,142 (4.2) 981 (4.8) 969 (4.9) 5,845 (4.7) Treatment outcomes Cured 11,725 (38.5) 10,728 (41.8) 12,292 (44.7) 9,607 (46.8) Not available 44,352 (42.6) Treatment completed 16,608 (54.6) 13,265 (51.7) 13,622 (49.5) 9,494 (46.2) 52,989 (50.9) Adverse outcomes 1,640 (5.4) 1,379 (5.4) 1,365 (5.0) 1,165 (5.7) 5,549 (5.3) Missing 452 (1.5) 301 (1.2) 237 (0.9) 264 (1.3) 1,254 (1.2) Note: The above definition is sourced from the TBIMS system and aligns with the relevant definitions in the Definitions and reporting framework for tuberculosis (2013 revision).
Not available: As the data collection period did not meet the required statistical timeframe for treatment outcomes in 2023, no statistical analysis was conducted.
Abbreviation: TB=tuberculosis.Table 2. Diagnosis and treatment outcomes of TB among inter-provincial migrants in China, 2019–2023.
From 2019 to 2023, Most PLADs exhibit unidirectional characteristics, primarily characterized by either outflow or inflow. Guangdong Province reported the highest number of TBIM cases among all PLADs, autonomous regions, and municipalities in China (Figure 1A). The distribution of TBIM cases demonstrated significant geographic concentration, with five PLADs accounting for the vast majority: Guangdong (48,183 cases, 38.9%), Zhejiang (27,383 cases, 22.1%), Fujian (8,582 cases, 6.9%), Beijing (7,959 cases, 6.4%), and Shanghai (7,403 cases, 5.9%). These five regions collectively represented 80.3% of all reported TBIM cases (Figure 1A). Conversely, the PLADs with the highest outflow of migrant TB cases included Sichuan (15,155 cases, 12.23%), Hunan (14,707 cases, 11.87%), and Guizhou (13,927 cases, 11.24%), Jiangxi (8,892 cases, 7.147%), and Hubei (8,441 cases, 6.81%) (Figure 1A). Some provinces, such as Qinghai, Xizang, and Ningxia exhibited relatively stable mobility patterns, with consistently minimal inflows and outflows.
 Figure 1.
Flow patterns between PLADs for TBIM in China, 2019-2023. (A) The number of tuberculosis cases among inter-provincial migrants in China. (B) Key migration patterns between source and destination PLADs and the percentage of TB cases among inflow and outflow TB cases.
Abbreviation: PLADs=provincial-level administrative divisions; TB=tuberculosis; TBIM=TB cases amonginter-provincial migrants.Analysis of migration patterns revealed several critical relationships between major inflow and outflow PLADs, particularly involving Guangdong, Zhejiang, and Fujian as primary destinations; and Sichuan, Guizhou, and Hunan as major source regions. Among TBIM patients originating from Sichuan, 42.69% migrated to Guangdong, while approximately 49.82% of TBIM cases from Guizhou relocated to Zhejiang. The data further demonstrated that 77.13% of TBIM patients from Hunan chose Guangdong as their destination, and an overwhelming 88.69% of TBIM cases from Guangxi also migrated to Guangdong (Figure 1B).
Overall, the top five PLADs for TBMI inflow and outflow remained largely stable throughout the five-year period, with notable exceptions observed in specific years: Guangxi (2020) and Anhui (2022) among outflow provinces, and Shandong (2020) among inflow provinces (
Supplementary Figure S1 ). TBMI populations from major outflow PLADs predominantly migrated to economically developed regions — primarily Guangdong, Zhejiang, Fujian, Shanghai, and Jiangsu — with migration flows extending to all 31 provinces (Supplementary Figure S2 ).From 2019 to 2023, tuberculosis cases among inter-provincial migrants were reported consistently throughout all months of the year. The proportion of monthly TBIM cases relative to the annual total demonstrated notable seasonal variation, reaching its lowest point in February. The proportion increased progressively from March through August before declining again, with February representing the nadir during the Chinese New Year period, recording 6,498 cases and accounting for 5.24% of the total (Figure 2). Comparing the data from February each year, the proportion of TBIM patients was lowest in February 2020 and highest in February 2023. The growth pattern of TBIM patients from January to March 2023 differed from that observed in other years.
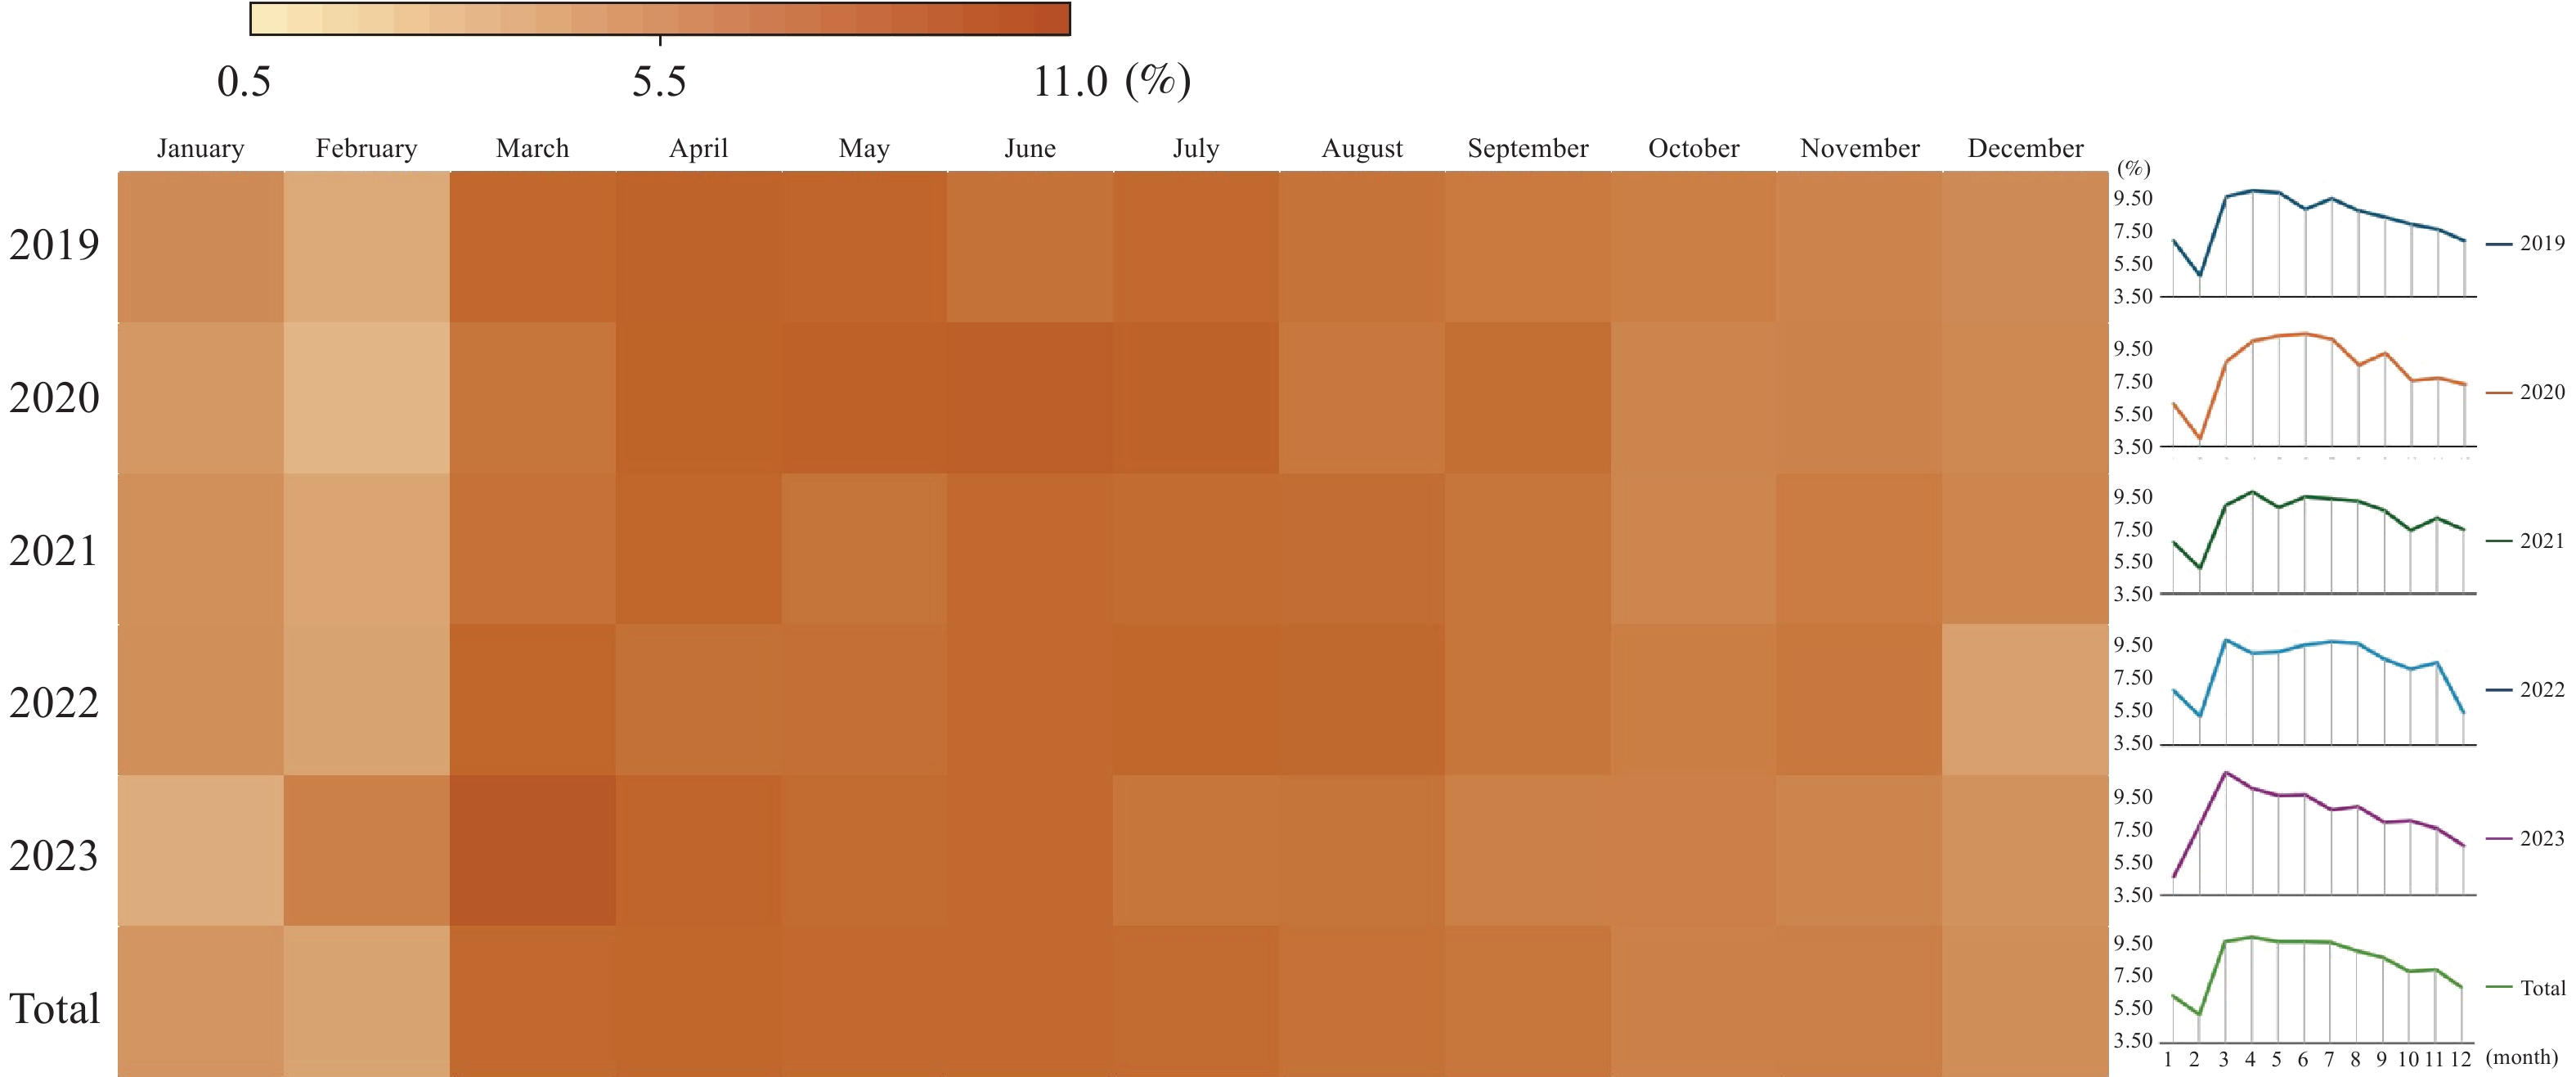 Figure 2.
Monthly distribution of TBIM in China from 2019 to 2023.
Note: The monthly proportion of TBIM patients relative to the annual total was visualized through both a heat map and a line graph, stratified by year and month.
-
China is a vast country with a large population and uneven economic development across regions. Additionally, people have the habit of returning to their hometowns or traveling during major holidays, all of which contribute to the high mobility of the population in China. This mobility facilitates disease transmission while intensifying demands for epidemic control — particularly for TB, which represents the third-highest global disease burden in China. Migrant populations also experience TB burden, with TB constituting the second most prevalent notifiable disease among interprovincial migrants during 2016−2020, characterized by elevated infection rates and extensive transmission scales (4). Our data indicate that inter-provincial migrants accounted for 4.03% of the total number of TB cases during the study period. TBIM were predominantly male (66.18%) and newly diagnosed (92.94%) TB cases. However, retreatment cases showed a significant upward trajectory (P<0.001). This may be related to their high mobility, which poses challenges such as treatment interruption, difficulty in tracking, and poor treatment adherence. Significant disparities exist between these migrants and local residents in terms of working and living environments, economic conditions, treatment adherence, and TB awareness (10–11). A study conducted in Kashgar Prefecture, Xinjiang Uygur Autonomous Region identified retreatment risk factors including low education level (primary school) [odds ratio (OR): 3.434, 95% confidence interval (CI): 1.861−6.337], BMI>24.00 (OR: 4.235, 95% CI: 1.277−7.877), non-standardized treatment (OR: 3.4346, 95% CI: 1.788−6.606), and smoking (OR: 3.970, 95% CI: 1.419−11.113)(12).
China’s migrant population has expanded dramatically alongside economic and social development in recent years. Intra-provincial migration consistently exceeds inter-provincial movement, with the 2020 population census documenting 251 million intra-provincial migrants compared to 125 million inter-provincial migrants (6). Between 2019 and 2023, we identified 123,945 TB cases among the inter-provincial migrant population. Although intra-provincial migrants substantially outnumber inter-provincial migrants, the distribution of TB cases between these groups has shifted over time. Research conducted by Hu Dongmei and colleagues demonstrated that TB cases among the migrant population totaled 76,188, 70,749, and 42,628 in 2019, 2020, and 2021, respectively (13). When combined with our current findings, the proportion of inter-provincial migrant TB patients relative to all migrant TB patients remained below 40% in 2019 and 2020 but increased substantially to 64.5% in 2021.
Geographically, TB patients demonstrate uneven distribution patterns as migrant populations relocate from economically underdeveloped regions to more prosperous areas. Recent reports indicate that Guizhou, Sichuan, Jiangxi, and Hunan, characterized by weaker economies, exhibit higher TB incidence rates compared to economically advanced PLADs such as Guangdong, Zhejiang, and Fujian. The TB epidemiological characteristics (including incidence rates and disease burden) of the origin PLADs significantly influence TB occurrence among corresponding inter-provincial migrants (14). In Zhejiang, research demonstrated that TB cases among migrant populations comprised approximately one-third of all diagnosed cases during the study period (15). Effective control of inter-provincial TB patients remains essential for reducing overall disease burden. This study further revealed that most TB patients among migrant populations in Zhejiang originated from Guizhou, Anhui, and Zhejiang itself, findings that align with our research results.
Population mobility correlates strongly with economic dynamics. Specifically, lower economic development levels in outflow regions facilitate population outflow, while higher economic development levels in inflow regions encourage population inflow. The economic disparity between regions is considered as a significant factor influencing population mobility (16). Existing research indicates that eastern provinces and municipalities such as Beijing, Shanghai, Guangdong, Zhejiang, Jiangsu, and Fujian are the primary inflow centers for migrant populations, though dispersion toward central and western regions has gradually increased (16). These findings align with the TBIM mobility patterns observed in this study, wherein TBIM outflow provinces tend to be economically weaker, while inflow provinces are predominantly more developed. This suggests that TBIM mobility may also be economically driven. However, other potential factors (e.g., education access, healthcare quality, outbreaks or control of other infectious diseases) warrant further investigation.
Several limitations constrained this study. First, our definition of the migrant population relied solely on address codes without incorporating migration duration or additional demographic factors. Second, we did not analyze TB incidence rates specifically within the inter-provincial migrant population. Furthermore, limited research has been conducted on the disease management status and migration-related factors affecting this population.
The defining feature of TBIM is high mobility, requiring location-specific disease control strategies. Disease control and health education can be implemented through “point-to-point” initiatives in high-volume inflow/outflow provinces or cities. Particular attention should be paid to subgroups that have shown a significant growth trends, such as people ≥45 years old. Research indicates that interventions, such as providing transportation and nutritional support, and expanded outpatient services can improve treatment success and reduce TB incidence in migrant populations(15).
-
Ms. Minying Huang (Guangxi CDC), Ms. Xiaoyan Liang (Guangxi CDC), and Dr. Zhijun Li (U.S. CDC China Office) for their valuable contributions to this investigation.
| Citation: |

|