
 Download:


-
Introduction: Chronic diseases and multimorbidity are increasingly prevalent among older adults in China, contributing substantially to hospitalization burden. However, real-world evidence on their direct medical expenditures remains limited.
Methods: This study employed a retrospective analysis by using hospital discharge data from Guangzhou during 2017–2019, and adopted generalized linear models (GLMs) to estimate hospitalization expenditures across chronic disease and multimorbidity patterns.
Results: Older patients with multimorbidity incurred nearly double the median annual hospitalization expenditures (3,708 USD vs. 1,844 USD) and 45% higher costs per additional condition compared to single diseases. Hospitalization cost varied by specific diseases and multimorbidity patterns. Schizophrenia (7,421.3 USD) has the highest annual total hospitalization expenditure (THE) among single chronic diseases while the combination of cancer + CVD + heart disease (10,698.8 USD for THE, 4,024.6 USD for out-of-pocket expenditure) ranked the top expenditures among multimorbidity patterns. Approximately 57.1% of disease combinations exhibited super-additive spending.
Conclusion: This study provides robust evidence of the substantial economic burden of chronic diseases and multimorbidity. The findings underscore the need for an integrated care model, evidence-based strategies to optimize healthcare resource allocation and health outcomes in aging populations.
-
Chronic diseases have emerged as major public health challenges in China, with their prevalence and incidence rates increasing rapidly over the past two decades. Multimorbidity, defined as the co-occurrence of two or more chronic diseases, results in poorer health-related quality of life and higher health service utilization and expenditures compared to single conditions (1-3). In China, multimorbidity prevalence exhibits a marked age gradient, ranging from 30.2% (aged 50–54 years) to 57.5% (aged 80–84 years), with corresponding mortality rates of 15.92–24.80 per 1,000 person-years among those ≥65 years (1-2). Multimorbid patients constitute 72.7% of outpatient and 77.3% of inpatient services among adults aged ≥50 years, with their annual hospitalization costs varying between physical [3,703.2 Chinese Yuan (CNY)] and physical-mental (5,969.5 CNY) multimorbidity patterns, underscoring their substantial healthcare burden (3). Understanding expenditures related to chronic multimorbidity among older adults is therefore crucial for informed decision-making. This study examines the impact of specific chronic diseases and multimorbidity patterns on hospitalization spending by comparing sociodemographic characteristics, annual hospitalization healthcare resource utilizations (HCRUs), and costs between older patients with single chronic conditions and those with multimorbidity using real-world hospital discharge data. Key findings reveal that schizophrenia imposes a substantial economic burden on both payers and families. Cancer, cerebrovascular disease (CVD), and heart disease — whether occurring alone or within complex multimorbidity patterns — are also associated with high annual hospitalization expenditures and significant resource utilization. This knowledge is essential for guiding resource allocation, designing cost-effective prevention and intervention strategies, and ultimately reducing socioeconomic burden while improving quality of life and enhancing population health outcomes.
Despite numerous studies exploring the association between multimorbidity and healthcare costs, a significant gap remains in understanding the economic burden of multimorbidity in China. Existing research typically focuses on a limited range of chronic conditions, employs overly simplistic definitions of multimorbidity, and frequently relies on self-reported data, resulting in biased and inconsistent estimates. This study adopts a comprehensive approach to accurately assess this burden, providing robust evidence for public policy and practice. It employed a retrospective cohort design using a de-identified hospital discharge database from 273 public hospitals and medical institutions in Guangzhou (2017–2019). Patients aged 50 years or older with 1 or more of 40 predefined chronic conditions (
Supplementary Table S1 ) were categorized into single disease or multimorbidity cohorts based on the number of unique chronic conditions for which they were hospitalized as the primary diagnosis. This study then excluded hospitalization records for non-targeted conditions to maintain data accuracy and relevance. Descriptive analyses were conducted to characterize patient demographics, HCRUs, and expenditures across cohorts and by specific chronic diseases and multimorbidity patterns. This study also used generalized linear models (GLMs) with gamma distribution and log-link function to examine the correlation between multimorbidity and annual hospitalization spending, as well as to estimate the impact on annual total hospitalization expenditures (THE) and annual hospitalization out-of-pocket expenditures (OOPE) associated with specific chronic diseases and multimorbidity patterns. GLM accounts for the skewed distribution of cost data. All analyses were conducted in SAS (version 9.4, SAS Institute Inc., Cary, NC, USA).After applying sample inclusion and exclusion criteria (
Supplementary Figure S1 ), the overall cohort comprised 273,452 patients, with 159,847 (58.5%) having a single chronic condition and 113,605 (41.5%) experiencing multimorbidity. The mean age was 68.9 years, with multimorbidity patients being older (mean age 70.1 years) compared to those with a single chronic condition (mean age 68.1 years). Patients aged 65 or above and women demonstrated significantly higher rates of multimorbidity than their younger and male counterparts, respectively (P<0.0001). Multimorbidity patients averaged 2.03 (±1.83) inpatient visits and experienced longer hospital stays (mean 20.2±31.2 days) compared to those with a single chronic condition. The crude median annual THE and OOPE in the multimorbidity cohort were [3,708.1 United States Dollars (USD)] and 1,844.6 USD, respectively — nearly double those observed in patients with a single chronic condition. Overall, traditional Chinese medicine (TCM) expenditures accounted for approximately 15.8% of total medication expenses (Table 1).Variables Overall (N=273,452) Single condition (N=159,847) Multimorbidity (N=113,605) P Age (at initial inpatient admission) [mean (SD)] 68.97 (11.34) 68.14 (11.70) 70.13 (10.71) <0.0001 Age category (n, %) 50–64 106,765 (39.04) 67,985 (42.53) 38,780 (34.14) <0.0001 65–79 108,904 (39.83) 59,786 (37.40) 49,118 (43.24) ≥80 57,783 (21.13) 32,076 (20.07) 25,707 (22.63) Gender (n, %) Male 128,536 (47.00) 77,148 (48.26) 51,388 (45.23) <0.0001 Female 144,916 (53.00) 82,699 (51.74) 62,217 (54.77) Insurance type (n, %) UEBMI 179,635 (65.69) 107,869 (67.48) 71,766 (63.17) <0.0001 URRBMI 93,817 (34.31) 51,978 (32.52) 41,839 (36.83) Follow-up period (n, %) 1 year 107,613 (39.35) 94,470 (59.10) 13,143 (11.57) <0.0001 2 years 95,803 (35.03) 48,757 (30.50) 47,046 (41.41) 3 years 70,036 (25.61) 16,620 (10.40) 53,416 (47.02) Number of chronic conditions [mean (SD)] 1.23 (1.11) 1.00 (0) 2.64 (0.96) <0.0001 Number of chronic conditions (category, n, %) 2 67,245 (59.19) 3 28,512 (25.10) ≥4 17,848 (15.71) Inpatient healthcare utilization (PPPY) Inpatient visits [mean (SD)] 1.55 (1.57) 1.21 (1.26) 2.03 (1.83) <0.0001 Days of hospitalization [mean (SD)] 16.05 (32.26) 13.10 (32.66) 20.21 (31.21) <0.0001 Number of surgeries (n, %) No surgeries 171,487 (62.71) 114,139 (71.41) 57,348 (50.48) <0.0001 1 surgery 51,360 (18.78) 21,175 (13.25) 30,185 (26.57) 2 surgeries 23,506 (8.60) 10,638 (6.66) 12,868 (11.33) ≥3 surgeries 27,099 (9.91) 13,895 (8.69) 13,204 (11.62) Inpatient cost (PPPY) Total hospitalization expenditures (median, IQR) 2,491.6 (4,323.1) 1,844.6 (3,003.4) 3,708.1 (5,324.4) <0.0001 Cost=0 (n, %) 0 (0) 0 (0) 0 (0) Total medication expenditures (median, IQR) 632.7 (1,127.5) 436.3 (840.3) 951.7 (1,369.6) <0.0001 Cost=0 (n, %) 398 (0.15) 398 (0.25) 0 (0) Total traditional Chinese medicine expenditures (median, IQR) 100.5 (250.8) 54.5 (187.7) 172.4 (297.3) <0.0001 Cost=0 (n, %) 42,470 (15.53) 38,479 (24.07) 3,991 (3.51) Total hospitalization out-of-pocket expenditures
(median, IQR)675.1 (1,124.3) 529.1 (831.2) 947.8 (1,395.5) <0.0001 Cost=0 (n, %) 39 (0.01) 37 (0.02) 2 (0) Total cost covered by basic medical insurance
(median, IQR)1,554.7 (2,702.5) 1,151.0 (1,946.2) 2,266.9 (3,386.4) <0.0001 Cost=0 (n, %) 193 (0.07) 193 (0.12) 0 (0) Note: Age refers to the patient’s age at their first inpatient visit during 2017–2019; Follow-up years are defined as the number of unique calendar years in which patients received at least one hospitalization for any reason in a given year; PPPY: Per person per year is calculated by dividing each patient's total inpatient health utilizations/costs from 2017 to 2019 by their follow-up years, then averaging these totals by the number of patients; All costs were adjusted for inflation to the year 2019 CNY using the national CPI and converted to 2019 USD at an exchange rate of 1 CNY=0.1449 USD. "Cost=0" in this table indicates the No. of patients with zero expenditures.
Abbreviation: SD=standard deviation; IQR=interquartile range; PPPY=per patient per year; CNY=Chinese yuan; USD=United States dollar; CPI=Consumer price index; UEBMI=Urban employee basic medical insurance; URRBMI=Urban resident basic medical insurance.Table 1. Patient demographics, crude annual healthcare resource utilization, and costs of elderly hospitalized patients.
The most prevalent chronic diseases among hospitalized patients were heart disease (9.7%), CVD (9.5%), and cancer (6.8%). Annual hospitalization duration varied substantially across conditions, ranging from 2.1 (±1.7) days for senile cataracts to 19.4 (±40.9) days for CVD. The most common multimorbidity patterns included CVD + heart disease (1.9%), hypertension + heart disease (1.3%), and hypertension + CVD (1.3%), with cancer-based multimorbidity combinations resulting in the longest hospital stays and highest associated costs (Figure 1).
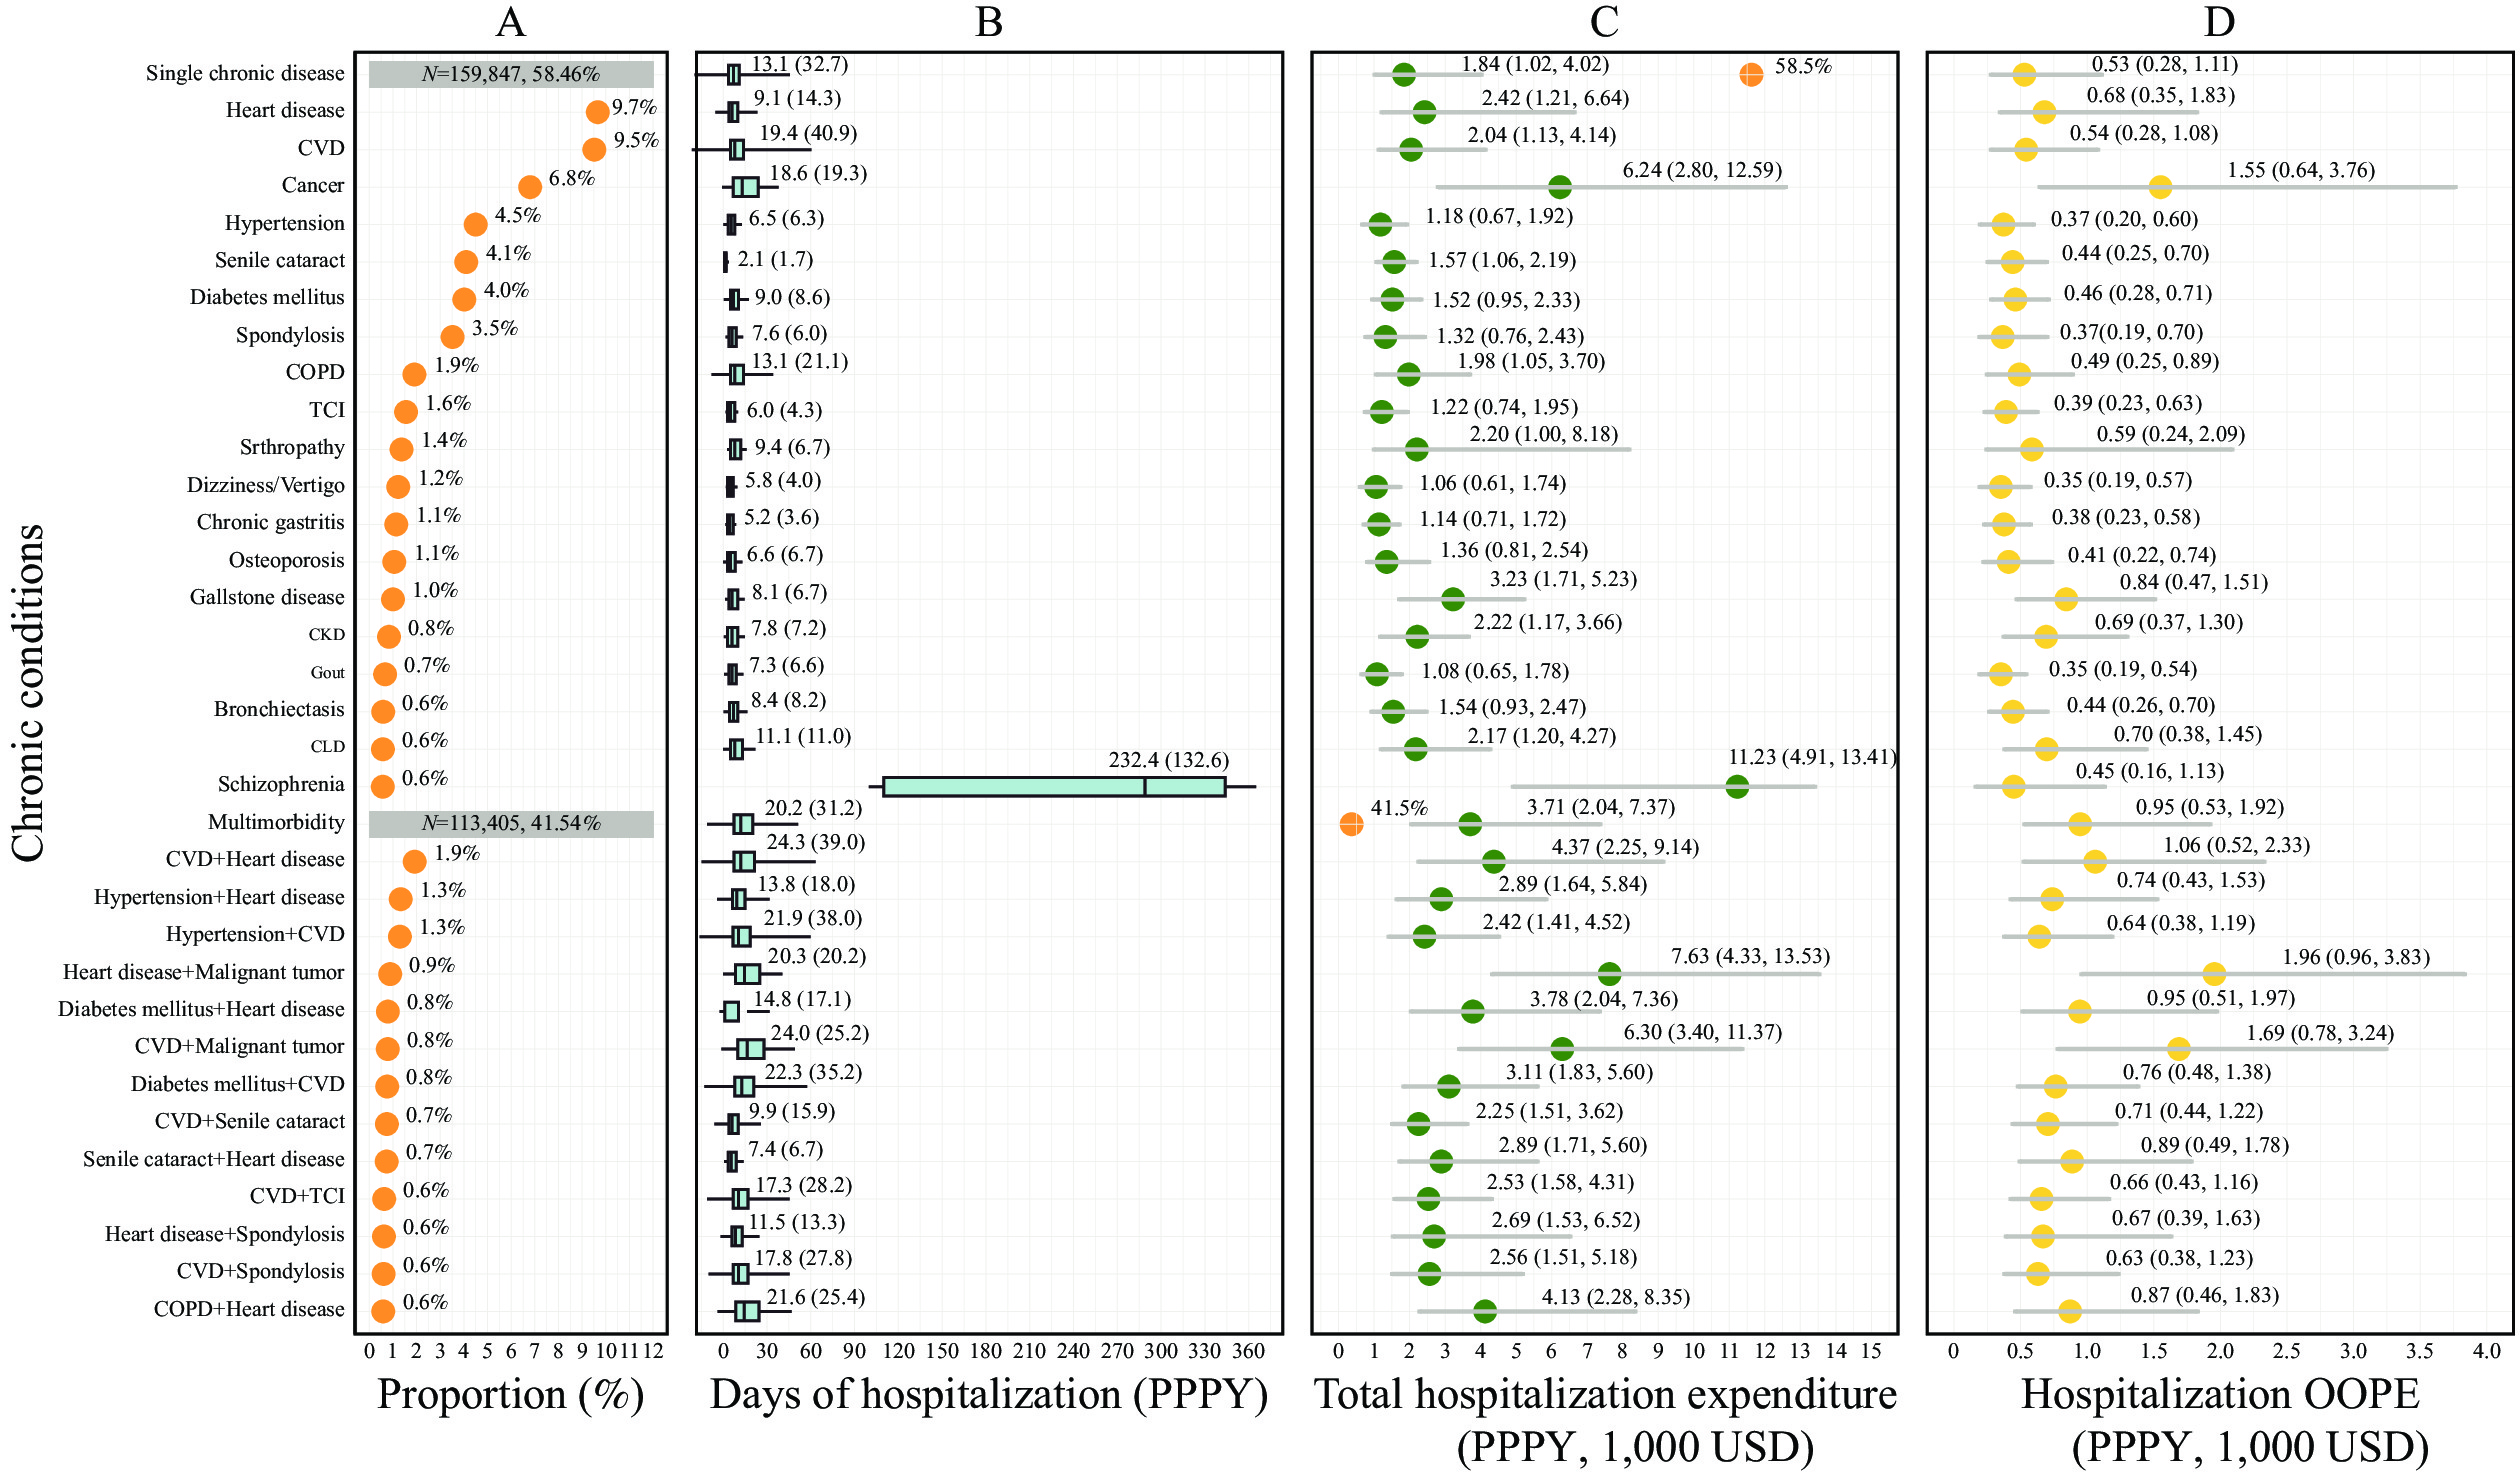 Figure 1.
Descriptive statistics (PPPY) by specific diseases and multimorbidity patterns (ordered by proportion of hospitalized patient). (A) Proportion of patients hospitalized due to diseases; (B) Annual days of hospitalization; (C) Annua Total hospitalization expenditure (Crude); (D) Annual hospitalization Out-of-Pocket expenditure (Crude).
Note: Only chronic diseases and multimorbidity patterns with a patient proportion hospitalized during 2017–2019 greater than 500 per 100,000 are presented. Mean (SD) is shown for annual days of hospitalization; median (Q1, Q3) is shown for annual total hospitalization expenditure and annual hospitalization OOPE.
Abbreviation: PPPY=per patient per year; OOPE=out-of-pocket expenditure; SD=standard deviation; CVD=cerebrovascular disease; COPD=chronic obstructive pulmonary disease; TCI=transient cerebral ischemia; USD=United States dollar.
GLM analyses revealed that each additional chronic condition increased annual THE and OOPE by approximately 20%. Patients with two conditions experienced a 29% increase in THE and 28% increase in OOPE; those with three conditions showed a 54% increase in THE and 52% increase in OOPE; patients with four or more conditions demonstrated a 97% increase in THE and 87% increase in OOPE. Overall, multimorbidity was associated with 45% higher THE and 43% higher OOPE compared to single chronic conditions (Table 2).
Cohort Estimated total hospitalization costs (PPPY) Estimated annual hospitalization OOPE (PPPY) Exp. (coefficient) Stderr 95% CI lower 95% CI upper Exp. (coefficient) Stderr 95% CI lower 95% CI upper Model 1 Intercept* (USD) 2,611.3 0.0045 2,588.4 2,634.4 673.1 0.0045 667.2 679.1 No. of chronic conditions
(range from 1-11)1.22 0.0016 1.22 1.23 1.21 0.0016 1.20 1.21 Model 2 Intercept† (USD) 3,143.4 0.0039 3,119.2 3,167.8 797.7 0.0039 791.6 803.9 One condition (reference) 1.00 1.00 1.00 1.00 1.00 1.00 Multimorbidity 1.45 0.0032 1.44 1.46 1.43 0.0033 1.42 1.44 Model 3 Intercept† (USD) 3,157.8 0.0048 3,133.7 3,182.1 800.5 0.0039 794.4 806.6 One condition (reference) 1.00 1.00 1.00 1.00 1.00 1.00 Two conditions 1.29 0.0038 1.28 1.29 1.28 0.0038 1.27 1.29 Three conditions 1.54 0.0053 1.53 1.56 1.52 0.0053 1.51 1.54 Four or more conditions 1.97 0.0066 1.95 2.00 1.87 0.0065 1.84 1.89 Abbreviation: PPPY=per patient per year; OOPE=out-of-pocket expenditure; No.=number; UEBMI=urban employee basic medical insurance; CI=confidence interval.
* Age=50, sex=female, insurance type=UEBMI.
† Age=50, sex=female, insurance type=UEBMI, with single chronic condition.Table 2. The association of multimorbidity and hospitalization expenditures among older adults.
Among single chronic diseases, schizophrenia demonstrated the highest estimated annual THE at 7,421.3 USD per patient per year (PPPY), followed by cancer at 5,751.6 USD, spleen disease at 4,405.8 USD, and arthropathy at 4,216.2 USD. For multimorbidity patterns, the combination of CVD + heart disease + cancer resulted in the most substantial costs, with an estimated annual THE of 10,698.8 USD and OOPE of 4,024.6 USD per patient. Other high-cost multimorbidity patterns included cancer-based dyads combined with arthropathy, chronic liver disease, anemia, heart disease, chronic obstructive pulmonary disease (COPD), and spondylosis, which generated annual THE ranging from 5,000 USD to 7,000 USD PPPY (
Supplementary Figure S2 ).The analysis revealed significant cost variations across different chronic diseases and multimorbidity patterns. Approximately 57.1% of disease combinations exhibited super-additive spending effects (where combined costs exceeded the sum of individual disease costs), 10% demonstrated additive spending patterns (where combined costs approximated the sum of individual diseases), and 32.9% showed sub-additive spending effects (where combined costs fell below the sum of individual diseases). Notably, the three largest super-additive effects in annual THE occurred in combinations of CVD + dementia (+1,496.6 USD), CVD + heart disease + cancer (+1,013.2 USD), and heart disease + diabetes mellitus (+980.3 USD). Conversely, cancer + heart disease (–2,394.2 USD), cancer + arthropathy (–2,323.3 USD), and cancer + CVD (–1,435.4 USD) demonstrated the most pronounced sub-additive effects on expenditures (
Supplementary Figure S2 ). -
This study provides a comprehensive analysis of hospitalization expenditures associated with chronic diseases and multimorbidity patterns among older adults in Guangzhou City, Guangdong Province, China. Its findings align with previous research demonstrating that elderly patients and women are more likely to develop multimorbidity. A US epidemiologic review showed that 67% of Medicare beneficiaries had multimorbidity, with higher prevalence in older age groups and among women. This pattern reflects the “male-female health-survival paradox,” where women experience higher rates of chronic diseases but tend to live longer, while men are more prone to severe conditions such as cancer and ischemic heart disease (4). This study confirms the increased healthcare resource utilization and costs associated with multimorbidity, consistent with existing literature (3). Schizophrenia costs 7,421.3 USD PPPY in our study, similar to Zhong et al.’s estimate of 8,061 USD for long-action injectable and 6,822 USD for orally treated schizophrenia patients (5). While Chen et al. observed a 3.4-fold cost increase for multimorbid patients in Beijing, higher than our study’s estimates (6). Zhao et al. reported lower annual per-capita inpatient costs attributable to heart disease, chronic lung disease, and stroke or cardiovascular disease (7). These discrepancies likely reflect methodological variations in population sampling, diseases, and cost definitions.
This study observes significant heterogeneity in hospitalization costs across different multimorbidity patterns, primarily driven by variations in physiological functions and corresponding treatment approaches. Our findings demonstrate that organ-related multimorbidity, particularly involving cancer, CVD, and heart disease, incurs substantially higher hospitalization expenditures compared to sensory-related conditions. These complex diseases require intensive, specialized medical resources and prolonged inpatient care, making them less amenable to outpatient or community-based management. In contrast, foundational chronic conditions like hypertension and diabetes show relatively lower hospitalization costs, reflecting the successful implementation of past health policies and resource investments in chronic disease management. However, our analyses reveal potentially inefficient healthcare utilization patterns, with many chronic disease patients receiving primarily medication and nursing care during hospitalization, suggesting opportunities for more cost-effective outpatient management for multimorbidity.
An interesting finding is the super-additive effect observed in certain multimorbidity patterns, where combined costs exceed the sum of individual diseases. This phenomenon results from disease complexity (e.g., physiological differences in mental−physical multimorbidity treatment cumulatively drive higher healthcare costs), polypharmacy-related risks (e.g., adverse drug events and inappropriate prescriptions), and overlapping healthcare utilization (e.g., redundant diagnostics). Multimorbidity further amplifies costs through bidirectional pathways, such as inflammation escalation, impaired self-management and frailty-associated care demands, which compound these challenges (8). Conversely, most triad multimorbidity patterns exhibited a sub-additive effect, suggesting that combined spending is less than the sum of individual conditions. This may result from synergistic or detrimental effects in care-seeking behaviors, where the presence of multiple conditions influences how patients seek and receive care. These insights underscore the need for tailored interventions to effectively manage specific multimorbidity patterns, ensuring efficient and effective use of healthcare resources.
The findings highlight several key implications for clinical practice and policy development. First, optimizing comprehensive medical care models through multidisciplinary teams (including geriatricians, nurses, and rehabilitation specialists) could enhance clinical outcomes while shortening hospitalization stays (9). Second, implementing transitional care programs, such as pre-discharge planning and community health service integration, could minimize unplanned readmissions. Third, exploring alternative therapeutic approaches, such as traditional Chinese medicine, might offer cost-effective disease management options. From a policy perspective, current reimbursement systems inadequately address cost variations across multimorbidity patterns, potentially burdening vulnerable populations (10). Strategic reforms should focus on 1) shifting from disease-centered to patient-centered care models to reduce duplicate procedures and polypharmacy; 2) optimizing diagnosis-intervention packetage reimbursement payment systems and commercial insurance programs by incorporating more complex risk-adjusted multimorbidity patterns instead of simple Charlson Comorbidity Index; 3) public health priorities should balance high-prevalence and high-cost patterns, as the former dominate aggregate expenditures despite lower hospitalization costs; 4) improving primary care quality and accessibility for rural and low-income populations as prevention management. More evidence needs to be explored for multimorbidity management in China’s aging population.
This study has several limitations that warrant acknowledgment. The analysis focused exclusively on primary diagnosis codes, excluded patients without chronic conditions, and utilized data from a single metropolitan area, which may limit the generalizability of findings to other populations and healthcare systems. Despite these constraints, the comprehensive nature of this study’s dataset — encompassing real-world data from 273 public hospitals and medical institutions, analyzing 40 distinct chronic conditions, and providing detailed examination of both individual diseases and multimorbidity patterns — offers robust and reliable estimates for hospitalization expenditures among older adults.
In conclusion, this study quantifies the substantial direct hospitalization costs associated with chronic diseases and multimorbidity among older adults in Guangzhou City, underscoring the urgent need for targeted interventions and integrated care models. These findings provide essential evidence for policymakers and healthcare providers to develop comprehensive strategies for preventing and managing chronic diseases and multimorbidity. Such strategies should ultimately optimize resource allocation, improve patient outcomes, and reduce the overall economic burden on healthcare systems. Future research should examine diverse populations across different geographic regions and healthcare settings to enhance our understanding of the economic impact and evaluate the cost-effectiveness of various care delivery models, thereby extending the applicability of these findings to broader healthcare contexts.
-
This study utilized secondary anonymized patient data and therefore did not require informed consent. Ethical approval was obtained from the University of Nottingham Ningbo China prior to study initiation.
HTML
| Citation: |

|