
 Download:


-
Introduction: Early-life malnutrition plays a critical role in human development; however, its long-term impact on lifestyle behaviors remains poorly understood. This study investigated the association between early-life malnutrition and lifestyle behaviors among elderly hypertensive populations.
Methods: A total of 17,871 elderly hypertensive populations were surveyed from July 11 to August 31, 2023, in Jia County, Pingdingshan City, Henan Province, China. Early-life malnutrition exposure was defined based on natural disasters occurring between 1959 and 1961, with participants categorized by age at exposure as follows: infant and toddler exposed group (1956–1958), preschooler exposed group (1953–1955), school-aged exposed group (1947–1952), adolescent exposed group (1942–1946), and adult exposed group (before 1942). Outcome measures included four lifestyle behaviors: smoking, alcohol consumption, healthy body mass index (BMI), and healthy waist circumference (WC). Multivariable logistic regression models were used to evaluate associations with sex-stratified subgroups, and sensitivity analyses were performed to ensure robustness.
Results: The mean age of the participants was 73.4 years, and 57.9% were women. Compared to the adult exposed group, individuals exposed to malnutrition during infancy, preschool, school-aged, and adolescence had significantly higher risks of smoking and alcohol consumption. Additionally, those with early-life malnutrition exposure showed a lower likelihood of maintaining healthy BMI and WC, with odds ratios (ORs) demonstrating significant trends as age at exposure increased (Pfor trend<0.001). Subgroup analysis revealed that these associations were significant in males, whereas no statistically significant associations were observed between smoking and alcohol consumption in females. Sensitivity analyses, excluding individuals with diabetes or coronary heart disease, confirmed the robustness of the findings.
Conclusions: Early-life malnutrition, particularly during infancy, childhood, and adolescence, was significantly associated with unhealthy lifestyle behaviors, including increased smoking, alcohol consumption, and obesity among elderly individuals with hypertension. These findings provide valuable insights for countries and regions facing natural disasters. Furthermore, they can help public health professionals design targeted interventions for vulnerable populations.
-
The developmental origins of health and disease hypothesis posits that early life experiences play a pivotal role in individual development, influencing later health status and predisposing individuals to disease (1). Between 1959 and 1961, China experienced severe natural disasters that significantly affected its population and economy (2). Although previous studies have established links between early malnutrition and increased risks of hypertension, diabetes, and cardiovascular disease (3), little is known about the impact of malnutrition on lifestyle behaviors later in life, particularly among hypertensive populations. This study aimed to investigate whether malnutrition experienced during critical developmental stages is associated with adverse lifestyle behaviors, including smoking, alcohol consumption, body mass index (BMI), and waist circumference (WC), later in life among elderly hypertensive populations.
-
Data were collected from July 11 to August 31, 2023, in Jia County, Pingdingshan City, Henan Province. This large-scale cross-sectional survey employed a cluster sampling method, with data collected through face-to-face interviews. This study included hypertensive populations born before 1959 who resided in Jia County and were enrolled in a local basic public health service program, ensuring that the sample was representative of the hypertensive population in Jia County. The exclusion criteria included populations with mental illnesses, those who refused to participate, and those who were unable to provide informed consent. Participants diagnosed at secondary- or higher-level medical institutions completed questionnaires on demographics, disease history, and lifestyle behaviors. For participants with low literacy levels, trained staff assisted them in reading and completing the questionnaire during face-to-face interviews. After excluding 679 populations with missing or incomplete information, 17,871 hypertensive populations were included.
Early malnutrition was defined as exposure to natural disasters between 1959 and 1961 that led to widespread food scarcity and malnutrition (4). Participants born before 1942 were categorized into the adult exposed group, which served as the reference group. Others were classified based on their age during the early malnutrition period: infancy and toddler exposed group (born 1956–1958), preschooler exposed group (born 1953–1955), school-aged child exposed group (born 1947–1952), and adolescent exposed group (born 1942–1946) (5). Lifestyle outcomes included smoking status, alcohol consumption, BMI, and WC. Smoking status and alcohol consumption were assessed using structured questionnaires. The participants were asked whether they smoked (former smoker, current smoker, or never smoked) or consumed alcohol (yes or no). Former and current smokers were classified as smokers. A healthy weight was defined as a BMI between 18.5 and 24.9 kg/m2. Healthy WC was defined as less than 90 cm for men and less than 85 cm for women. The covariates included age, sex, residence, education, marital status, diabetes, coronary heart disease, stroke, and duration of hypertension. Diabetes and coronary heart disease (CHD) were defined based on the physician’s diagnosis, as recorded in the participants’ public health records or self-reported history confirmed by medical documentation from secondary or tertiary hospitals. Analysis of variance (ANOVA), Kruskal-Wallis H test, and binary logistic regression were used to analyze the data after adjusting for covariates. The Cochran-Armitage trend test was used to explore whether there was a decreasing trend in risky behaviors with increasing age at exposure. Sensitivity analyses excluded participants with diabetes or coronary heart disease. Statistical analyses were conducted using SPSS Statistics (version 20.0; IBM Corp., Armonk, NY, USA), with significance set at P<0.05. Graphs were created using GraphPad Prism 8.0 (GraphPad Software, San Diego, CA, USA).
The characteristics of the 17,871 hypertensive populations are presented in Table 1. The majority of the participants were female (n=10,351, 57.9%), with a mean age of 73.4 years (range: 65–104 years). Among the study population, 2,740 (15.3%) were exposed to early malnutrition during infancy and toddlerhood, 3,720 (20.8%) during preschool age, 6,490 (36.3%) during school age, 3,191 (17.9%) during adolescence, and 1,730 (9.7%) during adulthood. Significant differences were observed in the distribution of educational status, marital status, smoking, alcohol consumption, diabetes, coronary heart disease, stroke, duration of hypertension, BMI, WC, sleep duration, and physical activity duration among the five exposure groups (Table 1, Pfor trend<0.05).
Variable Infant and
toddler
exposed
(n=2,740)Preschooler
exposed
(n=3,720)School-aged
exposed
(n=6,490)Adolescent
exposed
(n=3,191)Adult
exposed
(n=1,730)Overall
(n=17,871)Pfor trend Birth cohort 1956–1958 1953–1955 1947–1952 1942–1946 Before 1942 17,871 (100.0) − Number, [n (%)] 2,740 (15.3) 3,720 (20.8) 6,490 (36.3) 3,191 (17.9) 1,730 (9.7) 17,871 (100.0) − Gender (male), [n (%)] 1,114 (40.7) 1,568 (42.2) 2,773 (42.7) 1,379 (43.2) 686 (39.7) 7,520 (42.1) 0.721 Educational status (illiterate), [n (%)] 1,020 (37.2) 1,606 (43.2) 3,183 (49.0) 1,363 (42.7) 1,003 (58.0) 8,175 (45.7) <0.001 Marriage (married), [n (%)] 2,278 (83.1) 2,957 (79.5) 4,845 (74.7) 1,943 (60.9) 732 (42.3) 12,755 (71.4) <0.001 Current smoker (yes), [n (%)] 714 (26.1) 971 (26.1) 1,638 (25.2) 775 (24.3) 288 (16.6) 4,386 (24.5) <0.001 Current drinker (yes), [n (%)] 387 (14.1) 444 (11.9) 695 (10.7) 322 (10.1) 116 (6.7) 1,964 (11.0) <0.001 Diabetes (yes), [n (%)] 768 (28.0) 946 (25.4) 1,578 (24.3) 663 (20.8) 287 (16.6) 4,242 (23.7) <0.001 Coronary heart disease (yes), [n (%)] 346 (12.6) 500 (13.4) 1,006 (15.5) 511 (16.0) 278 (16.1) 2,641 (14.8) <0.001 Duration of hypertension
(15 years or above), [n (%)]572 (21.1) 791 (21.5) 1,454 (22.8) 758 (24.2) 426 (25.4) 4,001 (22.4) <0.001 BMI (kg/m2) 25.47±4.09 25.18±3.73 25.01±3.99 24.29±3.77 23.40±4.38 24.83±3.99 <0.001 WC (cm) 89.42±0.89 89.01±10.82 88.73±12.41 87.96±15.40 85.57±14.89 88.45±12.78 <0.001 Note: “−” means no data.
Abbreviation: BMI=body mass index; WC=waist circumference.Table 1. Demographic characteristics and early malnutrition exposure of hypertensive participants in the study conducted in Jia County, Pingdingshan City, Henan Province, China, 2023.
-
The prevalence of lifestyle behaviors varied significantly across the early malnutrition exposure groups (Figure 1). Compared to the adult exposed group, the risk of smoking was significantly higher in the infant and toddler [odds ratio (OR)=2.17, 95% confidence interval (CI): 1.79, 2.64], preschooler (OR=2.03, 95% CI: 1.69, 2.44), school-aged (OR=1.89, 95% CI: 1.59, 2.24), and adolescent (OR=1.68, 95% CI: 1.40, 2.02) exposed groups. Similarly, alcohol consumption risk was elevated in the infant and toddler (OR=2.06, 95% CI: 1.62, 2.62), preschooler (OR=1.65, 95% CI: 1.31, 2.08), school-aged (OR=1.56, 95% CI: 1.25, 1.94), and adolescent (OR=1.40, 95% CI: 1.11, 1.78) exposed groups compared to the adult exposed group (all P<0.05). Furthermore, the odds of maintaining a healthy weight were significantly lower in the infant and toddler (OR=0.52, 95% CI: 0.46, 0.59), preschooler (OR=0.55, 95% CI: 0.49, 0.62), school-aged (OR=0.59, 95% CI: 0.53, 0.66), and adolescent (OR=0.76, 95% CI: 0.67, 0.86) exposed groups compared to the adult exposed group, with similar patterns observed for healthy WC. All OR values showed a significant decreasing trend with increasing age at exposure (Pfor trend <0.001) (Table 2).
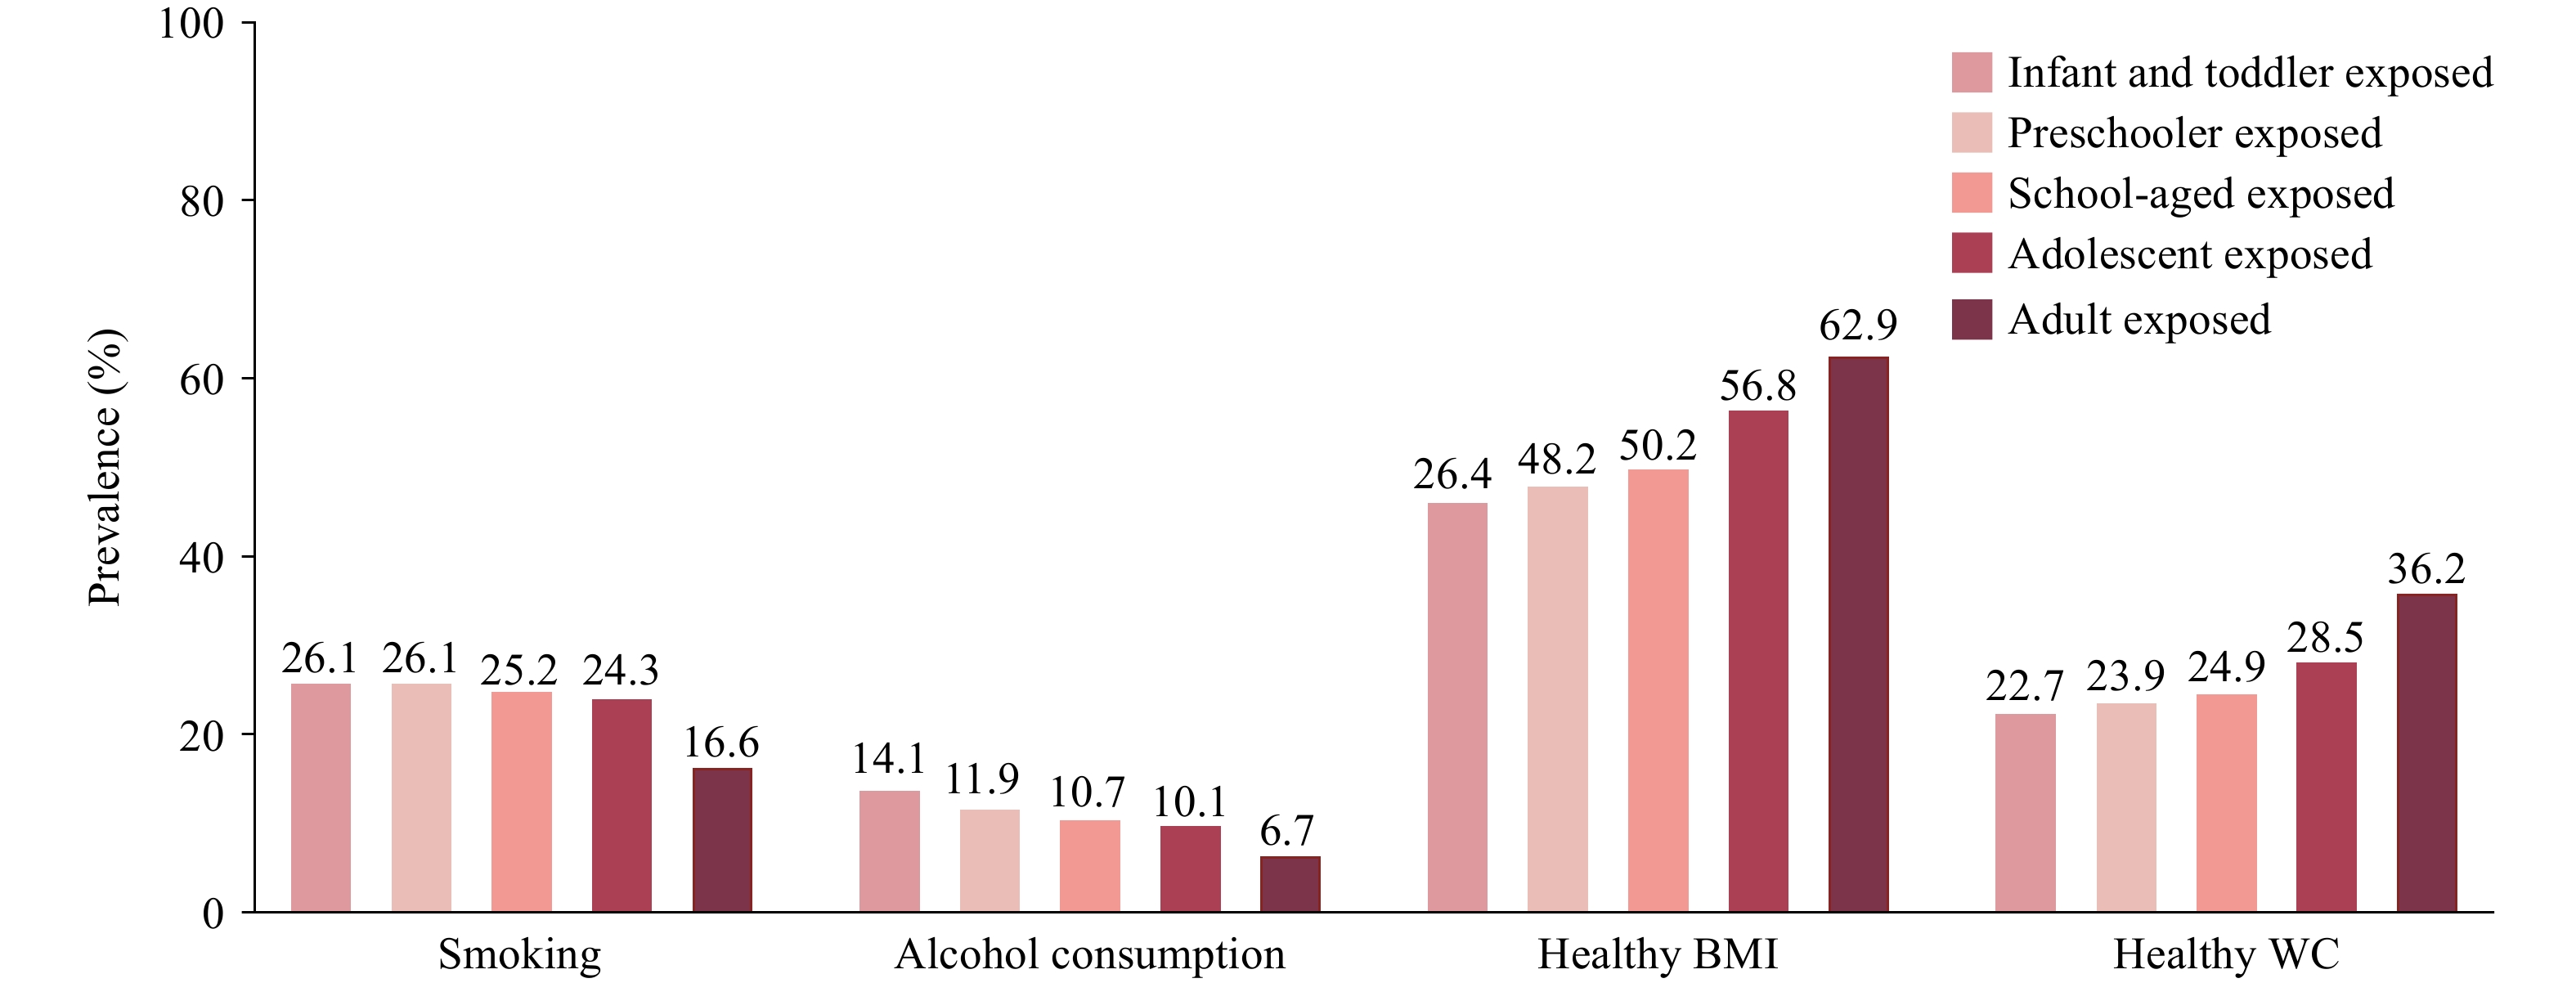 Figure 1.
Prevalence of healthy lifestyle behaviors among hypertensive populations with different early malnutrition exposures in Jia County, Pingdingshan City, Henan Province, China, 2023 (n=17,871).
Abbreviation: BMI=body mass index; WC=waist circumference.Variable Adult exposed Infant and toddler exposed Preschooler exposed School-aged exposed Adolescent exposed Pfor trend Adjusted OR (95% CI) P Adjusted OR (95% CI) P Adjusted OR (95% CI) P Adjusted OR (95% CI) P Smoking 1.00 2.17 (1.79, 2.64) <0.001 2.03 (1.69, 2.44) <0.001 1.89 (1.59, 2.24) <0.001 1.68 (1.40, 2.02) <0.001 <0.001 Alcohol consumption 1.00 2.06 (1.62, 2.62) <0.001 1.65 (1.31, 2.08) <0.001 1.56 (1.25, 1.94) <0.001 1.40 (1.11, 1.78) <0.001 <0.001 Healthy BMI 1.00 0.52 (0.46, 0.59) <0.001 0.55 (0.49, 0.62) <0.001 0.59 (0.53, 0.66) <0.001 0.76 (0.67, 0.86) <0.001 <0.001 Healthy WC 1.00 0.56 (0.49, 0.65) <0.001 0.59 (0.51, 0.67) <0.001 0.61 (0.54, 0.69) <0.001 0.71 (0.62, 0.81) <0.001 <0.001 Note: Adjusted OR (95% CI): adjusted for gender, educational status, marriage, diabetes, coronary heart disease and duration of hypertension.
Abbreviation: BMI=body mass index; WC=waist circumference; OR=odds ratio; CI=confidence interval.Table 2. Association between early malnutrition exposure and healthy behaviors in hypertensive populations from Jia County, Pingdingshan City, Henan Province, China, 2023.
Subgroup analysis revealed that compared with the adult exposed group, males in the infant and toddler (OR=2.32, 95% CI: 1.90, 2.84), preschooler (OR=2.14, 95% CI: 1.77, 2.58), school-aged (OR=1.96, 95% CI: 1.65, 2.33), and adolescent (OR=1.96, 95% CI: 1.65, 2.33) exposed groups had significantly increased risks of smoking and alcohol consumption (all P<0.05). No statistically significant associations were observed between female subgroups. Among males, the probability of maintaining a healthy weight was significantly lower in the infant and toddler exposed (OR=0.73, 95% CI: 0.60, 0.89), preschooler exposed (OR=0.68, 95% CI: 0.56, 0.82), and school-aged exposed (OR=0.69, 95% CI: 0.57, 0.82) groups (all P<0.05). Similarly, the probability of maintaining a healthy WC was significantly lower in the infant and toddler (OR=0.63, 95% CI: 0.51, 0.77), preschooler (OR=0.61, 95% CI: 0.51, 0.74), school-aged (OR=0.63, 95% CI: 0.53, 0.74), and adolescent (OR=0.71, 95% CI: 0.59, 0.86) exposed groups (all P<0.05). In females, the probability of maintaining a healthy weight was similarly lower in the infant and toddler (OR=0.40, 95% CI: 0.34, 0.48), preschooler (OR=0.47, 95% CI: 0.40, 0.55), school-aged (OR=0.53, 95% CI: 0.46, 0.61), and adolescent (OR=0.71, 95% CI: 0.61, 0.84) exposed groups (all P<0.05). The probability of maintaining a healthy WC was also significantly lower in the infant and toddler (OR=0.49, 95% CI: 0.40, 0.60), preschooler (OR=0.55, 95% CI: 0.46, 0.66), school-aged (OR=0.58, 95% CI: 0.49, 0.68), and adolescent (OR=0.70, 95% CI: 0.59, 0.84) exposed groups (all P<0.05), as shown in Figure 2.
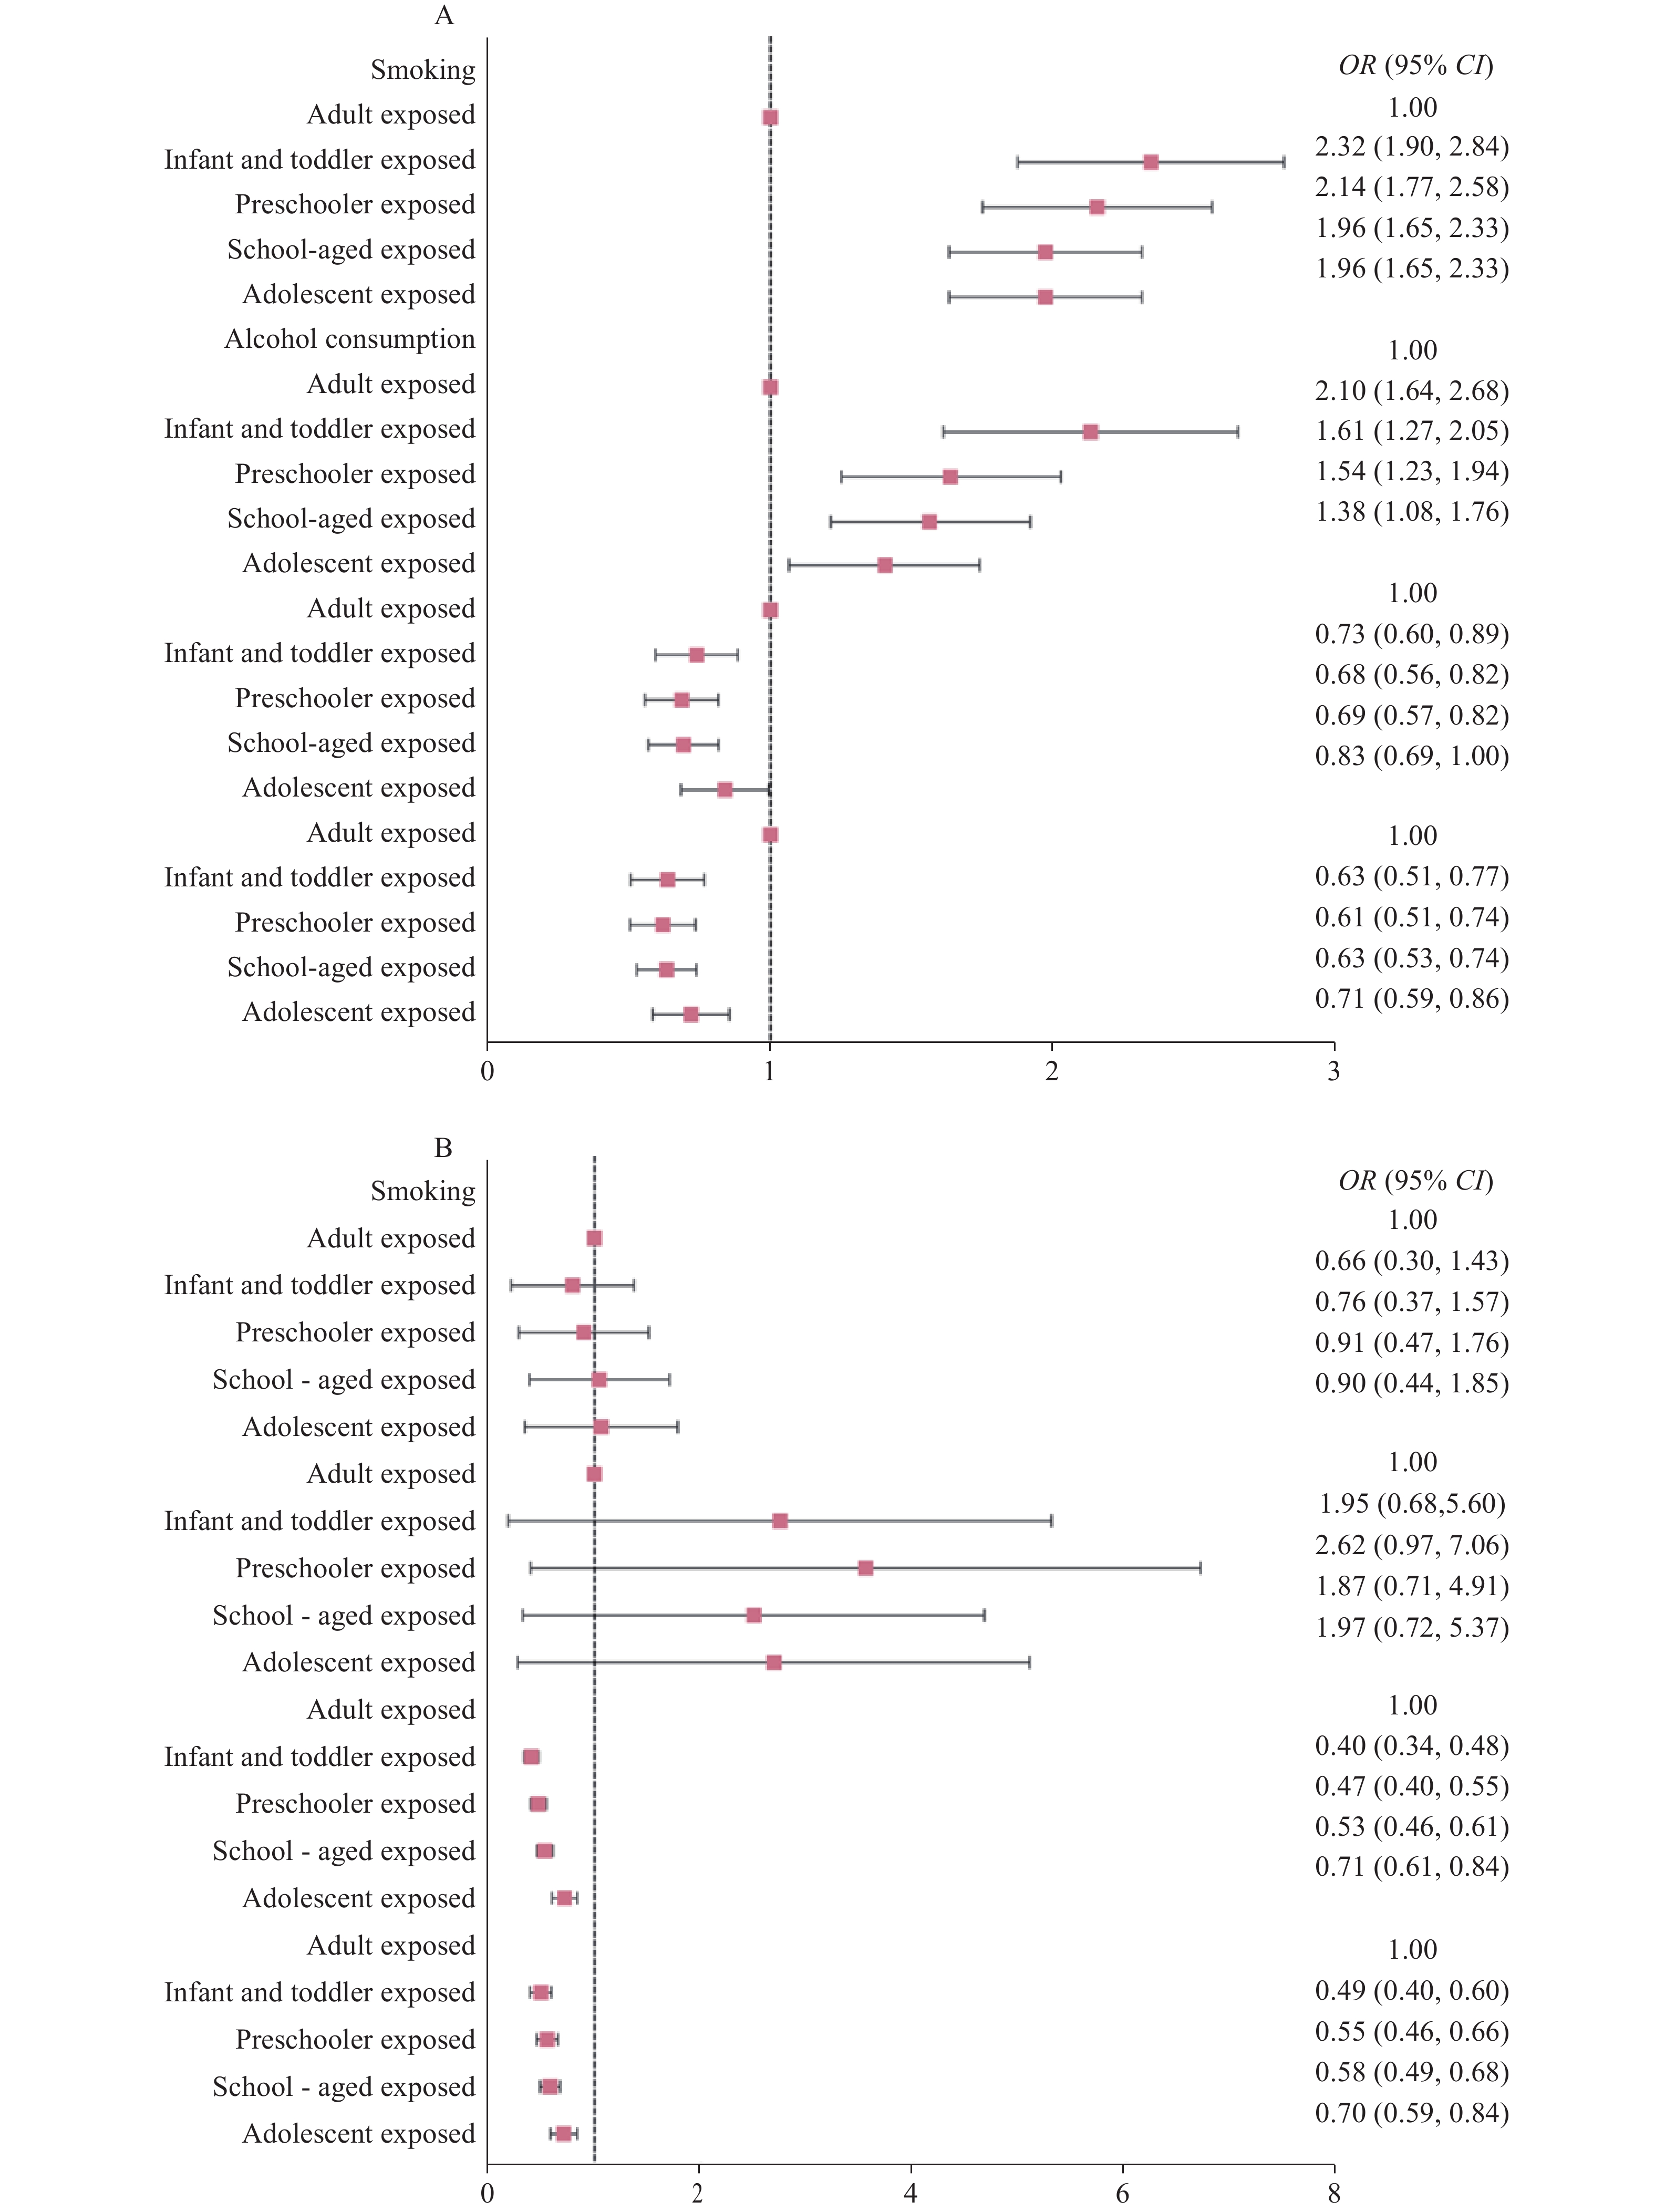 Figure 2.
Adjusted ORs and 95% CIs for healthy behaviors in hypertensive populations with different early malnutrition exposures, stratified by gender, in Jia County, Pingdingshan City, Henan Province, China, 2023. (A) Male; (B) Female.
Abbreviation: BMI=body mass index; WC=waist circumference; OR=odds ratio; CI=confidence interval.The sensitivity analysis conducted after excluding populations with diabetes and coronary heart disease yielded results consistent with those of the main analysis, as presented in Figure 3.
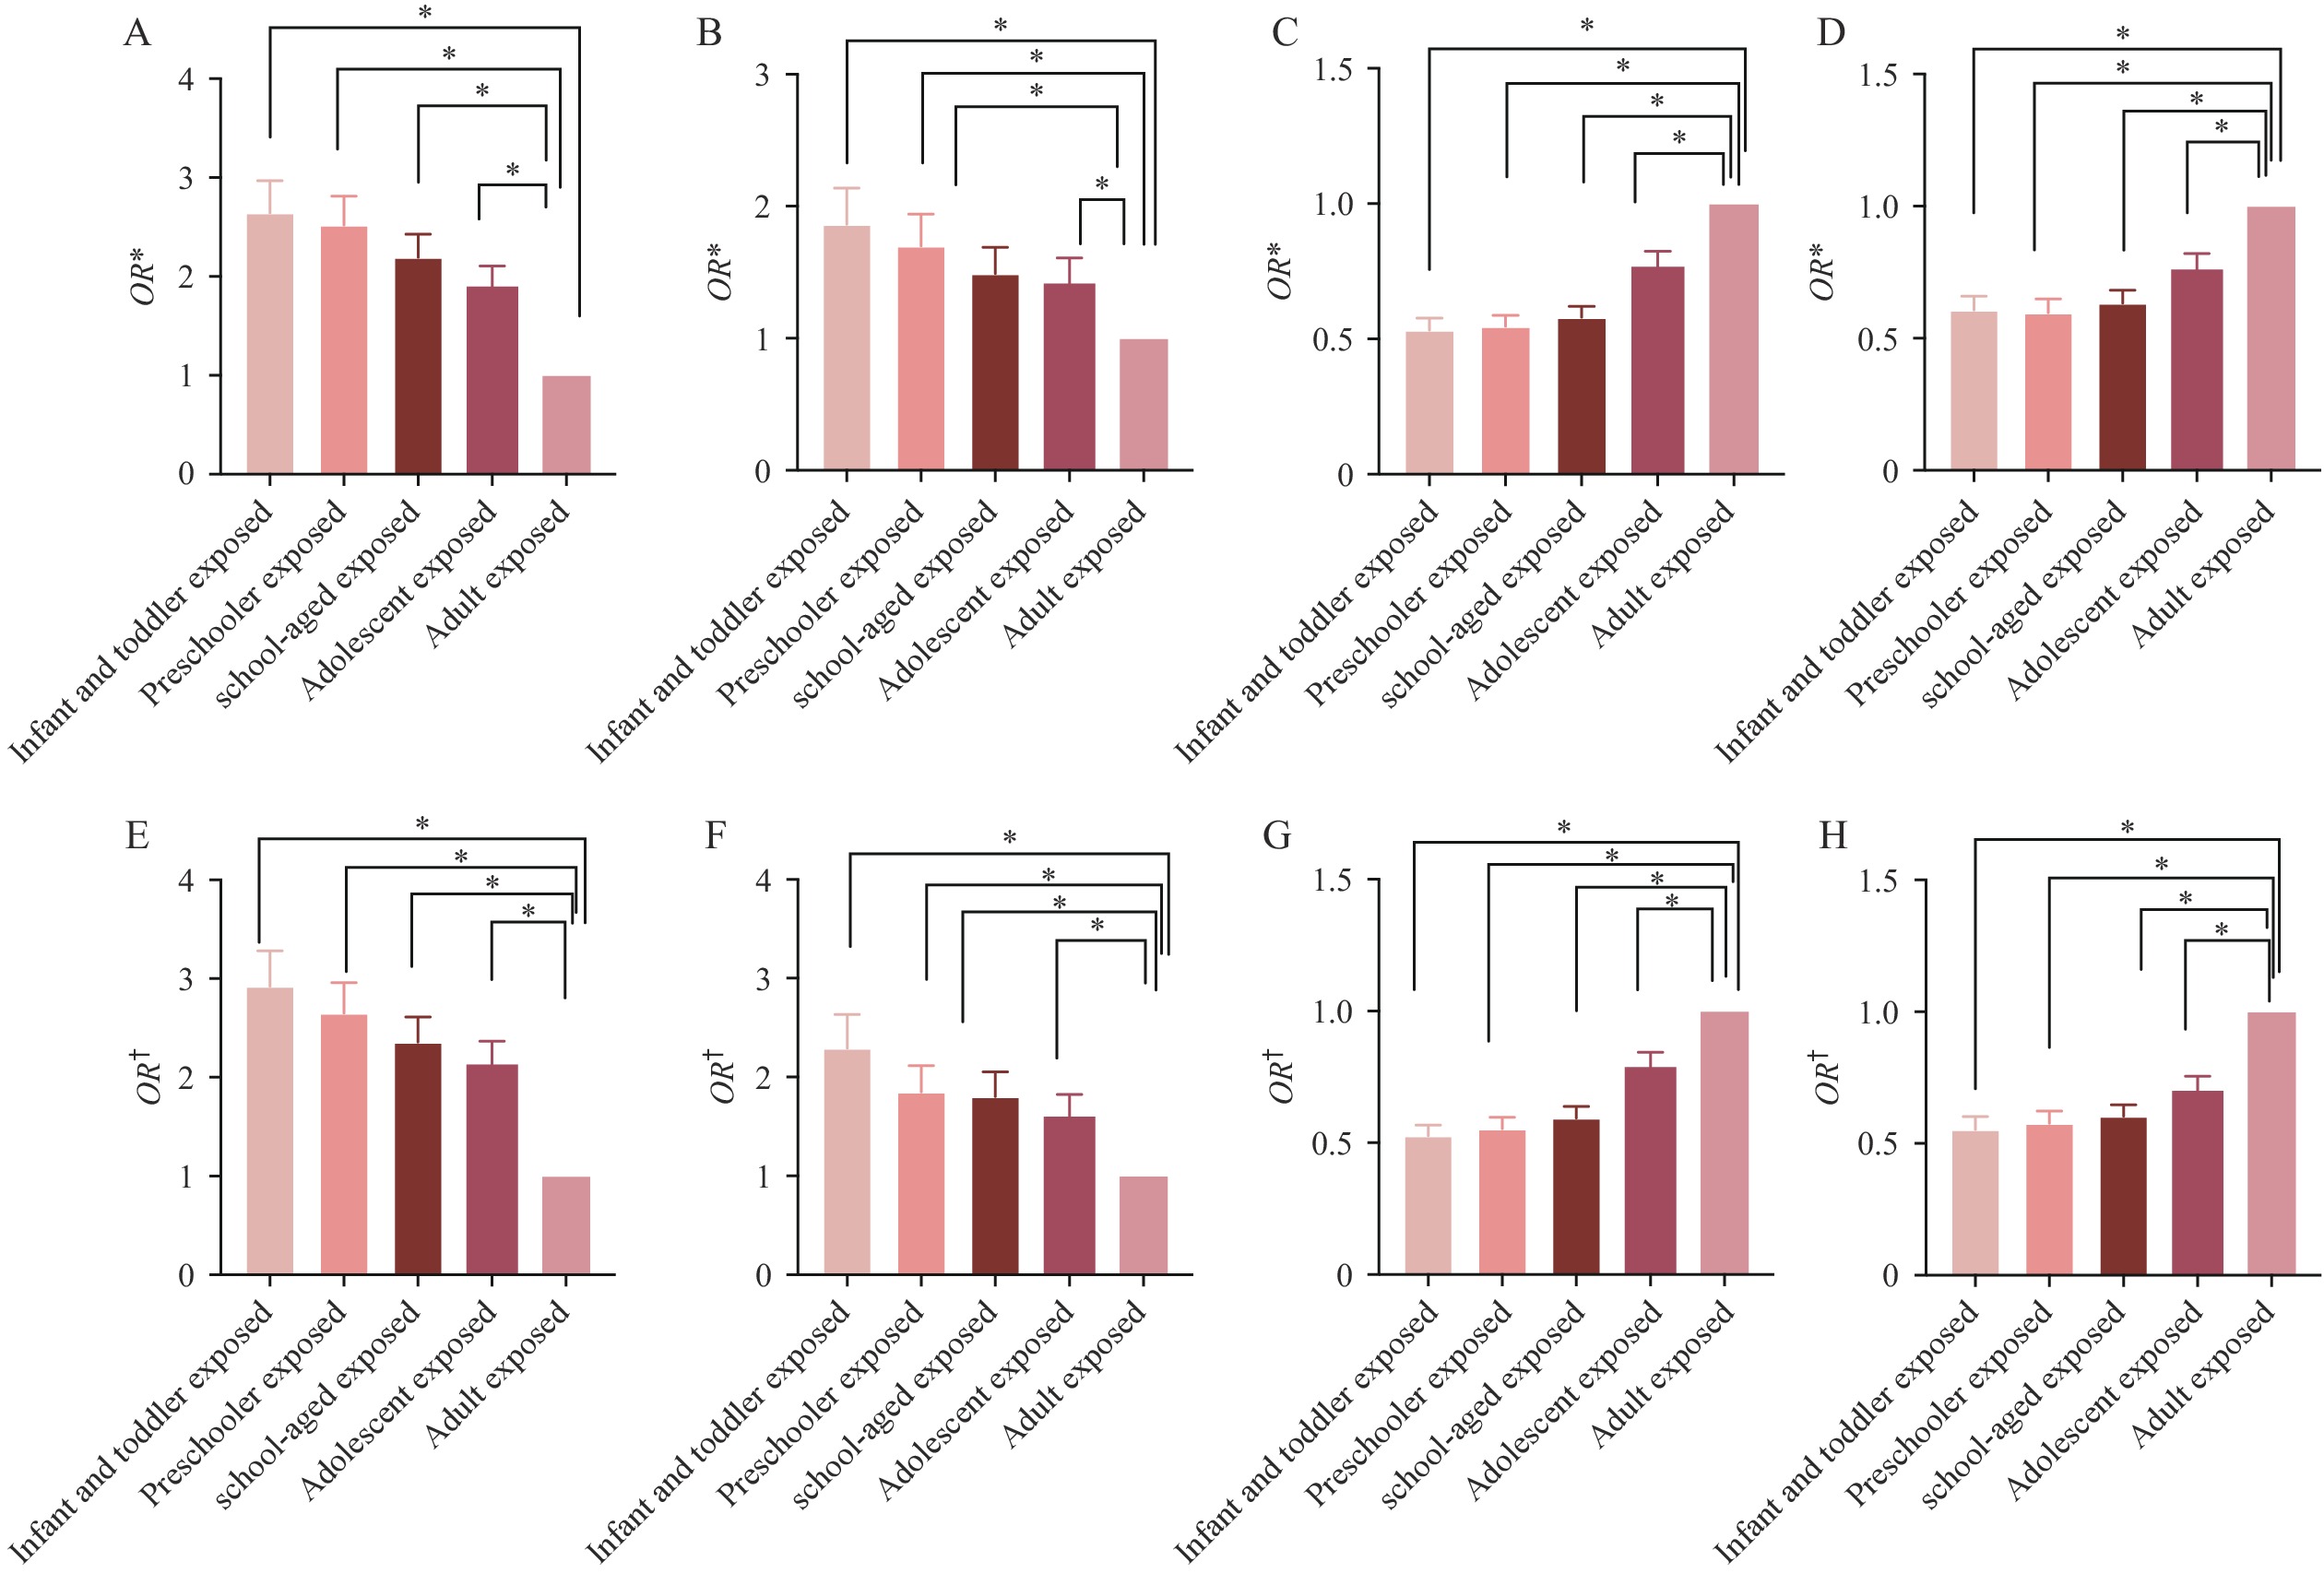 Figure 3.
Sensitivity analysis of the association between early malnutrition exposure and healthy behaviors in hypertensive populations in Jia County, Pingdingshan City, Henan Province, 2023. (A) The association between different exposure groups and the risk of smoking after excluding participants with diabetes; (B) The association between different exposure groups and the risk of alcohlol consumption after excluding participants with diabetes; (C) The association between different exposure groups and the risk of healthy BMI after excluding participants with diabetes; (D) The association between different exposure groups and the risk of healthy WC after excluding participants with diabetes; (E) The association between different exposure groups and the risk of smoking after excluding participants with coronary heart disease; (F) The association between different exposure groups and the risk of alcohlol consumption after excluding participants with coronary heart disease; (G) The association between different exposure groups and the risk of healthy BMI after excluding participants with coronary heart disease; (H) The association between different exposure groups and the risk of healthy WC after excluding participants with coronary heart disease.
Abbreviation: BMI=body mass index; WC=waist circumference; OR=odds ratio; CI=confidence interval.
* Indicates excluding participants with diabetes.
† Indicates excluding participants with coronary heart disease.
-
The findings of this study indicate that infant and toddler exposure, preschooler exposure, school-aged exposure, and adolescent exposure to malnutrition are associated with an increased risk of smoking and alcohol consumption in later life. Additionally, individuals exposed to malnutrition during infancy exhibited the highest risk behaviors compared to other age groups, with this risk demonstrating a clear decreasing trend as age at exposure increased.
The infant and toddler exposed group showed the strongest associations, supporting the concept that experiences during this critical developmental stage have profound long-term effects on individual behavior (6). One explanation for this pattern is that individuals who experienced malnutrition as infants and toddlers may develop lasting physiological stress responses, potentially serving as a trigger for smoking and alcohol consumption later in life. Research has indicated that malnutrition during fetal and early childhood development could adversely affect brain development and neural function, thereby influencing adult behavior and increasing sensitivity to addictive substances, such as nicotine and alcohol (7). This neurobiological mechanism may explain the observed results for smoking and drinking behaviors.
Our findings further indicate that individuals who experienced infant and toddler exposure, preschool exposure, school-aged exposure, and adolescent exposure to malnutrition were more prone to obesity compared to those who experienced malnutrition during adulthood. Infants and toddlers who experienced malnutrition may face the risk of overfeeding when food becomes available, thereby increasing the likelihood of obesity later in life. Exposure to malnutrition during infancy may alter neuroendocrine function, leading to excessive secretion of glucocorticoids and subsequent fat accumulation in later life (8). Furthermore, during periods of malnutrition, the body may enter a state of energy conservation to adapt to food shortages. However, once these periods end, this lowered metabolic rate may persist, increasing the likelihood of fat accumulation and contributing to obesity in later life (9).
The present study has several strengths. This comprehensive investigation involved hypertensive populations across an entire county, lending considerable rigor to the conclusions. Additionally, this study simultaneously measured and analyzed multiple healthy lifestyle factors, providing a more holistic understanding of the associations between lifestyle and health outcomes.
However, there are also several limitations. First, the respondents in this study were generally older, which might have introduced a survivor bias. To address this, we included age as a covariate in the regression analysis to minimize its impact on the study outcomes and mitigate potential differences between age groups. We also performed sensitivity analyses to confirm the robustness of our findings; the results consistently supported the study’s main conclusions. Although survivor bias remains a possibility, we implemented multiple measures to control and account for its effects, ensuring the reliability of our results. Second, lifestyle behaviors were self-reported, potentially introducing recall bias. Third, this study did not account for the potential influence of local climate, cultural dietary practices, or regional birth rates on early malnutrition. These factors may play important roles in childhood nutritional status and warrant further investigation. Future research should explore their impact to provide a more comprehensive understanding of the determinants of early malnutrition and offer deeper insights into the long-term effects of early-life malnutrition on health and behavior. This study focused on selected lifestyle behaviors, including smoking, alcohol consumption, BMI, and waist circumference. Other relevant behavioral factors, such as diet, physical activity, and sleep, were not assessed. Future research should include these variables to provide a more holistic understanding of the long-term impact of early-life malnutrition.
In conclusion, malnutrition at various developmental stages can lead to an increased risk of unhealthy lifestyle habits, including smoking, alcohol consumption, and obesity, in later years. Targeted health policies that provide nutritional support and behavioral monitoring for those exposed to early-life malnutrition may be effective in mitigating the elevated risk of smoking, drinking, and obesity in old age.
-
Approved by the Zhengzhou University Medical Ethics Committee (2023-318).
-
All participants who contributed to this study.
HTML
| Citation: |

|