
 Download:


-
Hospital-acquired infections (HAIs) pose a significant health threat to both patients and healthcare workers. The burden of HAIs is particularly high in developing countries, where they can lead to prolonged hospital stays, increased healthcare costs, and higher morbidity and mortality rates. According to the World Health Organization, hundreds of millions of patients are affected by HAIs each year globally (1). Hospital environments frequently harbor various microorganisms capable of causing human infections. Hospitalized patients are more vulnerable to bacterial infections than the general population due to compromised immunity and frequent exposure to invasive procedures (2). Pathogens can be transmitted through invasive medical procedures, direct contact between patients and healthcare providers, shared medical equipment, and contaminated surfaces within the hospital environment. Human hands or gloves can become contaminated by touching these surfaces, leading to transmission and cross-infections. High-touch surfaces, such as doorknobs, bed rails, and medical equipment, serve as particularly significant reservoirs for bacterial transmission (3).
Effective disinfection is a crucial measure for controlling HAIs. Implementing a proper disinfection schedule for hospital surfaces is essential. Although direct evidence linking surface disinfection to hospital infection control is limited, research increasingly indicates that environmental disinfection can reduce surface contamination and pathogen transmission (4). Given that routine disinfection practices do not always eliminate pathogens from contaminated surfaces, it is crucial to assess and enhance the efficiency of disinfection methods. Thus, optimizing disinfection strategies is critical for controlling and preventing the spread of HAIs.
In this study, the primary objective was to monitor the dynamics of bacterial contamination on hospital surfaces in China from 2007 to 2022. The secondary objective was to evaluate the effectiveness of routine disinfection practices in reducing bacterial contamination for various surfaces.
-
The survey was conducted in sentinel hospitals of the Hospital Infection-Disinfection Surveillance network across 31 provincial-level administrative divisions (PLADs) in China from 2007 to 2022. Study sites encompassed various hospital departments, including clean operating rooms, delivery rooms, catheterization labs, burn inpatient wards, operating rooms, neonatal units, hematological inpatient wards, intensive care units (ICUs), rooming-in units, storage supply centers, inpatient wards, hemodialysis centers, treatment rooms, emergency and outpatient departments, infectious disease departments, examination rooms, and other departments. High-frequency contact surfaces were randomly selected for sampling, including operating tables, instrument carts, instrument tables, anesthesia machines, bedside tables, door handles, newborn warm boxes, and operation panels of diagnostic instruments. Samples were collected at least once monthly.
-
Samples were collected from each site before and after disinfection. Samples collected within 2 hours after disinfection were classified as post-disinfection samples; those collected after 2 hours were classified as pre-disinfection samples. Surface samples were obtained by wiping a cotton swab across a standard sterile plate (5 cm × 5 cm). For smaller objects such as door handles, samples were directly collected using the wipe method.
-
The cotton swab was placed in a 10 mL sterile tube containing a disinfectant factor neutralizer. A 1 mL suspension was transferred to a nutrient agar plate using the pour plate method. The culture medium consisted of 1% peptone, 0.5% NaCl, 0.5% beef extract, and 2% agar. Plates were incubated at 35–37 °C for 48 hours, after which the bacterial concentration on the environmental surface was calculated. Pathogenic bacteria were isolated and identified using methods selected according to local laboratory detection capabilities.
-
Samples were considered qualified if the total plate count of environmental surfaces in Class I and II areas was ≤5 CFU/cm², and in Class III and IV areas was ≤10 CFU/cm². The qualified rate for the total plate count and positive rate for pathogenic bacteria were summarized by frequency and percentage. Differences were considered significant at P<0.05.
-
A total of 48,367 samples were collected from 249 hospitals across 31 PLADs in China during 2007–2022. These hospitals included primary, secondary, and tertiary facilities (Table 1). The overall qualified rate for the total plate count was 85.7% (41,474/48,367). Pathogenic bacteria were detected in 577 (3.9%) of the 14,665 samples tested. Due to local laboratory limitations, pathogenic bacteria from six PLADs collected between 2007 and 2010 were not tested. The qualified rate for the total plate count varied by PLAD, ranging from 25.0% in PLAD 31 to 99.2% in PLAD 24, while the positive rate for pathogenic bacteria ranged from 0.0% in fourteen PLADs to 26.3% in PLAD 14 (Table 2). The qualified rate for the total plate count and positive rate for pathogenic bacteria are shown in Table 3.
Monitoring point Hospital classification In total Primary Secondary Tertiary 01 5 4 4 13 02 1 0 8 9 03 1 1 1 3 04 1 1 2 4 05 2 1 1 4 06 0 2 5 7 07 1 1 1 3 08 1 2 1 4 09 3 3 6 12 10 3 4 8 15 11 3 3 11 17 12 1 1 1 3 13 2 1 5 8 14 3 3 7 13 15 1 1 2 4 16 1 1 3 5 17 3 3 2 8 18 1 4 3 8 19 6 16 15 37 20 1 5 1 7 21 3 3 1 7 22 3 2 3 8 23 2 2 4 8 24 0 3 1 4 25 2 1 11 14 26 1 1 1 3 27 1 1 1 3 28 1 2 2 5 29 2 3 2 7 30 1 1 1 3 31 1 1 1 3 In total 57 77 115 249 Table 1. Location and classification of 249 hospitals.
Monitoring point Total plate count Pathogenic bacteria No. of samples Qualified samples No. of samples Positive samples No. (%) No. (%) 01 1,780 1,466 (82.4) 125 0 (0) 02 2,083 1,899 (91.2) 1,383 10 (0.7) 03 1,300 1,147 (88.2) 4 1 (25.0) 04 772 582 (75.4) − − 05 1,559 1,306 (83.8) 1,484 3 (0.2) 06 2,053 1,744 (84.9) 159 0 (0) 07 840 798 (95.0) 839 0 (0) 08 858 770 (89.7) − − 09 2,565 2,324 (90.6) 1,132 146 (12.9) 10 2,951 2,649 (89.8) 321 0 (0) 11 4,129 3,605 (87.3) 1,044 20 (1.9) 12 1,476 1,424 (96.5) 210 0 (0) 13 2,465 1,809 (73.4) 866 0 (0) 14 2,283 1,332 (58.3) 243 64 (26.3) 15 1,195 1,131 (94.6) 1,097 1 (0.1) 16 1,466 1,441 (98.3) − − 17 619 554 (89.5) 619 0 (0) 18 4,055 3,615 (89.1) 3,241 322 (9.9) 19 5,115 3,823 (74.7) 886 4 (0.5) 20 383 361 (94.3) 1 0 (0) 21 748 698 (93.3) 16 0 (0) 22 983 966 (98.3) 295 5 (1.7) 23 1,823 1,693 (92.9) 64 0 (0) 24 942 934 (99.2) 8 0 (0) 25 2,163 2,010 (92.9) 572 0 (0) 26 242 236 (97.5) − − 27 339 246 (72.6) 1 1 (100.0) 28 569 476 (83.7) 7 0 (0) 29 326 242 (74.2) − − 30 237 181 (76.4) − − 31 48 12 (25.0) 48 0 (0) In total 48,367 41,474 (85.7) 14,665 577 (3.9) Note: "−" means no related data.
Abbreviation: PLAD=provincial-level administrative division.Table 2. Bacteria contamination of surface environment in hospital from 31 PLADs of China.
Year Total plate count Pathogenic bacteria No. of samples Qualified samples No. of samples Positive samples No. (%) No. (%) 2007 772 622 (80.6) − − 2008 900 787 (87.4) − − 2009 1,410 1,115 (79.1) − − 2010 1,496 1,186 (79.3) − − 2011 1,884 1,523 (80.8) 190 46 (24.2) 2012 2,027 1,577 (77.8) 1,455 201 (13.8) 2013 1,843 1,512 (82.0) 1,067 4 (0.4) 2014 1,944 1,546 (79.5) 1,179 3 (0.3) 2015 2,706 2,215 (81.9) 944 10 (1.1) 2016 3,624 3,038 (83.8) 1,196 148 (12.4) 2017 3,919 3,411 (87.0) 1,256 96 (7.6) 2018 5,066 4,510 (89.0) 1,831 21 (1.1) 2019 4,841 4,257 (87.9) 1,422 15 (1.1) 2020 4,570 4,065 (88.9) 841 4 (0.5) 2021 6,614 5,821 (88.0) 1,925 8 (0.4) 2022 4,751 4,289 (90.3) 1,359 21 (1.5) Note: "−" means no related data. Table 3. Bacteria contamination of surface environment in hospital from 2007 to 2022.
The qualified rate for the total plate count in primary, secondary, and tertiary hospitals was 85.0% (6,081/7,152), 85.1% (11,628/13,670), and 86.3% (13,765/27,545), respectively. The positive rate for pathogenic bacteria in primary, secondary, and tertiary hospitals was 4.0% (73/1,811), 1.5% (59/3,855), and 4.9% (445/8,999), respectively. Statistically significant differences were observed in both the qualified rate for the total plate count (χ2=14.627, P<0.05) and the positive rate for pathogenic bacteria (χ2=266.700, P<0.05) among primary, secondary, and tertiary hospitals. Environmental samples were collected from 17 departments, categorized into four classes according to the Hygienic Standard for Disinfection in Hospitals (GB 15982-2012). Bacterial contamination of surface environment in different departments of hospitals is shown in Table 4. Significant differences were found in the qualified rate for the total plate count among the four classes (χ2=775.700, P<0.05) and the 17 departments (χ2=1606.000, P<0.05). Significant differences were also observed in the positive rate for pathogenic bacteria among the four classes (χ2=173.900, P<0.05).
Class Department Total plate count* Pathogenic bacteria† No. of samples Qualified samples No. of samples Positive samples No. (%) No. (%) Ⅰ Clean operating room 6,675 6,383 (95.6) 1,660 44 (2.7) Ⅱ Delivery room 1,003 919 (91.6) 301 1 (0.3) Catheterization lab 53 49 (92.5) − − Burn inpatient ward 295 208 (70.5) 37 0 (0) Operating room 1,553 1,488 (95.8) 443 49 (11.1) Neonatal unit 318 271 (85.2) 98 0 (0) Hematological inpatient ward 71 64 (90.1) 10 0 (0) Intensive care unit 8,379 6,429 (76.7) 2,566 145 (5.7) In total 11,672 9,428 (80.8) 3,455 195 (5.6) Ⅲ Rooming-in unit 263 217 (82.5) 225 3 (1.3) Storage supply center 212 206 (97.2) 25 0 (0) Inpatient ward 8,217 6,696 (81.5) 2,160 89 (4.1) Hemodialysis center 5,819 5,219 (89.7) 2,253 47 (2.1) In total 14,511 12,338 (85.0) 4,663 139 (3.0) Ⅳ Treatment room 1,597 1,423 (89.1) 469 15 (3.2) Emergency and outpatient department 6,916 5,994 (86.7) 2,690 125 (4.6) Infectious disease department 2,974 2,413 (81.1) 835 55 (6.6) Examination room 1,721 1,480 (86.0) 293 1 (0.3) Others 2,301 2,015 (87.6) 600 3 (0.5) In total 15,509 13,325 (85.9) 4,887 199 (4.1) Note: "−" means no related data.
* χ2=775.700, P<0.05 (four classes) and χ2=1606.000, P<0.05 (17 departments).
† χ2=173.900, P<0.05 (four classes).Table 4. Bacteria contamination of surface environment in different department of hospitals.
The qualified rate for the total plate count after disinfection was 89.5% (22,020/24,592) compared to 81.8% (19,454/23,775) before disinfection. Similarly, the positive rate for pathogenic bacteria was lower after disinfection (3.8%, 360/9,592) than before disinfection (4.3%, 217/5,073). These differences were statistically significant for both the qualified rate for total plate count (χ2=588.900, P<0.05) and the positive rate for pathogenic bacteria (χ2=178.800, P<0.05). The qualified rates for total plate count before and after disinfection across the 31 PLADs from 2007 to 2022 are illustrated in Figure 1 and Figure 2, respectively.
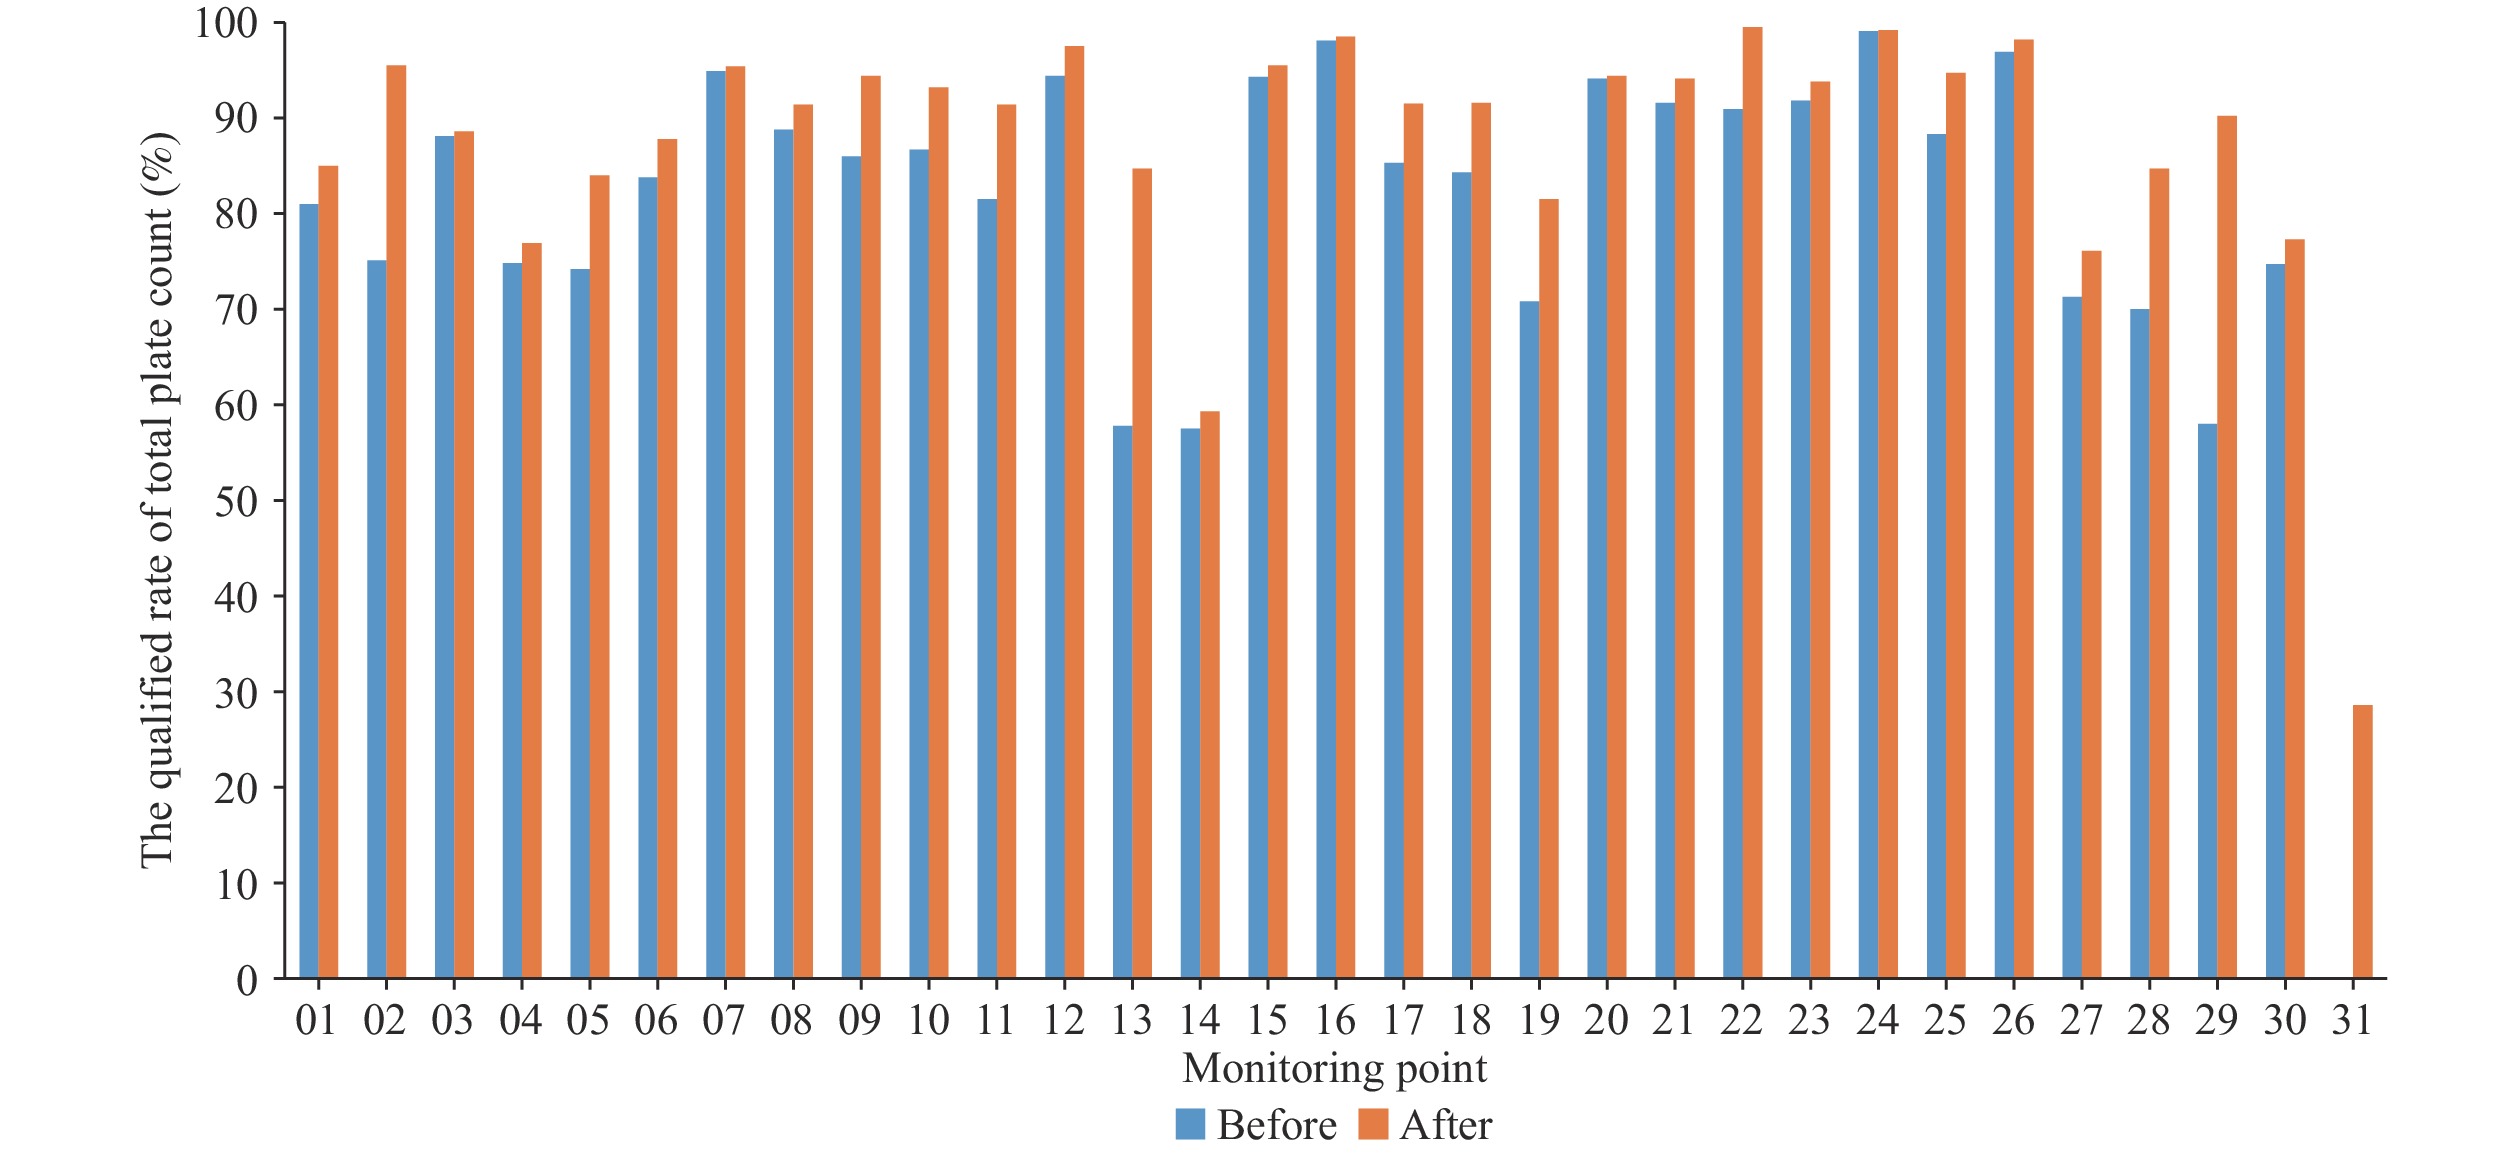 Figure 1.
The qualified rates of total plate count before and after disinfection in 31 PLADs of China.
Abbreviation: PLAD=provincial-level administrative division.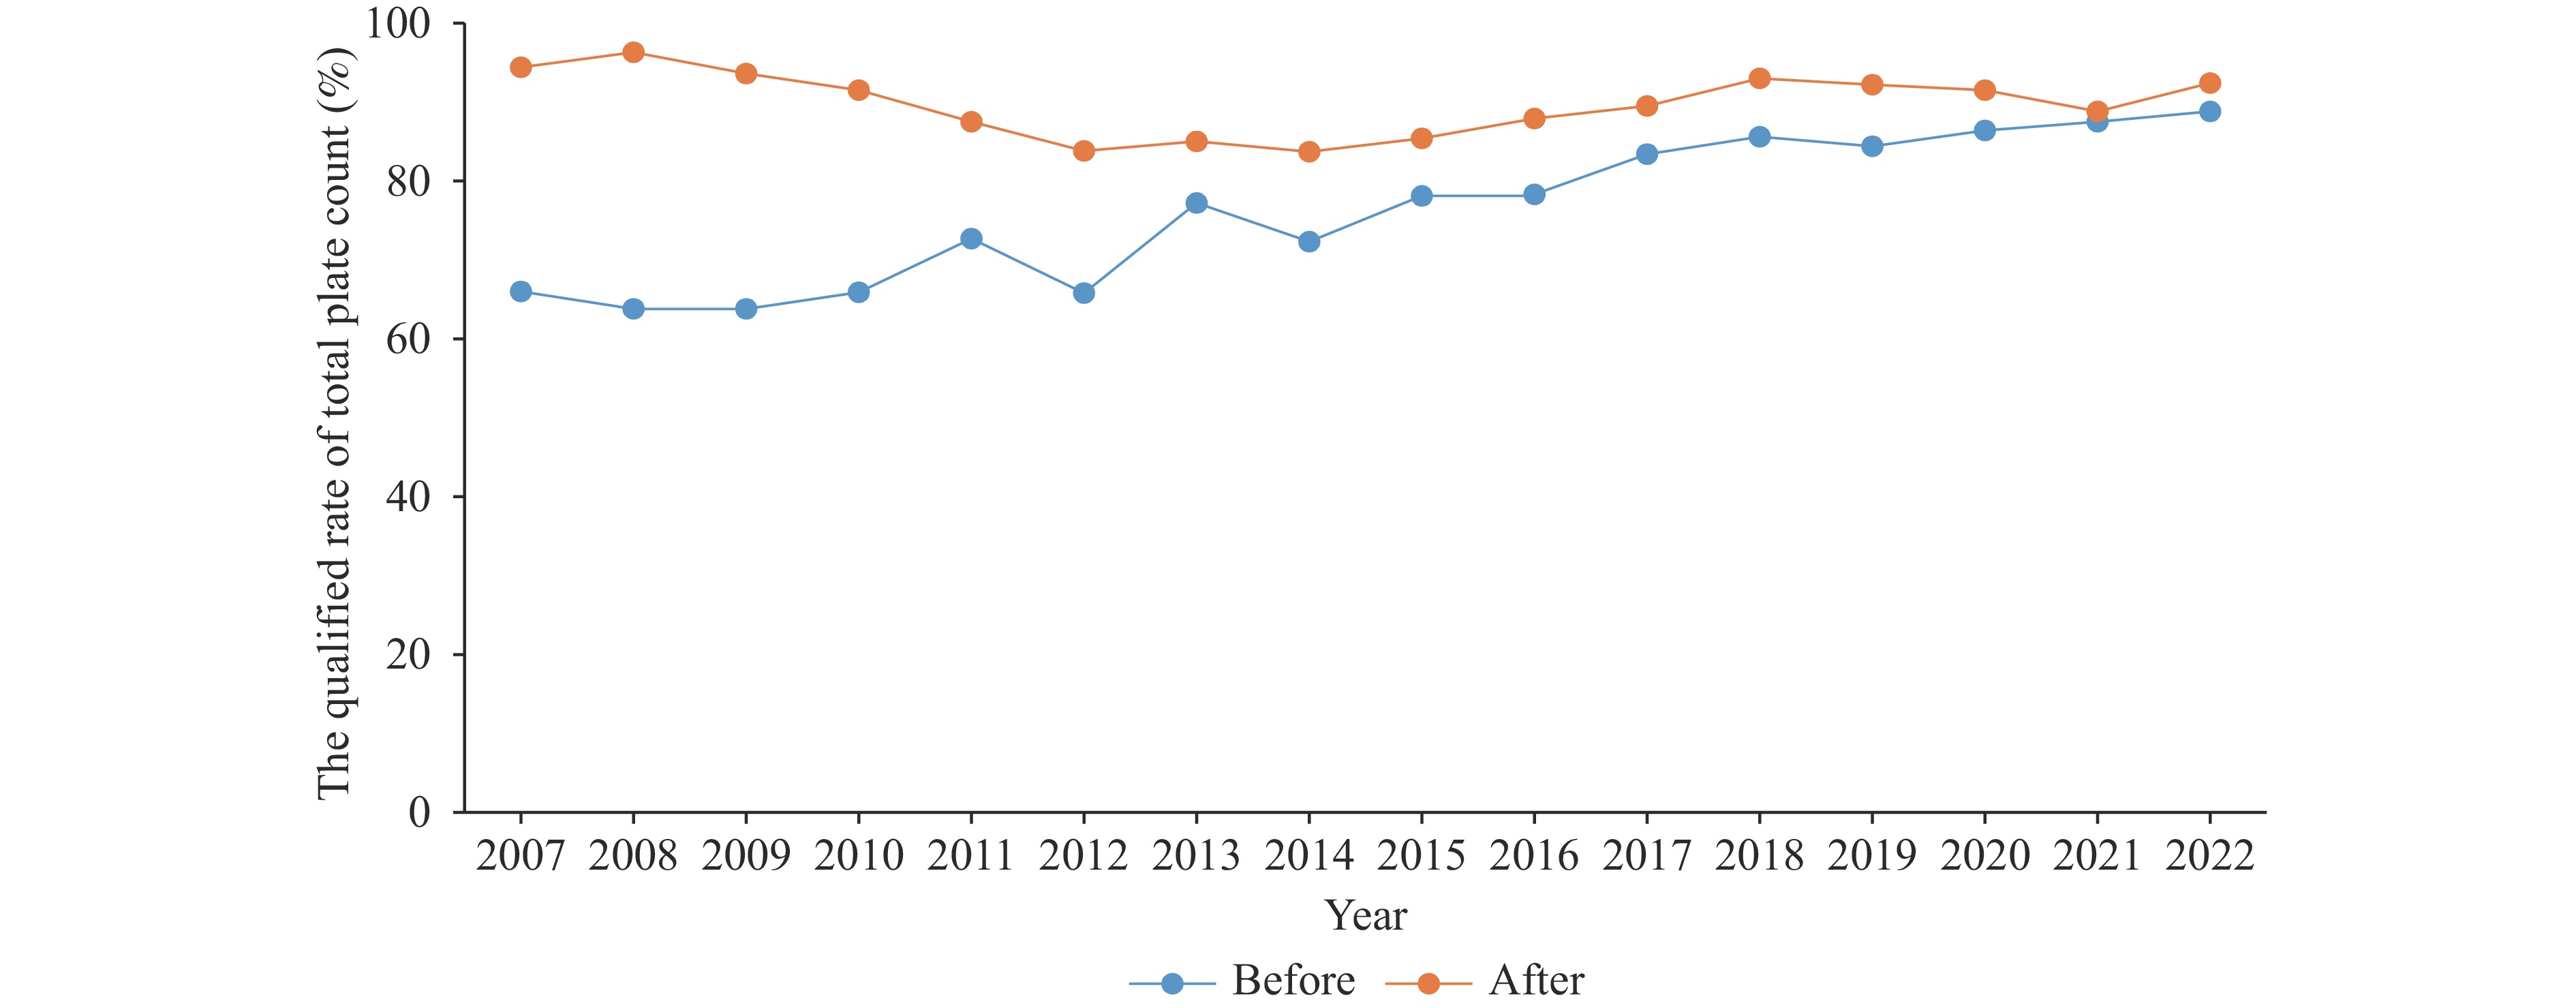 Figure 2.
The qualified rates of total plate count before and after disinfection from 2007 to 2022.
-
This 16-year longitudinal surveillance study investigated changes in bacterial contamination and disinfection efficacy across China. Environmental samples were collected from 249 hospitals spanning 31 PLADs, providing a comprehensive national representation. The sample comprised 57 primary hospitals, 77 secondary hospitals, and 115 tertiary hospitals, with sampling sites distributed throughout various hospital departments. The overall qualified rate for total plate count was 85.7%, with pathogenic bacteria detected in 3.9% of samples. Bacterial contamination, particularly with pathogenic bacteria, was commonly found on hospital surfaces in China. Globally, the positive rate for aerobic bacteria is reported to be 94.7% (5). These findings underscore the necessity for precautionary measures to limit microbial contamination and reduce infection risks. The contamination levels of surface environments varied considerably among PLADs, likely influenced by local climate conditions, disinfection methodologies, management standards, and other regional factors.
From 2007 to 2022, the qualified rate for total plate count increased from 80.7% to 90.3%, while the positive rate for pathogenic bacteria decreased from 24.2% in 2011 to 1.5% in 2022. The qualified rate for total plate count showed a fluctuating but generally increasing trend, possibly attributable to improvements in detection methods or sampling variations. An anomalous spike in the positive rate for pathogenic bacteria (12.4%) was observed in 2016. This anomaly may be explained by significant improvements in disinfection management in sentinel hospitals after nine years of surveillance from 2007 to 2015. In 2016, hospitals were re-selected in each PLAD to evaluate surface disinfection effectiveness, potentially introducing confounding effects due to variations in hospital administrative proficiency, sampling methodologies, and laboratory testing capacities.
Overall, bacterial contamination levels demonstrated a downward trend over the study period. With increasing recognition of environmental surfaces as vectors for pathogen transmission, there has been renewed emphasis on routine surface disinfection for infection control in hospitals (6). The qualified rate for total plate count was highest in tertiary hospitals compared to primary and secondary hospitals. Tertiary hospitals had a larger sample size and typically maintain dedicated infection control departments that provide standardized disinfection measures. The identification of pathogenic bacteria commenced in 2011, utilizing the laboratory capabilities available at that time. The positive rate for pathogenic bacteria was lower in secondary hospitals compared to primary and tertiary hospitals. Hospital size and capacity likely influenced these results. Tertiary hospitals typically have larger patient volumes and more critically ill patients, while primary hospitals generally lack systematic disinfection measures. These factors potentially explain the higher positive rates of pathogenic bacteria observed in both primary and tertiary settings.
Hospital environments are categorized into four classes based on environmental hygiene requirements. Each class has distinct purposes and hygiene standards. Class I environments, such as clean operating rooms, require stringent hygiene conditions to control infections. Our results indicated that Class I environments had a higher qualified rate for total plate counts compared to other classes. Conversely, the positive rate for pathogenic bacteria in Class I environments was lower than in other classes. The most common contaminants identified were Staphylococcus aureus, Escherichia coli, and Acinetobacter spp. (7).
Hospital environmental disinfection, a critical measure for infection control in healthcare facilities, follows standardized operational procedures and methodologies. However, during practical implementation, disinfection effectiveness may vary due to factors such as management protocols and staff operational practices. This study compared and analyzed bacterial contamination levels on hospital surfaces before and after disinfection. The results showed an increase in the qualified rate for total plate counts and a decrease in the positive rate for pathogenic bacteria post-disinfection. Both rates exhibited similar trends before and after disinfection. Microbiological monitoring of hospital surfaces is a valuable tool for assessing environmental contamination levels and disinfection efficiency. Daily disinfection protocols were strictly implemented during the coronavirus disease 2019 (COVID-19) pandemic in 2021, resulting in minimal differences in the qualified rate for total plate counts before and after disinfection. These findings confirm that routine disinfection effectively reduces microbial contamination on hospital surfaces.
Our study has several limitations. First, data were collected from passive Hospital Infection-Disinfection Surveillance, which might be influenced by changes in surveillance protocols, such as site selection and laboratory testing methods. Second, some pathogenic bacteria were not identified, limiting our ability to explore the effect of disinfection on specific pathogens. Third, total plate count was used as the sole evaluation index for disinfection qualification, leaving some scientific uncertainty regarding the actual infection risk. Further research is needed to develop systematic evaluation methods for assessing the disinfection effectiveness in hospital environments.
-
The authors acknowledge the contributions of the project members from 31 provincial-level Centers for Disease Control and Prevention.
HTML
Study Setting
Sample Collection
Detection of Total Plate Count
Data Analysis
| Citation: |

|