
 Download:


-
Tobacco use and secondhand smoke exposure represent major risk factors for premature death and disability from chronic diseases in China (1). As the world’s largest producer and consumer of tobacco, China faces a substantial economic burden of disease due to tobacco use, with more than one million tobacco-attributable deaths occurring annually (2). The Chinese government has prioritized tobacco control efforts, as evidenced by the State Council’s 2019 “Healthy China 2030” Planning Outline (3) , which establishes a target of reducing the smoking rate to 20% by 2030. Various cities and regions in China have implemented local tobacco control regulations, actively promoted smoke-free environments, established diverse cessation service models, and provided professional clinical cessation services to support smokers in quitting. These comprehensive efforts have demonstrated effectiveness in promoting smoking cessation.
Since 2010, China has established a comprehensive population-based tobacco surveillance system aligned with global standards. This system has systematically monitored the tobacco epidemic and the effectiveness of tobacco control policies among different population groups through continuous data collection from nationally and provincially representative samples. In 2023, the World Health Organization (WHO) rated China’s tobacco surveillance system at the “highest chieving” level (4). This study analyzes the current situation and trend changes in willingness to quit and cessation behaviors among Chinese smokers from 2010 to 2024, providing insights into the effectiveness of China’s smoking cessation efforts over the past decade.
-
Data for this study were derived from the 2010 Global Adult Tobacco Survey (GATS) China Project and the National Adult Tobacco Survey (NATS) conducted in 2018, 2022, and 2024. All four surveys employed multi-stage stratified cluster random sampling of the Chinese population aged 15 years and above. Provinces, autonomous regions, and municipalities directly under the central government were stratified into urban and rural areas across China. The sampling process was conducted in three stages, with details published previously (5).
The surveys collected data on respondents’ basic information, willingness to quit, quit attempts, and smoking cessation behaviors. Current smokers were defined as individuals who smoked at the time of the survey, with daily smokers smoking every day and occasional smokers smoking intermittently. The cessation rate was calculated as the percentage of ex-smokers among the combined population of current and ex-smokers. Willingness to quit was defined as current smokers considering cessation within the next 12 months, while quit attempts referred to any cessation efforts made by current smokers in the previous 12 months. Survey results were analyzed using complex sampling weighting, with each respondent assigned a unique weight for calculating survey estimates. The weighting process comprised three stages (5). All analyses were performed using SAS statistical software with complex sampling analysis procedures. The Cochran-Armitage trend test was employed to analyze changes across the four survey periods. Rao-Scott χ2 test was used, and odds ratios (OR) and 95% confidence intervals (CI) were calculated. All P values were two-sided, with P<0.05 indicating statistical significance.
-
In 2010, 13,354 individuals completed the survey, comprising 6,603 males and 6,751 females (6). In 2018, 19,376 people completed the individual survey, including 9,109 males and 10,267 females (7). The 2022 survey included 182,278 individuals, comprising 91,966 males and 90,312 females. The 2024 survey included 193,007 individuals, with 93,615 males and 99,392 females.
-
From 2010 to 2024, the overall cessation rate increased significantly from 16.88% to 22.65% (χ2=26.83, P<0.001), with significant increases observed across various demographic groups, including both males and females (χ2=25.84, P<0.001; χ2=8.86, P=0.031), individuals aged 45–64 (χ2=10.46, P=0.015), daily and occasional smokers (χ2=52.85, P<0.001; χ2=96.86, P<0.001), urban and rural residents (χ2=10.33, P=0.016; χ2=18.26, P<0.001), people from western regions (χ2=12.13, P=0.007), and those with elementary education or below (χ2=15.76, P=0.001) and middle school education (χ2=41.23, P<0.001). Consistently across survey rounds, cessation rates were substantially higher among women, elderly individuals, and occasional smokers compared to men, younger people, and daily smokers. Western regions generally showed lower cessation rates than middle and eastern regions, while individuals with elementary education or below demonstrated higher cessation rates than those with higher educational attainment. Over the 14-year period, the most notable increases in cessation rates occurred among male smokers, occasional smokers, and populations in western regions. Notably, from 2022 to 2024, the increase was particularly significant among occasional smokers, almost doubling, while cessation rates dropped among daily smokers (Figure 1A, Table 1).
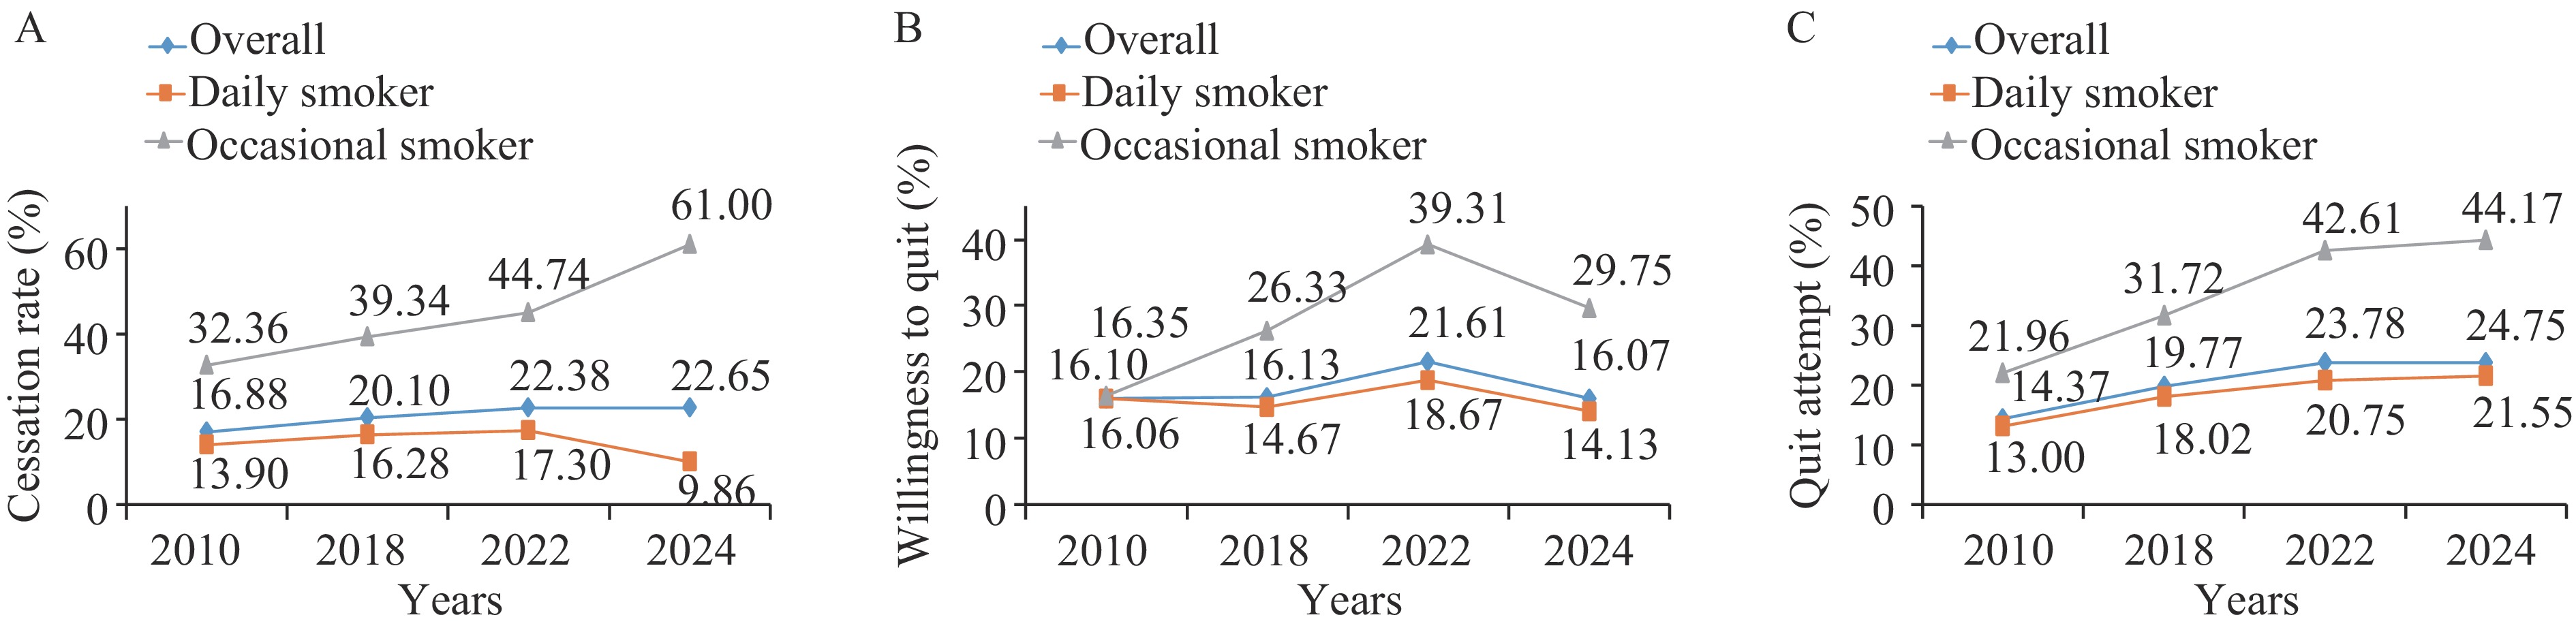 Figure 1.
Trend changes of willingness and cessation behavior, 2010–2024. (A) Cessation rate. (B) Proportion of willingness to quit. (C) Proportion of quit attempt.
Note: The Cochran-Armitage trend test was employed to analyze changes. The Rao-Scott χ2 test was used and odds ratios (OR) and 95% confidence intervals (CI) were calculated. All P values were two-sided, with P<0.05 indicating statistical significance.Factors 2010 2018 2022 2024 Rao-scott χ2 P n (%) 95% CI n (%) 95% CI n (%) 95% CI n (%) 95% CI Total 856 (16.88) 14.53, 19.23 1,553 (20.10) 18.35, 21.85 14,623 (22.38) 21.31, 23.45 15,808 (22.65) 21.70, 23.60 26.83 <0.001** Sex Male 785 (16.50) 14.16, 18.84 1,434 (19.64) 17.85, 21.42 13,520 (21.70) 20.64, 22.75 14,746 (22.31) 21.36, 23.27 25.84 <0.001** Female 71 (24.95) 18.16, 31.73 119 (30.22) 24.26, 36.18 1,103 (36.50) 32.78, 40.22 1,062 (30.22) 26.75, 33.69 8.86 0.031* Age (years) 15–24 14 (8.52) 2.53, 14.51 18 (8.11) 2.68, 13.53 120 (12.11) 8.41, 15.82 116 (11.20) 7.75, 14.66 1.59 0.661 25–44 171 (10.89) 7.89, 13.90 166 (12.13) 10.01, 14.25 1,574 (12.40) 11.13, 13.66 1,406 (12.34) 10.94, 13.74 1.34 0.720 45–64 373 (19.35) 16.76, 21.93 712 (22.48) 20.30, 24.67 6,113 (23.07) 21.78, 24.36 6,140 (23.62) 22.65, 24.58 10.46 0.015* 65 and above 298 (39.26) 34.06, 44.45 657 (38.66) 35.12, 42.21 6,816 (40.69) 39.13, 42.26 8,146 (42.10) 40.60, 43.61 2.83 0.419 Frequency of smoking Daily 622 (13.90) 11.85, 15.95 1,171 (16.28) 14.64, 17.93 7,819 (17.30) 16.29, 18.32 4,386 (9.86) 9.03, 10.68 52.85 <0.001** Occasional 234 (32.36) 25.76, 38.95 382 (39.34) 34.65, 44.02 6,804 (44.74) 42.01, 47.47 11,422 (61.00) 58.66, 63.34 96.86 <0.001** Residence Urban 379 (17.57) 14.06, 21.08 772 (19.97) 17.83, 22.12 6,467 (22.26) 20.64, 23.88 7,529 (22.72) 21.47, 23.96 10.33 0.016* Rural 477 (16.34) 13.48, 19.21 781 (20.27) 17.52, 23.02 8,156 (22.48) 21.06, 23.89 8,279 (22.61) 21.27, 23.94 18.26 <0.001** Regions Eastern 278 (18.71) 14.00, 23.43 650 (21.78) 18.93, 24.64 5,758 (24.30) 22.40, 26.19 6,198 (23.63) 22.35, 24.90 7.63 0.054 Middle 308 (18.58) 14.75, 22.41 517 (21.54) 18.82, 24.27 2,322 (22.35) 20.52, 24.19 4,131 (23.35) 21.73, 24.96 6.03 0.110 Western 270 (13.61) 9.70, 17.53 386 (16.71) 13.42, 19.99 6,543 (19.56) 17.90, 21.23 5,479 (20.51) 18.39, 22.63 12.13 0.007* Educational Level Elementary and below 372 (23.72) 20.18, 27.26 639 (24.42) 21.58, 27.26 4,566 (29.78) 27.97, 31.60 6,268 (29.24) 27.62, 30.87 15.76 0.001* Middle school 250 (12.61) 10.07, 15.14 521 (18.56) 16.02, 21.10 3,946 (20.85) 19.53, 22.18 5,473 (21.53) 20.33, 22.73 41.23 <0.001** High school graduate 155 (17.17) 11.48, 22.86 245 (17.56) 14.67, 20.44 1,694 (20.16) 18.06, 22.27 2,421 (21.28) 19.82, 22.75 3.59 0.309 Junior college and above 77 (16.02) 11.94, 20.11 148 (19.55) 15.94, 23.17 996 (18.60) 16.19, 21.02 1,631 (18.08) 16.40, 19.75 2.31 0.511 Abbreviation: CI=confidence interval.
* P<0.05; ** P<0.001.Table 1. Cessation rates among Chinese smokers aged 15 and above, 2010–2024.
-
The proportion of smokers planning to quit within 12 months fluctuated from 16.10% in 2010 to 16.07% in 2024 (χ2=18.25, P<0.001). This trend remained relatively stable between 2010 and 2018, peaked at 21.61% in 2022, and then declined substantially by 2024. Significant changes were observed among males (χ2=18.45, P<0.001), individuals aged over 25 (χ2=21.90, P<0.001; χ2=14.36, P=0.003; χ2=11.35, P=0.010), both daily and occasional smokers (χ2=9.90, P=0.019; χ2=51.09, P<0.001), urban residents (χ2=23.20, P<0.001), people from eastern regions (χ2=12.37, P=0.006), and those with middle school education and junior college and above (χ2=8.01, P=0.046; χ2=10.82, P=0.013). In 2010, the willingness to quit was comparable between daily and occasional smokers (16.35% vs. 16.06%). However, over the 14-year period, occasional smokers demonstrated a substantial increase in quit intention, reaching a peak of 39.31% in 2022 before declining in 2024, while daily smokers showed minimal change. By 2024, the proportion of occasional smokers willing to quit was significantly higher than that of daily smokers (29.75% vs. 14.13%) (Figure 1B, Table 2).
Factors 2010 2018 2022 2024 Rao-scott χ2 P n (%) 95% CI n (%) 95% CI n (%) 95% CI n (%) 95% CI Total 642 (16.10) 12.75, 19.45 753 (16.13) 14.17, 18.09 6,374 (21.61) 20.63, 22.59 6,682 (16.07) 15.10, 17.05 18.25 <0.001** Sex Male 600 (15.95) 12.51, 19.39 709 (16.07) 14.07, 18.07 6,099 (21.71) 20.70, 22.71 6,327 (16.03) 15.06, 17.00 18.45 <0.001** Female 42 (19.55) 11.61, 27.49 44 (17.57) 10.41, 24.73 275 (19.26) 14.80, 23.72 355 (17.13) 13.07, 21.20 0.46 0.928 Age (years) 15–24 33 (17.52) 7.11, 27.93 30 (20.9) 13.03, 28.77 125 (27.13) 19.22, 35.03 180 (20.40) 15.53, 25.27 2.45 0.484 25–44 227 (14.36) 10.53, 18.20 210 (16.85) 13.96, 19.75 1,650 (23.75) 22.06, 25.44 1,768 (18.12) 16.61, 19.62 21.90 <0.001** 45–64 288 (17.53) 13.92, 21.14 372 (15.50) 13.25, 17.75 3,036 (20.37) 19.12, 21.62 3,205 (14.68) 13.66, 15.70 14.36 0.003* 65 and above 94 (16.92) 11.21, 22.62 141 (12.10) 9.82, 14.38 1,563 (17.18) 15.71, 18.65 1,529 (12.73) 11.54, 13.92 11.35 0.010* Frequency of smoking Daily 532 (16.06) 12.49, 19.63 604 (14.67) 12.76, 16.57 5,008 (18.67) 17.74, 19.60 5,326 (14.13) 13.23, 15.02 9.90 0.019* Occasional 110 (16.35) 12.33, 20.37 149 (26.33) 20.28, 32.37 1,232 (39.31) 34.88, 43.73 1,356 (29.75) 26.81, 32.69 51.09 <0.001** Residence Urban 227 (13.53) 9.49, 17.58 344 (14.21) 11.93, 16.50 2,584 (22.00) 20.51, 23.49 2,844 (15.53) 13.93, 17.13 23.20 <0.001** Rural 415 (18.02) 13.51, 22.53 409 (18.61) 15.39, 21.84 3,790 (21.26) 19.98, 22.54 3,838 (16.42) 15.19, 17.64 5.40 0.145 Regions Eastern 189 (14.56) 10.08, 19.04 230 (14.71) 11.85, 17.58 2,805 (20.80) 19.38, 22.22 2,008 (15.12) 13.46, 16.78 12.37 0.006* Middle 202 (15.75) 11.72, 19.78 256 (15.43) 12.50, 18.37 1,237 (20.40) 18.51, 22.30 1,624 (16.59) 15.01, 18.17 7.13 0.068 Western 251 (17.89) 10.62, 25.16 267 (18.38) 14.38, 22.39 2,332 (24.23) 22.43, 26.03 3,050 (16.92) 15.20, 18.63 5.06 0.167 Education level Elementary and below 206 (15.04) 11.53, 18.56 241 (15.00) 12.46, 17.55 1,840 (17.34) 16.01, 18.66 1,985 (12.77) 11.64, 13.91 6.41 0.093 Middle school 255 (16.95) 12.03, 21.86 276 (15.19) 12.02, 18.36 2,573 (21.10) 19.65, 22.56 2,472 (15.39) 14.08, 16.69 8.01 0.046* High school graduate 114 (15.19) 8.16, 22.22 128 (15.33) 11.60, 19.05 1,117 (23.11) 20.48, 25.74 1,129 (17.07) 15.21, 18.94 7.08 0.069 Junior college and above 67 (16.94) 10.87, 23.01 108 (22.54) 17.40, 27.68 841 (27.34) 24.04, 30.63 1,088 (19.96) 17.43, 22.48 10.82 0.013* Abbreviation: CI=confidence interval.
* P<0.05; ** P<0.001.Table 2. Willingness to quit smoking (12 months) among Chinese smokers aged 15 and above, 2010–2024.
-
The proportion of smokers who attempted to quit smoking in the past 12 months increased significantly from 14.37% in 2010 to 24.75% in 2024 (χ2=74.16, P<0.001), with a substantial rise from 2010 to 2022, followed by a steady increase from 2022 to 2024. Significant increases were observed across multiple demographic groups: males (χ2=74.31, P<0.001), individuals aged 25 and above (χ2=98.86, P<0.001; χ2=56.83, P<0.001; χ2=16.38, P<0.001), both daily and occasional smokers (χ2=48.78, P<0.001; χ2=53.83, P<0.001), urban and rural residents (χ2=82.67, P<0.001; χ2=25.17, P<0.001), people from eastern, central, and western regions (χ2=18.84, P<0.001; χ2=32.87, P<0.001; χ2=41.35, P<0.001), and across all educational levels (χ2=29.32, P<0.001; χ2=35.51, P<0.001; χ2=18.26, P<0.001; χ2=40.68, P<0.001).
Across survey rounds, female smokers consistently showed slightly higher quit attempt rates than males, and younger adults (15–44 age group) generally reported more quit attempts than older populations. Notably, in 2010, occasional smokers showed much higher quit attempt rates than daily smokers, and this disparity continued to widen from 2010 to 2024. Quit attempt rates showed minimal variation between urban and rural areas, across different economic regions, and among different education levels (Figure 1C, Table 3).
Factors 2010 2018 2022 2024 Rao-scott χ2 P n (%) 95% CI n (%) 95% CI n (%) 95% CI n (%) 95% CI Total 613 (14.37) 11.75, 16.98 965 (19.77) 18.03, 21.52 7,360 (23.78) 22.68, 24.89 10,674 (24.75) 23.61, 25.89 74.16 <0.001** Sex Male 564 (14.17) 11.54, 16.81 904 (19.62) 17.84, 21.41 6,992 (23.84) 22.71, 24.97 10,074 (24.65) 23.54, 25.76 74.31 <0.001** Female 49 (18.62) 12.31, 24.93 61 (23.52) 15.99, 31.04 368 (22.40) 18.83, 25.96 600 (27.40) 22.33, 32.46 4.58 0.205 Age (years) 15–24 38 (23.67) 13.34, 34.00 45 (23.63) 15.50, 31.76 145 (30.48) 21.54, 39.42 248 (30.21) 24.36, 36.05 2.04 0.564 25–44 218 (11.58) 8.95, 14.20 284 (21.59) 18.85, 24.34 1,778 (25.11) 23.25, 26.97 2,457 (25.90) 24.15, 27.64 98.86 <0.001** 45–64 245 (13.21) 10.55, 15.86 454 (18.05) 15.99, 20.11 3,507 (22.59) 21.12, 24.07 5,035 (23.13) 21.85, 24.42 56.83 <0.001** 65 and above 112 (17.94) 13.30, 22.59 182 (16.41) 13.53, 19.29 1,930 (20.79) 19.20, 22.37 2,934 (23.92) 22.55, 25.29 16.38 <0.001** Frequency of smoking Daily 489 (13.00) 10.36, 15.64 781 (18.02) 16.21, 19.83 5,808 (20.75) 19.76, 21.73 7,914 (21.55) 20.39, 22.70 48.78 <0.001** Occasional 124 (21.96) 16.34, 27.58 184 (31.72) 25.93, 37.50 1,458 (42.61) 38.52, 46.71 2,760 (44.17) 41.48, 46.85 53.83 <0.001** Residence Urban 227 (11.72) 8.82, 14.62 512 (19.77) 17.55, 21.99 3,110 (24.36) 22.60, 26.11 4,823 (24.82) 23.05, 26.59 82.67 <0.001** Rural 386 (16.33) 12.81, 19.85 453 (19.78) 16.87, 22.68 4,250 (23.27) 21.89, 24.65 5,851 (24.71) 23.22, 26.20 25.17 <0.001** Regions Eastern 176 (14.13) 8.62, 19.64 322 (18.55) 16.27, 20.83 3,199 (21.97) 20.33, 23.61 3,461 (24.16) 22.40, 25.92 18.84 <0.001** Midlle 198 (16.20) 13.22, 19.18 327 (18.23) 15.51, 20.95 1,524 (23.56) 21.61, 25.52 2,852 (25.37) 23.12, 27.61 32.87 <0.001** Western 239 (13.22) 9.21, 17.24 316 (22.54) 18.83, 26.25 2,637 (27.03) 24.66, 29.40 4,361 (24.99) 22.95, 27.04 41.35 <0.001** Education level Elementary and below 200 (14.27) 11.01, 17.53 292 (16.12) 13.63, 18.61 2,227 (20.93) 19.35, 22.50 3,408 (22.75) 21.30, 24.21 29.32 <0.001** Midlle school 233 (14.27) 11.07, 17.46 349 (18.23) 15.52, 20.94 2,933 (23.11) 21.43, 24.78 4,037 (23.71) 22.25, 25.17 35.51 <0.001** High school graduate 117 (14.93) 9.04, 20.81 182 (21.43) 17.65, 25.20 1,229 (23.77) 21.39, 26.16 1,744 (27.23) 25.08, 29.38 18.26 <0.001** Junior college and above 62 (13.48) 10.18, 16.78 142 (29.34) 23.99, 34.69 965 (29.66) 26.97, 32.35 1,473 (26.71) 23.84, 29.58 40.68 <0.001** Abbreviation: CI=confidence interval.
* P<0.05; ** P<0.001.Table 3. Quit attempts among Chinese smokers aged 15 and above, 2010–2024.
-
This study analyzes data from four national surveys conducted in 2010, 2018, 2022, and 2024 among Chinese smokers. The trend analysis results indicate that tobacco control efforts in China have advanced steadily over this 14-year period, with coordinated multi-sectoral implementation of tobacco control compliance measures and Healthy China Initiative objectives. While the overall cessation rate and quit attempts have increased steadily across almost all demographic groups, the proportion of smokers reporting quit intentions and quit attempts in 2024 remained below international averages (over 60% for quit intentions and over 40% for quit attempts) (8).
Due to nicotine’s addictive nature, evidence-based cessation services are essential for successful smoking cessation (9). China has developed an integrated cessation service model that incorporates smoking cessation clinics, brief interventions, quitlines, community-based services, and mobile cessation support. The introduction of comprehensive community-based cessation services in 2021 and the launch of the Help You Quit APP in 2023 have significantly improved the accessibility and convenience of cessation services (10–11). Through sustained efforts, China’s cessation service network has matured, accessibility has improved, and the proportion of physician-provided cessation services has increased, making professional cessation assistance available to more people. Additionally, the implementation of tobacco-free legislation, effective law enforcement at city and regional levels, and the development of smoke-free environments have collectively contributed to more people choosing to quit smoking. Notably, cessation rates among daily smokers dropped from 2022 to 2024. Research shows that smokers with higher levels of nicotine dependence typically experience poorer smoking cessation outcomes (12). The trend analysis results indicate the limited effectiveness of existing cessation services for daily smokers, highlighting the need for more intensive or tailored interventions targeting this subgroup.
Trend analysis reveals that individuals with elementary education or below had higher cessation rates than those with higher educational attainment, which contrasts with findings from most previous studies suggesting higher education is associated with higher cessation rates. Additionally, the cessation rate among those with junior high school education increased significantly from 12.61% in 2010 to 21.53% in 2024 (an absolute increase of nearly 10%), followed by a –6% increase in the group with elementary education or below. These changes reflect a stronger response among youth and low-education groups to national tobacco control policies, including school-based health education, adolescent-focused mass media campaigns, and restricted access to tobacco among minors implemented during the past decade.
Research shows that willingness to quit smoking plays a significant role in initiating quit attempts (13–14). China has implemented comprehensive tobacco control advocacy through multilevel, multidimensional publicity campaigns. These tobacco control initiatives adhere to the World Health Organization’s highest standards. Their implementation through diverse platforms and communication channels has markedly enhanced public awareness of smoking cessation and facilitated improved quitting outcomes among smokers. However, the willingness to quit smoking dropped from 2022 to 2024. This decline likely resulted from the intensive tobacco control advocacy focused on cessation in 2021 and 2022, which was not maintained at the same level in 2023 and 2024, indicating that targeted measures to enhance quit intention need improvement. The MPOWER policy on tobacco control
1 introduced by WHO emphasizes that pricing policies and graphic warnings on cigarette packaging effectively increase quit intentions and quit attempts (15). However, Chinese pricing policies and cigarette packaging still fall considerably short of WHO-recommended standards. To further enhance smokers’ willingness to quit and encourage more cessation attempts, China’s tobacco control policies must continue to prioritize pricing policies and packaging regulations. Additionally, providing comprehensive smoking cessation intervention services at the community level, including activities to enhance the willingness to quit, can expand the coverage of publicity campaigns to reach more smokers.This study has several limitations. First, although the NATS was also conducted in 2015, that year’s national dataset lacked key indicators in the cessation section, preventing comparable analysis with the other surveys between 2010 and 2018. Additionally, this study addresses changes in smoking cessation that might be less objective in evaluating the effectiveness of cessation services in China. Further studies should be implemented to better assess the effectiveness of smoking cessation services.
Trend analysis results in this study suggest that comprehensive tobacco control measures, such as pricing policies, graphic health warnings on packaging, and enhanced cessation interventions can promote smoking cessation behaviors and enhance tobacco control efforts.
HTML
Trend Changes for Cessation Behavior
Trend Changes for Willingness to Quit
Trend Changes for Quit Attempt
FootNote
| ① | A package of six proven policies, including monitor tobacco use and prevention policies; protect people from tobacco smoke; offer help to quit tobacco use; warn about the dangers of tobacco; enforce bans on tobacco advertising, promotion and sponsorship; and raise taxes on tobacco. |
| Citation: |

|