
 Download:


-
Introduction: Depression among older adults has emerged as a critical public health concern in China. While previous studies have demonstrated spatial heterogeneity in the prevalence of depressive symptoms among elderly populations across China, the spatiotemporal evolution of this phenomenon remains inadequately explored. This study aimed to estimate city-level prevalence of depressive symptoms among elderly Chinese residents from 2013 to 2020 and analyze its spatial-temporal patterns.
Methods: Data were obtained from the China Health and Retirement Longitudinal Study (CHARLS) surveys conducted in 2013, 2015, 2018, and 2020. The study employed sandwich estimation methodology to calculate prevalence rates, while global autocorrelation analysis was utilized to evaluate spatial patterns in the distribution of depressive symptoms.
Results: The average prevalence of depressive symptoms among Chinese older adults demonstrated a consistent increase from 30.27% [95% confidence interval (CI): 24.53%, 36.02%] in 2013 to 37.79% (95% CI: 31.01%, 44.56%) in 2020. Higher prevalence rates were observed in cities across Southwest, Northwest, and Central China, although no significant spatial aggregation was detected.
Conclusions: The prevalence of depressive symptoms among older adults in China showed a substantial increase between 2013 and 2020. Enhanced preventive measures and interventions are particularly needed to improve mental well-being among elderly populations in China’s western and central regions.
-
Depression among older adults has emerged as a critical public health challenge in China (1). While previous research has documented spatial disparities in its prevalence (2), a comprehensive understanding of its spatiotemporal patterns remains elusive. This study aimed to estimate city-level prevalence of depressive symptoms among elderly individuals across China from 2013 to 2020, incorporating key risk factors and analyzing spatial-temporal trends. The study results reveal an increasing prevalence of depressive symptoms among older adults from 2013 to 2020. Although no distinct spatial clustering emerged, cities with the highest prevalence were consistently concentrated in the Southwest, Northwest, and Central China, while those with the lowest prevalence were predominantly located in East and North China
1 . These findings underscore the need for enhanced mental health initiatives targeting China’s elderly population, particularly in high-prevalence regions.Data were obtained from CHARLS, a nationally representative longitudinal survey of Chinese individuals aged 45 years and older. CHARLS employs multistage stratified probability proportional to size (PPS) sampling to ensure sample representativeness (3). This study used data from surveys conducted in 2013, 2015, 2018, and 2020. Participants were selected based on three criteria: 1) age 60 years or older, 2) complete responses to all depression assessment questions, and 3) residence in cities with available socioeconomic status data. The final study sample comprised 7,091 individuals from 122 cities in 2013, 8,173 individuals from 122 cities in 2015, 8,293 individuals from 122 cities in 2018, and 8,310 individuals from 121 cities in 2020. The participant selection flowchart (
Supplementary Figure S1 ) and baseline characteristics (Supplementary Table S1 ) are provided in theSupplementary Material . Depressive symptoms were assessed using the 10-item version of the Center for Epidemiologic Studies Depression Scale (CES-D-10), with scores ranging from 0 to 30; scores of 10 or higher indicated depressive symptoms (4). City-level prevalence calculations were performed using Stata (version 14, Stata Corp LLC, College Station, TX, USA). Age composition comparisons across the four survey rounds were evaluated using Chi-square tests in SPSS (version 24, IBM, Armonk, New York, USA).The sandwich estimation method was employed to estimate prevalence through a four-step model construction process: 1) obtaining sample layer data (collecting elderly depressive symptom prevalence data from CHARLS surveys); 2) acquiring key factors for the zoning layer; 3) partitioning the research area into spatially homogeneous subareas based on factor homogeneity; and 4) dividing the sample layer by the zoning layer to calculate sample mean and variance for each zone. The overlapping and tangent city-level reporting and zoning layers enabled inference of zoning layer mean and variance for each reporting unit, yielding city-specific estimates (5). The national average prevalence was calculated by weighting each city’s prevalence by its elderly population.
Based on previous research (2,6–7), seven key factors for depression were incorporated into the estimation process: sex, education level, place of residence, personal income, socioeconomic status, access to healthcare facilities, and air pollution.
Supplementary Table S2 details the selected risk factors and proxy variables. Missing data for key factors were imputed using the “Fill Missing Values” tool in ArcGIS Pro (version 3.0, Esri, Redlands, California, USA). Spatial patterns in depressive symptom prevalence were assessed through global autocorrelation analysis using Global Moran’s Index in ArcGIS Pro (version 3.0, Esri, Redlands, California, USA).The average prevalence of depressive symptoms among older adults in China demonstrated a consistent upward trend from 2013 to 2020. The prevalence rates were 30.27% [95% confidence interval (CI): 24.53%, 36.02%], 33.17% (95% CI: 27.21%, 39.12%), 34.75% (95% CI: 28.20%, 41.31%), and 37.79% (95% CI: 31.01%, 44.56%) in 2013, 2015, 2018, and 2020, respectively. Between 2013 and 2020, 338 cities (92.1% of cities in Chinese mainland) experienced increases in prevalence, with increments ranging from 0.16% to 29.35%. Analysis by geographical division revealed that cities in Central China exhibited the most substantial increases (Table 1).
Geographical divisions Average prevalence of elderly depressive symptoms (%, 95% CI) 2013 2015 2018 2020 North 27.47 (21.69, 33.24) 29.28 (23.64, 34.92) 32.61 (26.23, 39.00) 33.20 (26.56, 39.83) East 28.69 (23.09, 34.28) 31.30 (25.53, 37.06) 29.57 (23.09, 36.05) 34.69 (27.91, 41.47) Northeast 27.30 (21.61, 32.98) 31.36 (25.65, 37.06) 34.89 (28.48, 41.31) 36.96 (30.29, 43.64) South 31.05 (25.27, 36.84) 34.30 (28.22, 40.38) 37.20 (30.39, 44.01) 37.82 (30.75, 44.88) Central 31.45 (25.64, 37.25) 34.30 (28.18, 40.42) 36.75 (30.13, 43.37) 40.92 (34.01, 47.83) Northwest 35.15 (29.16, 41.15) 36.16 (30.22, 42.11) 37.76 (31.19, 44.32) 41.95 (35.14, 48.76) Southwest 33.54 (27.67, 39.41) 37.77 (31.47, 44.07) 42.63 (35.72, 49.54) 43.69 (36.76, 50.62) Note: The average prevalence of elderly depressive symptoms in each geographical division was calculated by weighting each city’s prevalence by its elderly population. Cities in the Chinese mainland were categorized into seven divisions: North (Beijing Municipality, Tianjin Municipality, Hebei Province, Shanxi Province, and Inner Mongolia Autonomous Region), East (Shanghai Municipality, Anhui Province, Fujian Province, Jiangsu Province, Jiangxi Province, Shandong Province, and Zhejiang Province), Northeast (Heilongjiang Province, Jilin Province, and Liaoning Province), South (Guangdong Province, Guangxi Zhuang Autonomous Region, and Hainan Province), Central (Henan Province, Hubei Province, and Hunan Province), Northwest (Gansu Province, Ningxia Hui Autonomous Region, Qinghai Province, Shaanxi Province, and Xinjiang Uygur Autonomous Region), and Southwest (Chongqing Municipality, Guizhou Province, Sichuan Province, Xizang Autonomous Region, and Yunnan Province).
Abbreviation: CI=confidence interval.Table 1. Average prevalence of depressive symptoms among older adults in different geographical divisions in China, 2013–2020.
Spatial analysis revealed a weak positive spatial autocorrelation in elderly depressive symptom prevalence across China. The annual global spatial autocorrelation analysis demonstrated a declining trend in Moran’s I from 0.105 in 2013 to 0.072 in 2020, indicating a progressive weakening of spatial autocorrelation (Table 2). Despite this declining spatial clustering, cities with the highest prevalence were consistently concentrated in the Northwest, Southwest, and Central China, while those with the lowest prevalence were predominantly located in East and North China (Figure 1).
Year Moran’s I Z score P 2013 0.105 10.459 <0.01 2015 0.108 10.632 <0.01 2018 0.104 10.323 <0.01 2020 0.072 7.199 <0.01 Note: If Moran’s I is not equal to 0 and Z is greater than or equal to 1.96 or less than or equal to –1.96, the distribution of cases indicates spatial correlation. If Moran’s I is close to 0 and Z values lie between –1.96 and 1.96, the cases are randomly distributed, showing no spatial autocorrelation. Table 2. Global autocorrelation analysis of elderly depressive symptom prevalence in China, 2013–2020.
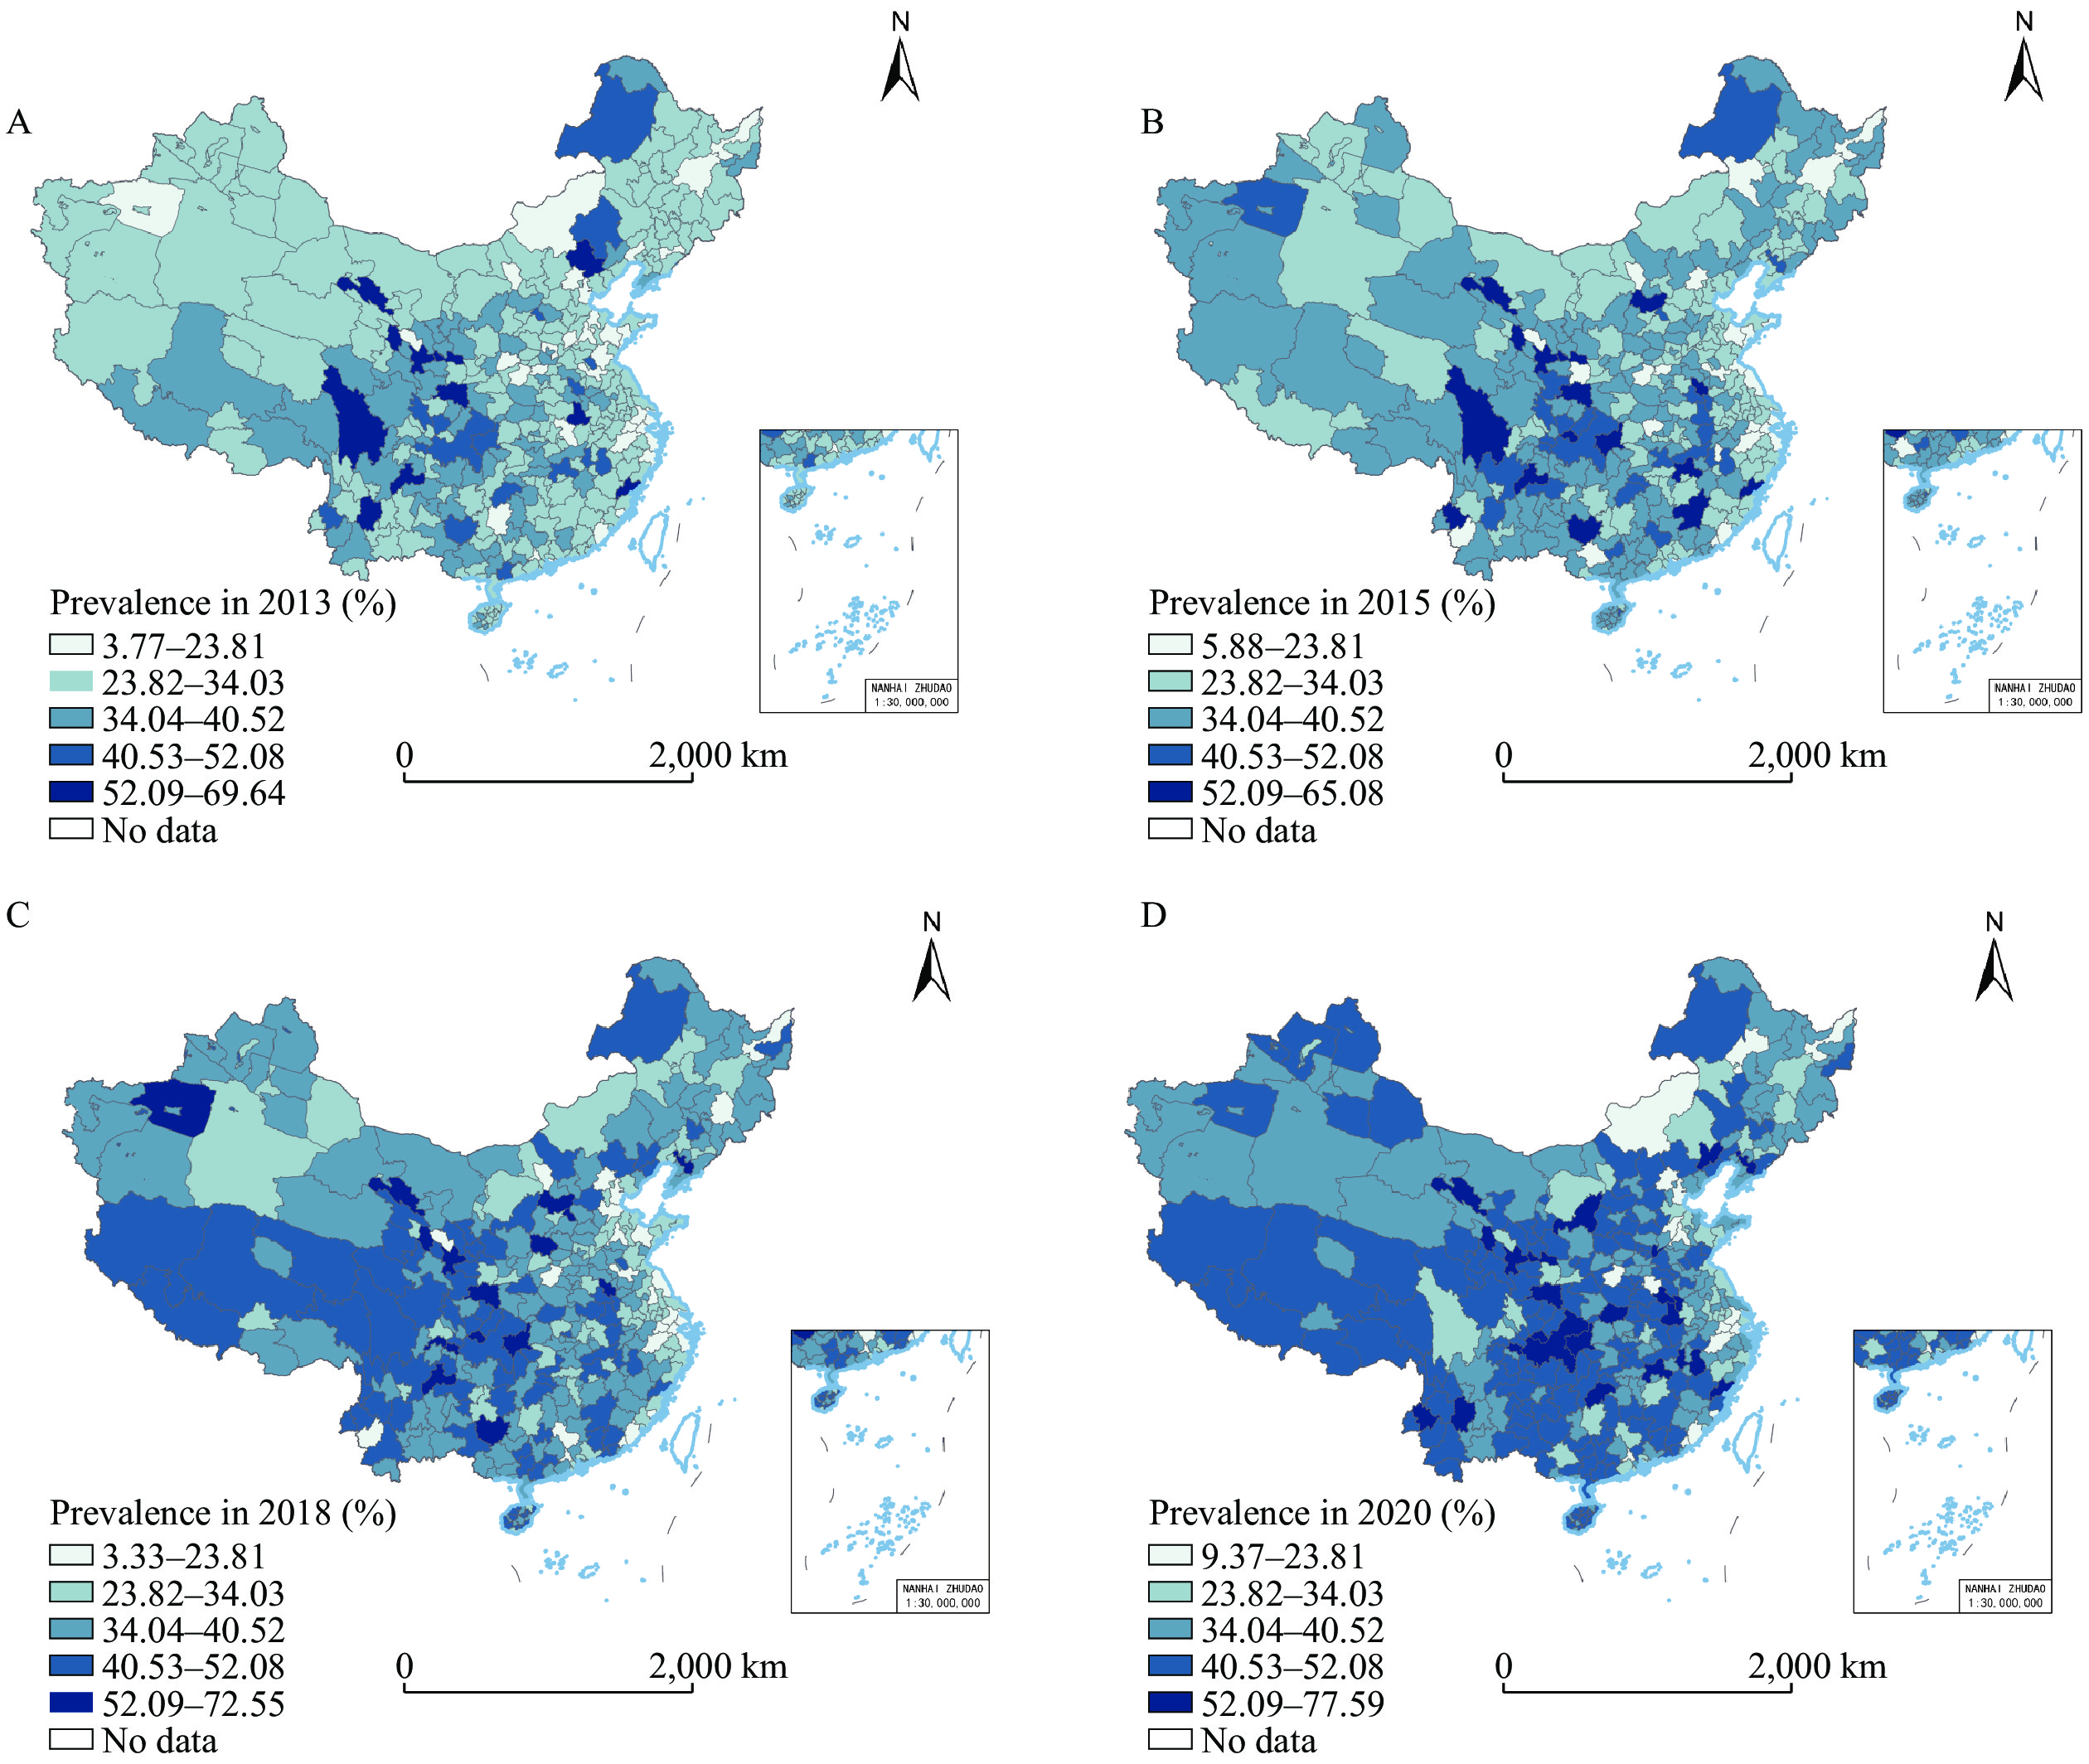 Figure 1.
Estimated city-level prevalence of elderly depressive symptoms in China in (A) 2013; (B) 2015; (C) 2018; and (D) 2020.
Map approval number: GS京(2025)0543号. -
This study employed a sandwich estimation model to evaluate the prevalence of depressive symptoms among elderly Chinese individuals, utilizing CHARLS data while accounting for established risk factors. Chi-square analysis revealed no significant differences in age composition across the four survey rounds (P>0.05), suggesting that the estimated prevalence results are comparable and accurately reflect the disease burden of elderly depressive symptoms. The findings demonstrated a substantial mental health burden among this population, with average prevalence increasing between 2013 and 2020. Geographically, the prevalence of elderly depressive symptoms showed consistent variation across cities, with higher rates concentrated in the Southwest, Northwest, and Central China.
The study results indicate a progressive increase in the disease burden of depressive symptoms among elderly individuals in China from 2013 to 2020. The average prevalence reached 37.79% (95% CI: 31.01%, 44.56%) in 2020, nearly triple the global prevalence of 13.3% (95% CI: 8.4%, 20.3%) reported in previous research (8), and almost quadruple the 10.6% prevalence among Chinese adults documented in the “China National Mental Health Development Report (2021–2022)” (2). This burden is likely to escalate rapidly with China’s aging population. Importantly, depression in elderly individuals often carries more severe consequences, with affected older adults facing elevated risks of disability, mortality, and suicide (8). These findings underscore the urgent need for enhanced attention to older adult mental health through targeted policy development and preventive interventions.
Spatial analysis revealed weak spatial autocorrelation in the prevalence of depressive symptoms among Chinese older adults, with this correlation declining throughout the study period, particularly in 2020. This reduction in spatial clustering may partially reflect the broader impact of decreased social engagement during the coronavirus disease 2019 (COVID-19) pandemic (9). Geographically, cities reporting high prevalence were predominantly located in the Southwest, Northwest, and Central China, specifically in Gansu, Qinghai, Sichuan, and Hubei provinces. Conversely, lower prevalence rates were observed in Zhejiang and Jiangsu provinces. This pattern likely reflects regional disparities in socioeconomic status and healthcare accessibility, with the enhanced economic development and healthcare infrastructure in Zhejiang and Jiangsu provinces potentially contributing to lower prevalence rates (10).
Several limitations warrant consideration. First, the reliance on self-reported depressive symptoms may have introduced reporting bias, potentially excluding individuals with severe symptoms or low educational attainment who did not complete all assessment questions. Therefore, caution is necessary when extrapolating and interpreting these results. Second, while our estimation incorporated seven key risk factors, data limitations prevented the inclusion of other potential confounders that might influence depressive symptom prevalence. Finally, although this study thoroughly examined the spatiotemporal distribution of elderly depressive symptom prevalence in China, it did not explore the underlying mechanisms driving these patterns, presenting an important avenue for future research.
In conclusion, this study demonstrates that the prevalence of depressive symptoms among older adults in China was not only high but increased substantially from 2013 to 2020. While no strong spatial clustering was detected, significant geographic variation exists, with consistently higher prevalence rates in the southwestern, northwestern, and central regions. These results emphasize the critical need to investigate the underlying causes of elevated prevalence in these areas and develop targeted, evidence-based strategies for prevention and intervention.
-
The China Center for Economic Research, National School of Development, Peking University for providing the CHARLS data; and all study participants for their valuable contributions.
-
Approval from the Biomedical Ethics Committee of Peking University (IRB00001052-11015), and all participants provided informed consent.
HTML
FootNote
| ① | Cities in China were categorized into seven divisions: North (Beijing Municipality, Tianjin Municipality, Hebei Province, Shanxi Province, and Inner Mongolia Autonomous Region), East (Shanghai Municipality, Anhui Province, Fujian Province, Jiangsu Province, Jiangxi Province, Shandong Province, and Zhejiang Province), Northeast (Heilongjiang Province, Jilin Province, and Liaoning Province), South (Guangdong Province, Guangxi Zhuang Autonomous Region, and Hainan Province), Central (Henan Province, Hubei Province, and Hunan Province), Northwest (Gansu Province, Ningxia Hui Autonomous Region, Qinghai Province, Shaanxi Province, and Xinjiang Uygur Autonomous Region), and Southwest (Chongqing Municipality, Guizhou Province, Sichuan Province, Xizang Autonomous Region, and Yunnan Province). |
| Citation: |

|