
 Download:


-
Introduction: Research on the well-being of persons with disabilities (PWDs) has predominantly focused on objective living conditions and physical improvements, with insufficient attention to subjective experiences. This study addresses this gap by examining how rehabilitation service utilization enhances economic participation, thereby alleviating subjective relative deprivation (SRD).
Methods: Data from 5,288 certified PWDs were analyzed using the National Sample Survey on Subjective Perceptions and Evaluation of Persons with Disabilities’ Protection and Development (2023) in China. Linear regression and the Karlson, Holm, and Breen (KHB) method were employed. A heterogeneity analysis was conducted to evaluate subgroup variations.
Results: Rehabilitation service utilization is negatively associated with SRD [β=−0.532, 95% confidence interval (CI): −0.832, −0.231, P<0.001], with economic participation serving as a mediator in this relationship (KHB: β=−0.044, 95% CI: −0.087, −0.001, P<0.05). The SRD-reducing effect of rehabilitation services is stronger among individuals with mild to moderate disabilities (β=−0.634,95% CI: −1.070, −0.197, P<0.01), those with at least a middle school education (β=−0.850,95% CI: −1.250, −0.450, P<0.001), and urban residents (β=−0.803, 95% CI: −1.370, −0.236, P<0.01). The mediating effects are also more pronounced within these subgroups.
Conclusions: Policies should prioritize enhancing rehabilitation services and employment support for PWDs, with particular focus on groups with mild to moderate disabilities, higher education backgrounds, and urban residents. Psychological interventions should also be implemented to mitigate SRD-related mental health risks.
-
As global economic, social, political, and cultural environments continue to evolve, the concentration of wealth, unequal distribution of resources, and solidification of social stratification have exacerbated subjective relative deprivation (SRD). This important concept in social psychology refers to individuals experiencing a sense of deprivation regarding their circumstances compared to a reference group. The SRD question is particularly significant for persons with disabilities (PWDs). As a negative subjective experience, relative deprivation leads to more mental health problems, including more frequent depressive symptoms and cognitive function decline (1-2). By the end of 2022, approximately 37,681,660 certified PWDs lived in China (3). As an integral part of society, the subjective experiences of this population cannot be overlooked. The Chinese government has recently emphasized enhancing PWDs’ sense of fulfillment, which represents a positive approach to reducing SRD.
This study conducted a national survey in China to examine the impact of rehabilitation services utilization on SRD among PWDs. Through rehabilitation services, PWDs can learn various coping strategies to manage the emotional and social aspects of living with a disability. These rehabilitation strategies can help PWDs reduce stress and anxiety associated with their condition. Consequently, rehabilitation services generate positive psychological experiences and richer resource accumulation among PWDs, potentially alleviating their sense of relative deprivation. Beyond this direct relationship, we propose that economic participation of PWDs may serve as a mechanism linking rehabilitation service utilization and SRD. Economic participation has essential economic and social implications, helping PWDs increase income, integrate into society, and satisfy their self-actualization needs.
Data for this study was extracted from the National Sample Survey on Subjective Perceptions and Evaluation of Persons with Disabilities’ Protection and Development (2023). A proportional stratification and multi-stage random sampling method were employed to identify potential subjects, targeting individuals listed in the National Basic Database of People with Disabilities (NBDPD) who possessed identification cards provided by the China Disabled Persons’ Federation (CDPF). From March to June 2023, trained CDPF interviewers conducted surveys with selected individuals. The survey included objective and subjective questions related to economic status, employment, social security, education, and rehabilitation service utilization. The final sample consisted of 5,288 participants (Figure 1).
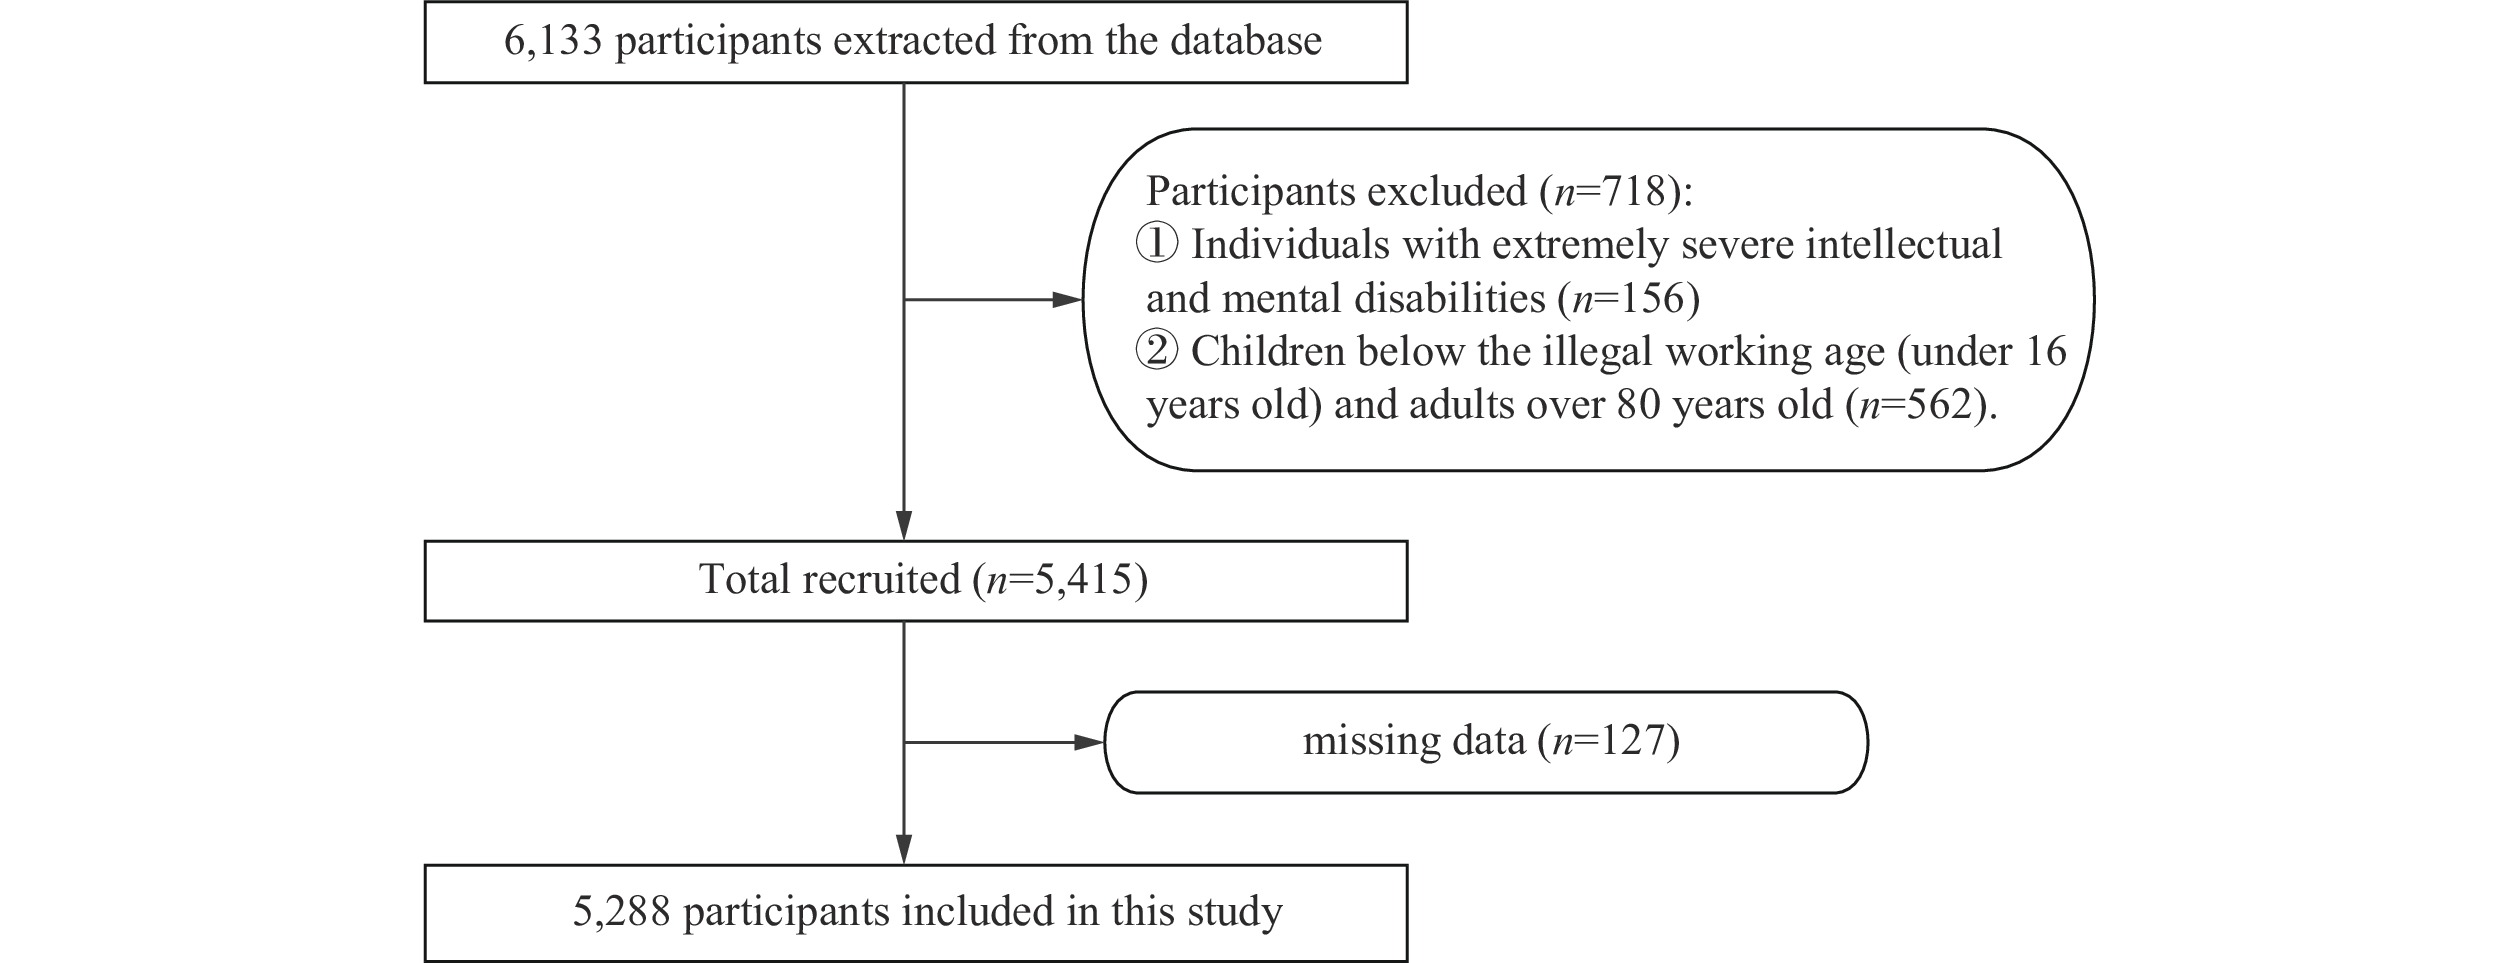 Figure 1.
Flow diagram of the screening and enrollment of study participants.
Following previous studies (4-5), we developed a 10-item scale to measure cognitive and affective dimensions of SRD among PWDs. The scale assessed five domains: family income status, medicine and rehabilitation, public education, vocational training, and provision of barrier-free environments. For each domain, respondents first compared their current situation with the past using a five-point scale ranging from “1 much better” to “5 much worse.” Subsequently, they rated their satisfaction with this change on another five-point scale from “1 very satisfied” to “5 very dissatisfied.” The values were summed, yielding a total score ranging from 10 to 50, with higher values reflecting greater SRD (Cronbach’s α=0.76). Rehabilitation service utilization was assessed with the question: “Within the past year, have you received any rehabilitation services, including rehabilitation medicine, rehabilitation training, assistive devices, and supporting services, specifically tailored to your disability?” The mediating variable — economic participation — was measured by the question: “Have you engaged in any economic activities (such as farming, non-agricultural employment, self-employment, flexible employment, etc.) within the past year?” Potential confounding variables are presented in Table 1.
Variables Frequency/
MedianPercent (%)/
IQRDependent variable SRD 26 6 Independent variable Rehabilitation services utilization Yes 1,282 24.24 No 4,006 75.76 Mediating variable Economic participation Yes 1,733 32.77 No 3,555 67.23 Confounding variables Gender Male 2,193 41.47 Female 3,095 58.53 Spouse Have 3,737 70.67 Not have 1,551 29.33 Age (years) 57 21 Annual household income per
capita (log)9.47 1.32 Education level Illiterate 434 8.21 Elementary school 1,865 35.27 Middle school 2,234 42.25 High school 592 11.20 College and above 163 3.08 Region of residence Eastern 2,314 43.76 Middle 1,534 29.01 Western 1,132 21.41 Northeastern 308 5.82 Residence Rural 3,688 69.74 Urban 1,600 30.26 Nationality Han nationality 4,900 92.66 Minority nationalities 388 7.34 Type of disability Visual 514 9.72 Hearing 422 7.98 Speech 87 1.65 Physical 2,888 54.61 Intellectual 459 8.68 Mental 626 11.84 Multiple 292 5.52 Severity of disability Extremely severe 553 10.46 Severe 1,827 34.55 Moderate 1,321 24.98 Mild 1,587 30.01 Time of disability onset Congenital 1,356 25.64 Acquired 3,932 74.36 Rehabilitation needs at present Have 4,368 82.60 Not have 920 17.40 Abbreviation: SRD=subjective relative deprivation; IQR=interquartile range. Table 1. The utilization of rehabilitation services and the sociodemographic characteristics of the sample (N=5,288).
We initially employed descriptive statistics to characterize the distribution of dependent, independent, and mediating variables. Linear regression models were then used to analyze the relationship between rehabilitation service utilization and SRD. Additionally, subgroup regression analyses were conducted to explore potential variations in the effects of rehabilitation service utilization on SRD across different subpopulations. Heterogeneity was assessed using the Chow test. Subgroups were determined based on disability severity (severe and extremely severe/mild and moderate), education level (elementary school and below/middle school and above), and residence (rural/urban).
We conducted a mediation analysis using the Karlson, Holm, and Breen (KHB) test to investigate the mediating role of economic participation in the relationship between rehabilitation service utilization and SRD. Beyond analyzing the total sample, we examined whether the mediating effect of economic participation varied across different subgroups by conducting separate mediating effect analyses on subsamples based on disability severity, education level, and residence. These subsamples represent variations in physiological conditions, human capital, and opportunities for economic participation that may influence economic outcomes among PWDs.
Table 1 presents the characteristics of the study sample (N=5,288). The table includes frequencies and percentages for categorical variables and median values with interquartile range (IQR) for continuous variables (SRD, age, and annual household income per capita), which were not normally distributed. The median SRD score was 26, with an IQR of 6. More than 50% of PWDs in the sample did not engage in any economic activities during the previous year. Additionally, approximately 75% of PWDs did not access rehabilitation services during this period.
Table 2 presents the linear regression results. Model 1 includes only control variables; Model 2 adds the independent variable to Model 1; and Model 3 incorporates the mediating variable, economic participation, into Model 2. The results demonstrate that rehabilitation services utilization is negatively associated with SRD at the 0.001 significance level in both Model 2 [β=–0.579, 95% confidence interval (CI): –0.882, –0.277, P<0.001] and Model 3 (β=–0.532, 95% CI: –0.832, –0.231, P<0.001). Additionally, economic participation shows a significant negative association with SRD (β=–1.447, 95% CI: –1.723, –1.171, P<0.001). When economic participation was included in Model 3, the absolute value of the rehabilitation services utilization coefficient decreased from 0.579 to 0.532, suggesting that economic participation may mediate the relationship between rehabilitation services utilization and SRD. However, this hypothesis requires further rigorous testing.
Variables Model 1 β (95% CI) Model 2 β (95% CI) Model 3 β (95% CI) Rehabilitation services utilization (ref: no) Yes −0.579*** (−0.882, −0.277) −0.532*** (−0.832, −0.231) Economic participation (ref: no) Yes −1.447*** (−1.723, −1.171) Age (years) 0.004 (−0.005, 0.014) 0.005 (−0.005, 0.014) −0.009 (−0.019, 0.000) Education level (ref: illiterate) Elementary school −0.400 (−0.849, 0.049) −0.413 (−0.862, 0.037) −0.433 (−0.876, 0.011) Middle school 0.267 (−0.192, 0.725) 0.251 (−0.208, 0.711) 0.230 (−0.224, 0.683) High school 0.119 (−0.445, 0.682) 0.101 (−0.461, 0.664) 0.065 (−0.490, 0.621) College and above −0.104 (−0.896, 0.687) −0.099 (−0.895, 0.697) −0.003 (−0.799, 0.793) Spouse (ref: not have) Have −0.080 (−0.362, 0.201) −0.099 (−0.381, 0.183) 0.104 (−0.179, 0.386) Gender (ref: female) Male 0.154 (−0.089, 0.396) 0.147 (−0.095, 0.389) −0.053 (−0.296, 0.190) Residence (ref: rural) Urban 0.530*** (0.254, 0.805) 0.513*** (0.238, 0.788) 0.336* (0.063, 0.609) Nationality (ref: Han nationality) Minority nationalities −0.842*** (−1.283, −0.401) −0.828*** (−1.267, −0.389) −0.891*** (−1.332, −0.449) Type of disability (ref: visual) Hearing 0.010 (−0.538, 0.559) 0.001 (−0.547, 0.549) 0.117 (−0.427, 0.661) Speech 0.353 (−0.687, 1.392) 0.343 (−0.696, 1.382) 0.412 (−0.619, 1.443) Physical −0.110 (−0.534, 0.314) −0.112 (−0.536, 0.312) −0.156 (−0.580, 0.268) Intellectual 0.547 (−0.050, 1.144) 0.536 (−0.060, 1.132) 0.315 (−0.280, 0.911) Mental 0.093 (−0.451, 0.636) 0.122 (−0.421, 0.664) −0.051 (−0.592, 0.490) Multiple 0.648* (0.031, 1.265) 0.646* (0.030, 1.262) 0.566 (−0.047, 1.180) Severity of disability (ref: extremely severe) Severe 0.287 (−0.032, 0.607) 0.289 (−0.030, 0.608) 0.199 (−0.118, 0.515) Moderate 0.311 (−0.001, 0.623) 0.311 (−0.001, 0.622) 0.008 (−0.305, 0.322) Mild 0.645** (0.191, 1.100) 0.654** (0.201, 1.107) 0.315 (−0.140, 0.770) Time of disability onset (ref: acquired) Congenital −0.355* (−0.658, −0.052) −0.351* (−0.653, −0.049) −0.333* (−0.632, −0.033) Rehabilitation needs at present (ref: not have) Have 0.332* (0.008, 0.657) 0.587*** (0.250, 0.925) 0.567*** (0.235, 0.900) Annual household income per capita −0.512*** (−0.630, −0.394) −0.500*** (−0.618, −0.383) −0.447*** (−0.562, −0.331) Region of residence (ref: Eastern) Middle −1.067*** (−1.355, −0.779) −1.104*** (−1.394, −0.814) −0.929*** (−1.216, −0.641) Western −1.583*** (−1.928, −1.238) −1.563*** (−1.907, −1.219) −1.347*** (−1.691, −1.003) Northeastern 1.369*** (0.961, 1.777) 1.302*** (0.891, 1.713) 1.281*** (0.871, 1.692) Abbreviation: CI=confidence interval; ref=reference; SRD=subjective relative deprivation.
* P<0.05, ** P<0.01, *** P<0.001.Table 2. The associations between the utilization of rehabilitation services and SRD for the total sample (N=5,288).
Subgroup regression analyses and Chow tests were conducted to evaluate significant differences between groups (Table 3). By examining the significant results of the Chow test alongside the coefficients of the main explanatory variables, we observed that individuals with mild or moderate disability (β=–0.634, 95% CI: –1.070, –0.197, P=0.004), those with middle school education or higher (β=–0.850, 95% CI: –1.250, –0.450, P<0.001), and those residing in urban areas (β=–0.803, 95% CI: –1.370, –0.236, P=0.006) derived more substantial benefits from rehabilitation services utilization.
Variables Model 4
Sample split by severity of
disabilityβ (95% CI)Model 5
Sample split by education level
β (95% CI)Model 6
Sample split by residence
β (95% CI)Extremely severe
/severeModerate/mild Elementary school and below Middle school and above Urban Rural Rehabilitation services utilization (ref: no) Yes −0.471*
(−0.879,
−0.062)−0.634**
(−1.070,
−0.197)−0.209
(−0.655,
0.237)−0.850***
(−1.250,
−0.450)−0.803**
(−1.370,
−0.236)−0.492**
(−0.841,
−0.142)Covariates control control control Chow test 0.0363* 0.0001*** 0.0232* N 2,380 2,908 2,299 2,989 1,600 3,688 Abbreviation: CI=confidence interval; ref=feference; SRD=subjective relative deprivation; N=number of observations (sample size).
* P<0.05, ** P<0.01, *** P<0.001.Table 3. Subgroup regression results of the effect of rehabilitation services utilization on SRD (N=5,288).
As shown in Table 4, the KHB analysis revealed significant mediation effects in the full sample and in three subgroups: those with moderate/mild disability, those with middle school education or above, and those residing in urban areas.
Full sample/Subgroups Coefficient Standard Error Z P 95% CI Model 7: Full sample Reduced −0.581 0.150 −3.88 <0.001 (−0.874, −0.287) Full −0.537 0.150 −3.58 <0.001 (−0.830, −0.243) Diff −0.044 0.022 −2.01 0.045 (−0.087, −0.001) Model 8: Rural Reduced −0.489 0.176 −2.77 0.006 (−0.834, −0.143) Full −0.459 0.176 −2.60 0.009 (−0.804, −0.113) Diff −0.030 0.026 −1.14 0.253 (−0.082, 0.021) Model 9: Urban Reduced −0.809 0.286 −2.82 0.005 (−1.370, −0.248) Full −0.714 0.287 −2.49 0.013 (−1.276, −0.152) Diff −0.095 0.042 −2.28 0.023 (−0.176, −0.013) Model 10: Moderate/mild Reduced −0.636 0.220 −2.89 0.004 (−1.067, −0.205) Full −0.565 0.220 −2.57 0.01 (−0.997, −0.134) Diff −0.071 0.035 −2.00 0.045 (−0.140, −0.001) Model 11: Extremely severe/severe Reduced −0.466 0.207 −2.25 0.024 (−0.871, −0.060) Full −0.430 0.207 −2.08 0.038 (−0.835, −0.024) Diff −0.036 0.028 −1.28 0.201 (−0.092, 0.0193) Model 12: Middle school and above Reduced −0.850 0.202 −4.22 <0.001 (−1.245, −0.455) Full −0.788 0.202 −3.90 <0.001 (−1.183, −0.392) Diff −0.062 0.032 −1.97 0.049 (−0.124, −0.0002) Model 13: Elementary school and below Reduced −0.209 0.225 −0.93 0.353 (−0.651, 0.233) Full −0.187 0.225 −0.83 0.408 (−0.628, 0.255) Diff −0.023 0.029 −0.79 0.429 (−0.079, 0.034) Note: Reduced represents total effect, Full represents direct effect, and Diff represents indirect effect; Z=Coefficient ÷ Standard error.
Abbreviation: CI=confidence interval.
* P<0.05, ** P<0.01, *** P<0.001.Table 4. KHB mediation results in full sample and subgroups.
-
This study examined the association between rehabilitation services utilization and SRD among PWDs in China. Our findings indicate that rehabilitation services utilization is significantly associated with lower levels of SRD. Further analysis revealed that economic participation serves as a significant mediator in this relationship. Moreover, the impact of rehabilitation services on SRD is significantly stronger for PWDs with mild and moderate disabilities, those with at least a middle school education, and those residing in urban areas. The mediation effects were also more pronounced in these three subgroups.
Rehabilitation services play a crucial role in reducing SRD among PWDs. By targeting specific functional areas that need improvement, these services help PWDs reduce their dependence on others and achieve greater independence, thereby alleviating SRD. Rehabilitation therapists assess individual needs and goals to develop personalized rehabilitation plans tailored to each person’s circumstances. According to social support theory, such individualized services enhance PWDs’ sense of participation and control over their lives, fostering feelings of value and inclusion in society. The care and encouragement received during interactions with rehabilitation therapists can positively impact PWDs’ psychological well-being (6).
Furthermore, rehabilitation services facilitate economic participation among PWDs. Rehabilitation serves as a pathway to inclusion and promotes equal opportunities in daily life (7). Consequently, this reduces barriers that PWDs encounter in the labor market, expanding their economic opportunities and resulting in positive psychological experiences.
Economic participation itself can reduce SRD among PWDs. By enabling PWDs to achieve a degree of financial independence, economic participation reduces their reliance on family support or government welfare, thereby lowering their stress levels. Beyond its economic benefits, employment provides a platform for PWDs to establish meaningful connections with colleagues, enhancing their formal social relationships. Interactions with co-workers can help alleviate social isolation and increase social capital among PWDs (8).
Furthermore, our analysis revealed significant heterogeneity in the effects of rehabilitation services. Regarding disability severity, individuals with milder disabilities experienced greater reductions in SRD after receiving rehabilitation services. This finding can be attributed to their better physiological condition, which enables them to more readily reintegrate into economic activities with rehabilitation support (9). Consequently, these individuals experience substantial improvements across multiple aspects of their lives. In contrast, those with more severe disabilities may face persistent challenges in achieving normal living conditions due to the extent of their physiological impairments.
PWDs with higher education levels demonstrated significantly reduced SRD after utilizing rehabilitation services. These individuals possess a greater capacity to perceive and cope with their disabilities rationally, as well as to integrate information to identify appropriate rehabilitation resources, thereby improving their disadvantaged situation (10). Additionally, higher-educated individuals who benefit from rehabilitation services are more likely to participate in economic activities and secure income. Although PWDs with lower education levels can also improve their physical condition through rehabilitation services, they encounter more substantial challenges regarding employer recognition of their abilities and skills.
Rehabilitation services utilization has a more significant impact on reducing SRD among PWDs living in urban areas, as they face greater vulnerability. Limited job opportunities and high employment competition make economic participation particularly challenging for urban PWDs. By receiving rehabilitation services and improving their physiological functions, urban PWDs can substantially enhance both their economic participation and reduce SRD. In contrast, PWDs in rural areas often possess land assets and experience less economic pressure than their urban counterparts, which may explain the limited impact of rehabilitation services in rural settings.
This study has several limitations. First, individuals with extremely severe intellectual and mental disabilities were excluded from our sample, limiting the applicability of our conclusions to this population. Second, we considered only economic participation as a mediating variable; other potential mechanisms, such as social participation were not explored due to data limitations. Finally, the cross-sectional nature of our data presents inherent endogeneity challenges. Future research with follow-up investigations is planned, contingent upon funding availability.
In conclusion, to reduce SRD among PWDs, policymakers should prioritize enhancing access to rehabilitation services and economic participation, with particular attention to individuals with mild to moderate disabilities, better education, and urban residence. Furthermore, since SRD represents a negative subjective experience that may lead to additional mental health issues, professional mental health support should be provided to prevent these secondary problems among PWDs.
-
According to the Measures for Ethical Review of Life Science and Medical Research Involving Human Beings (https://www.gov.cn/zhengce/zhengceku/2023-02/28/content_5743658.htm), our data sources are administrative data and have been anonymized. Therefore, ethical review is waived.
HTML
| Citation: |

|