
 Download:


-
Introduction: Prediabetes is a well-established risk factor for type 2 diabetes development. While existing risk prediction models primarily focus on the general adult population, those specifically designed for older adults remain scarce. This study aimed to develop and validate a 3-year risk prediction model for type 2 diabetes specifically for older adults with prediabetes.
Methods: Data were derived from the Health Aging Evaluation Longitudinal Survey (HAELS), which included 1,127 older adults with prediabetes defined by FPG between 5.6–7.0 mmol/L at baseline (2019). Incident diabetes was defined as FPG ≥7.0 mmol/L at 3-year follow-up (2022). A multivariable Cox proportional hazards regression model with stepwise variable selection was used to identify predictors and construct the prediction model. Bootstrapping was employed for internal validation. Model performance was evaluated using area under the receiver operating characteristic curve (AUC), calibration plots, and decision curve analysis (DCA). A nomogram was constructed to visualize individualized risk.
Results: Seven predictors were included in the final model: age, physical activity, waist circumference, baseline FPG, triglycerides, systolic blood pressure, and dessert intake. The model demonstrated good discrimination (AUC=0.752 in the training dataset, 0.793 in the validation dataset) and satisfactory calibration. DCA indicated a net clinical benefit within a threshold probability range of 0.02–0.50.
Conclusion: This model, demonstrating good predictive performance and clinical utility, provides a simple and practical tool to estimate the 3-year diabetes risk in older adults with prediabetes.
-
Progression from prediabetes to type 2 diabetes represents a significant public health challenge. While numerous prediction models exist for general adult population, research specifically addressing older adults remains limited. This study aimed to develop and validate a risk prediction model tailored specifically to older adults with prediabetes defined by fasting plasma glucose (FPG). Using data from the Health Aging Evaluation Longitudinal Survey (HAELS) in China, we employed Cox proportional hazards regression to identify key predictors of diabetes progression. The resulting model demonstrated strong discrimination and good calibration, providing a practical tool for identifying high-risk individuals. Public health practitioners should prioritize interventions targeting these high-risk older adults to optimize healthcare resource utilization and reduce the future clinical burden of diabetes in aging populations.
The HAELS was initiated in 2019 (1) and included a representative sample of 4,690 individuals aged 65 and older from six provinces; 3,782 participants were followed up in 2022. Baseline prediabetes was defined as a FPG level of 5.6–7.0 mmol/L according to the American Diabetes Association (ADA) criteria (2), yielding a final sample of 1,127 individuals with prediabetes after excluding participants with missing key variables. Incident type 2 diabetes was defined as an FPG level of 7.0 mmol/L or higher. The date corresponding to the diagnosis of incident diabetes was defined as the event date; individuals not meeting the criteria for diabetes were censored on the date of their last FPG test, loss to follow-up, or death.
Potential candidate predictors were initially selected based on prior research findings, biological plausibility, and clinical relevance. These comprised demographic factors (age, sex, ethnicity, education level), lifestyle behaviors (drinking, exercise), baseline metabolic indicators (systolic blood pressure, waist circumference, fasting plasma glucose, triglycerides, high-density lipoprotein (HDL) cholesterol, and dietary factors (vegetable intake, red meat intake, dessert intake, and dietary frequency). Multivariate Cox proportional hazards regression models were fitted to identify prediction variables using stepwise selection with significance level for entry (SLE) and significance level for stay (SLS) both set at 0.1.
In this study, the validation dataset was generated using bootstrap resampling. Specifically, for each iteration, a bootstrap sample was drawn from the original data with replacement, forming the validation dataset (test-data). This process was repeated for N=2 iterations to obtain multiple resampled datasets. The area under the receiver operating characteristic curve (AUC) was used to assess discriminative ability. Calibration curves were plotted to assess the model's accuracy. Decision curves were used to evaluate the clinical utility of the model. SAS (version 9.4; SAS Institute, Cary, NC, USA) and R (version 4.3.3; R Foundation for Statistical Computing, Vienna, Austria) were used, and P<0.05 was considered statistically significant.
Of the 1,127 participants diagnosed with prediabetes in the 2019 baseline survey, 896 completed the 2022 follow-up, comprising 43.42% males and 56.58% females. A total of 107 individuals developed diabetes during the follow-up period. As shown in Table 1, the mean age of participants was 72.22 years, with 45.34% being male. Compared to participants without incident diabetes, those who developed diabetes were slightly younger and had significantly higher systolic blood pressure (SBP), waist circumference, fasting plasma glucose (FPG), and triglycerides (TG) (P<0.05).
Characteristic Overall (n=1,127) Incident Diabetes Status P Diabetes (n=107) Non-diabetes (n=1,020) Age (years) [mean (SD)] 72.22 (5.87) 71.01 (5.07) 72.35 (5.94) 0.0250 Gender [n (%)] 0.6076 Male 511 (45.34) 46 (42.99) 465 (45.59) Female 616 (54.66) 61 (57.01) 555 (54.41) Education [n (%)] 0.3470 0 286 (25.38) 26 (24.30) 260 (25.49) 1–6 years 488 (43.30) 53 (49.53) 435 (42.65) >6 years 353 (31.32) 28 (26.17) 325 (31.86) Han Nationality [n (%)] 0,9188 No 289 (25.64) 27 (25.23) 262 (25.69) Yes 838 (74.36) 80 (74.77) 758 (74.31) Alcohol drinking [n (%)] 275 (24.40) 21 (19.63) 254 (24.90) 0.2267 Smoking [n (%)] 248 (22.01) 25 (23.36) 223 (21.86) 0.7273 Exercise [n (%)] 669 (59.36) 57 (53.27) 612 (60.00) 0.1776 SBP [mean (SD)] 135.08 (16.53) 138.46 (16.83) 134.72 (16.47) 0.0260 Waist circumstance [mean (SD)] 86.55 (9.91) 88.75 (9.26) 86.32 (9.95) 0.0156 FPG [mean (SD)] 6.07 (0.36) 6.20 (0.37) 6.06 (0.36) 0.0002 TG [mean (SD)] 1.62 (1.08) 2.02 (1.66) 1.58 (0.99) 0.0001 HDL [mean (SD)] 1.48 (0.65) 1.49 (0.73) 1.48 (0.64) 0.8614 Vegetable [n (%)] 77 (6.83) 5 (4.67) 72 (7.06) 0.3521 Red meat [n (%)] 845 (74.98) 83 (77.57) 762 (74.71) 0.5152 Dessert [n (%)] 951 (84.38) 94 (87.85) 857 (84.02) 0.2990 Note: Categorical variables were shown as n (%) and continuous variables were shown as the mean (SD).
Abbreviation: SBP=systolic blood pressure, FPG=fasting plasma glucose; TG=triglycerides; HDL=high-density lipoprotein cholesterol; SD=standard deviation.Table 1. Baseline characteristics of the participants by incident diabetes status during 3-year follow-up among Chinese older adults aged 65 years with prediabetes over 2019–2022. (n=1,127)
Multivariable Cox proportional hazards regression identified seven variables as significant predictors of progression from prediabetes to diabetes: age, exercise status (yes or no), waist circumference, baseline FPG, triglycerides, systolic blood pressure, and dessert intake frequency (high or low). The derived prediction formula was:
$$ \begin{aligned} & \mathrm{Log(Hazard)= -0.7077 \times Exercise(yes)+0.0104} \;\times \\ & {\mathrm{SBP-0.0345\times Age+0.0186\times Waist+0.1933\; \times}}\\ & {\mathrm{TG+0.5859\times FPG+0.5622\times Dessertintake(high)}}. \end{aligned}$$ Based on these regression results, we constructed a nomogram to predict the 3-year risk of progression from prediabetes to diabetes (Figure 1). In this nomogram, each predictor variable corresponds to a specific point score, and the total score is calculated by summing the scores across all seven indicators. A vertical line drawn downward from the total score intersects with the “probability of diabetes occurrence” scale, indicating the 3-year risk of progression. Exercise was identified as a protective factor associated with lower risk, while higher values of systolic blood pressure, waist circumference, triglycerides, FPG, and frequent dessert consumption were all associated with increased risk.
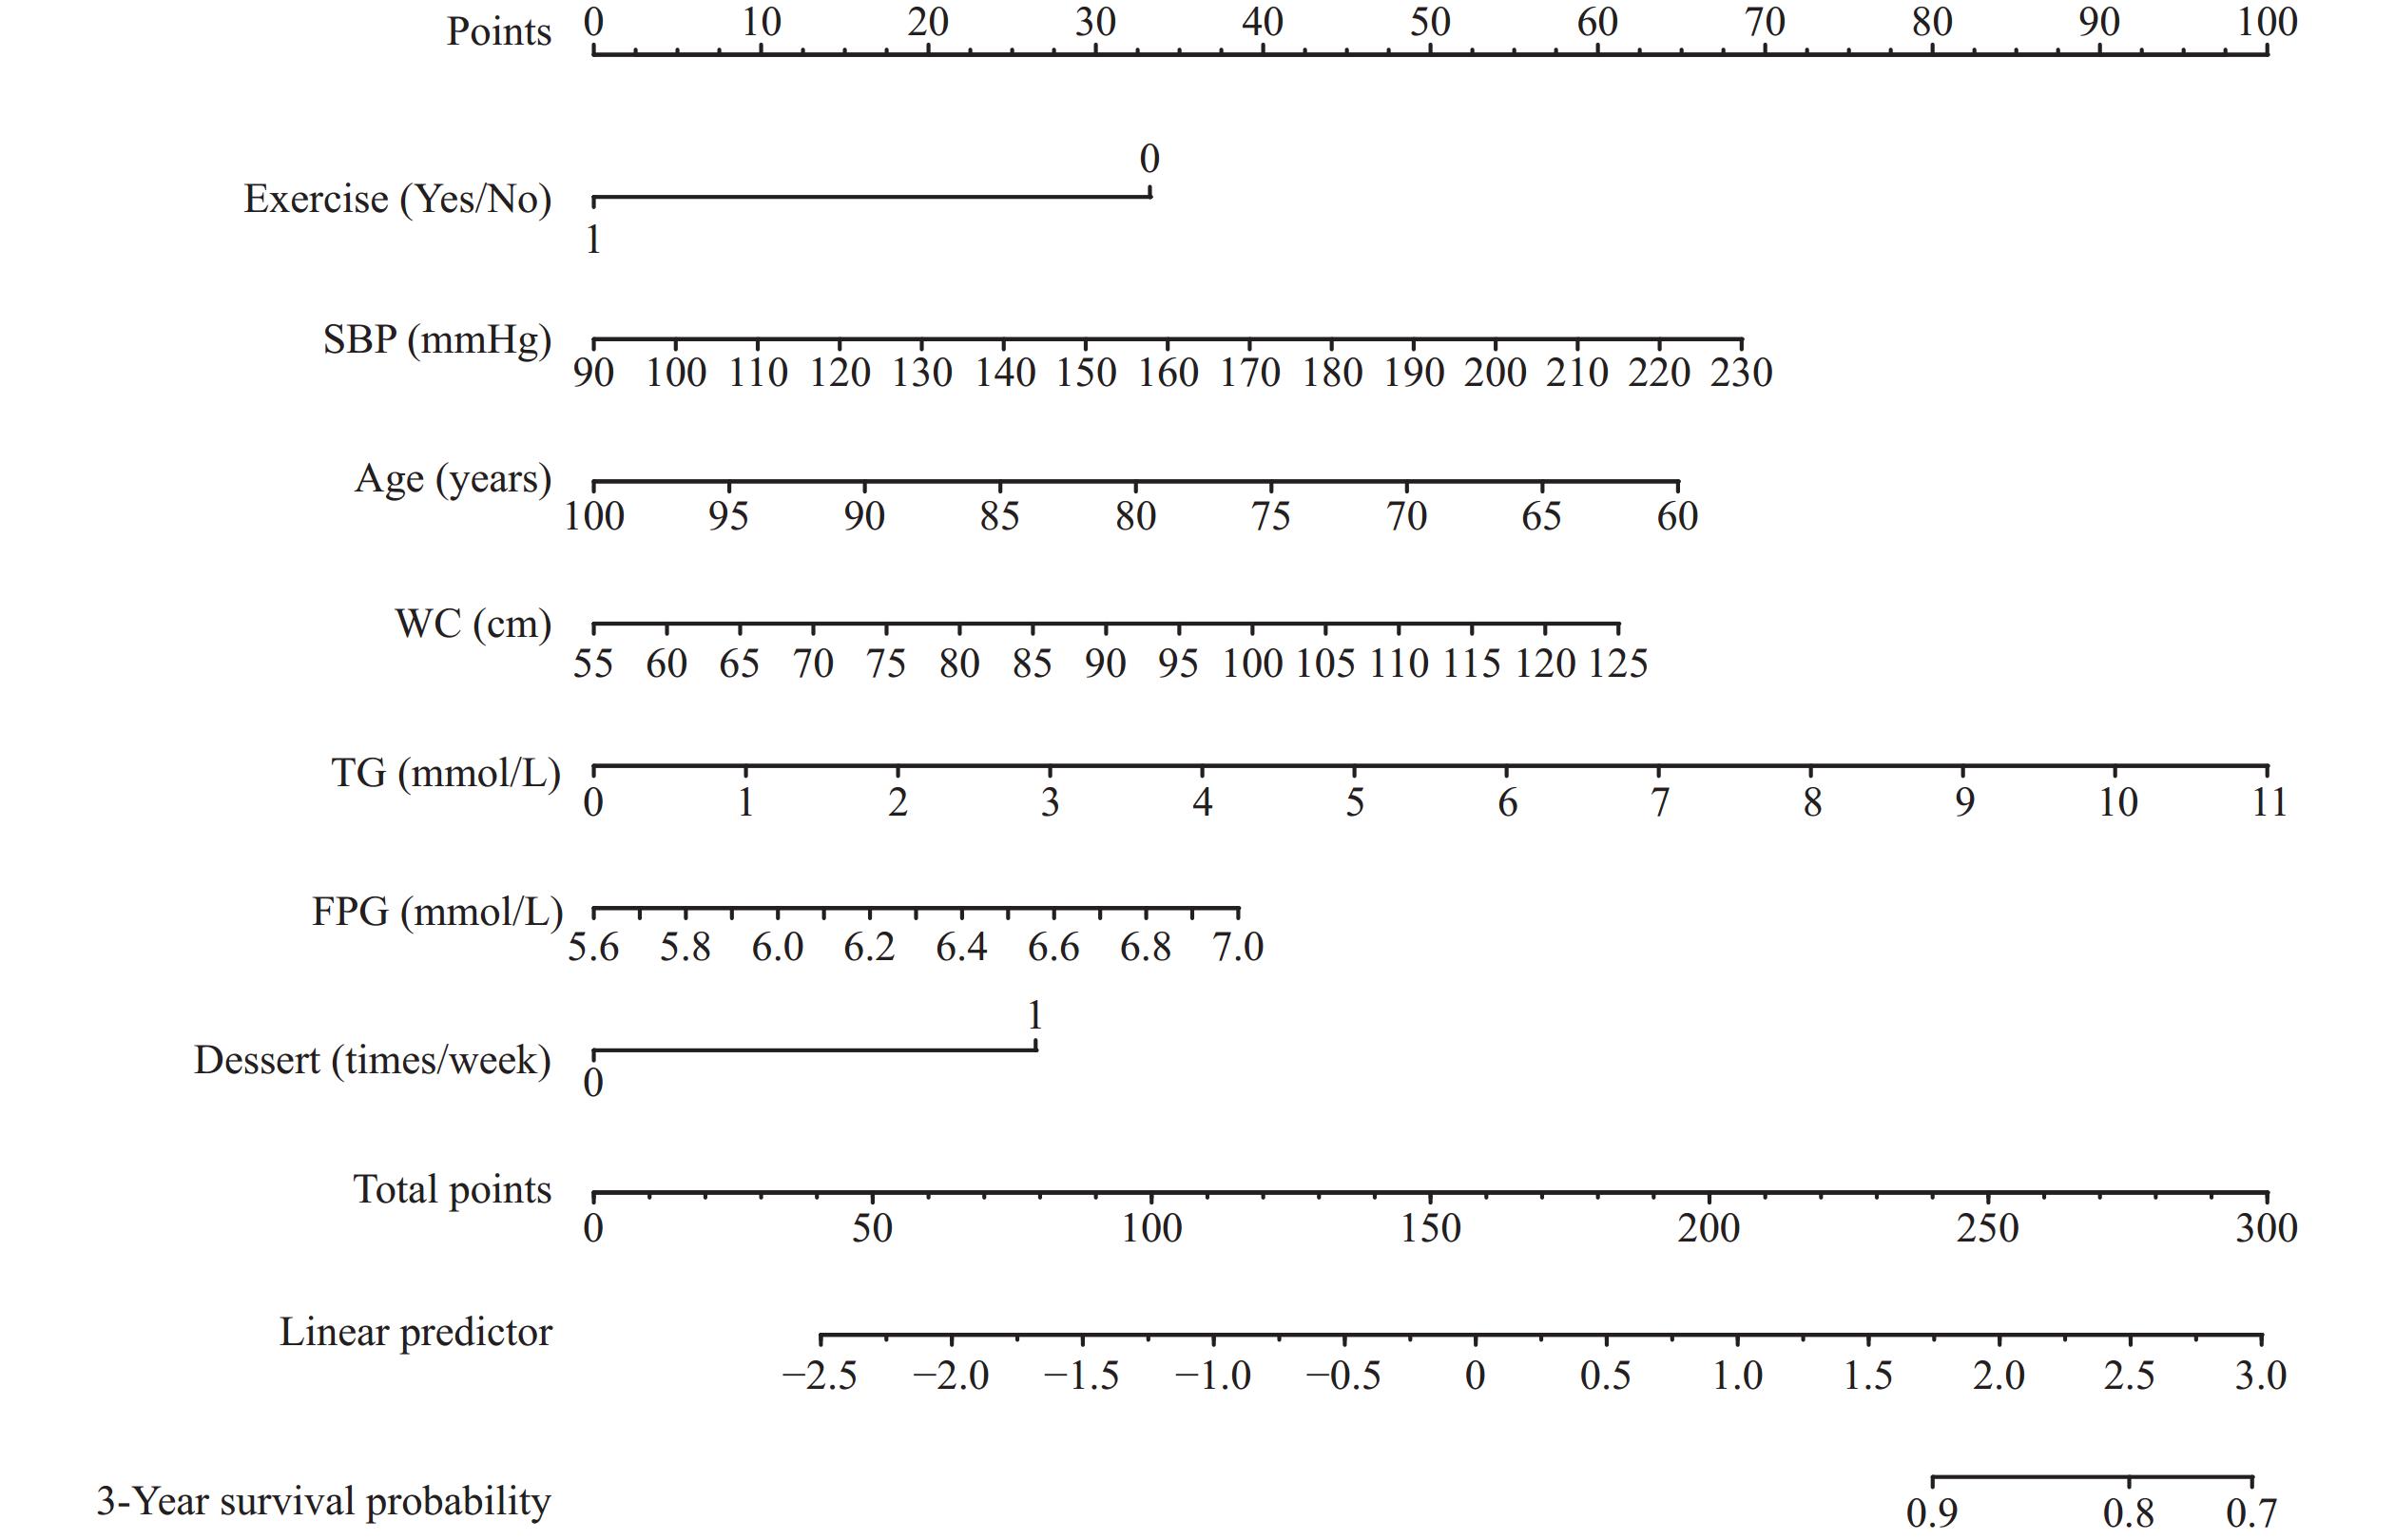 Figure 1.
Nomogram for predicting the 3-year risk of progression from prediabetes to type 2 diabetes among older adults.
Note: The nomogram assigns point values to seven predictors: exercise status (Yes/No), SBP, age, WC, TG, FPG, and dessert intake frequency. By summing the individual scores and locating the total score on the "Total Points" axis, the corresponding 3-year survival probability (non-progression) can be estimated at the bottom scale.
Abbreviation: SBP=systolic blood pressure; WC=waist circumference; TG=triglycerides; FPG=fasting plasma glucose.
Evaluation of the 3-year risk prediction model demonstrated strong discriminatory ability, with AUC values of 0.752 and 0.793 for the training and validation sets, respectively (Figure 2A and 2B). The calibration curves for both sets closely approximated the diagonal line, indicating excellent agreement between predicted probabilities and actual outcomes (Figure 2C and 2D). Decision curve analysis revealed positive clinical net benefit across both sets, with curves consistently positioned above both the treat-all and treat-none reference lines within a threshold probability range of 0.02–0.5 (Figure 2E and 2F).
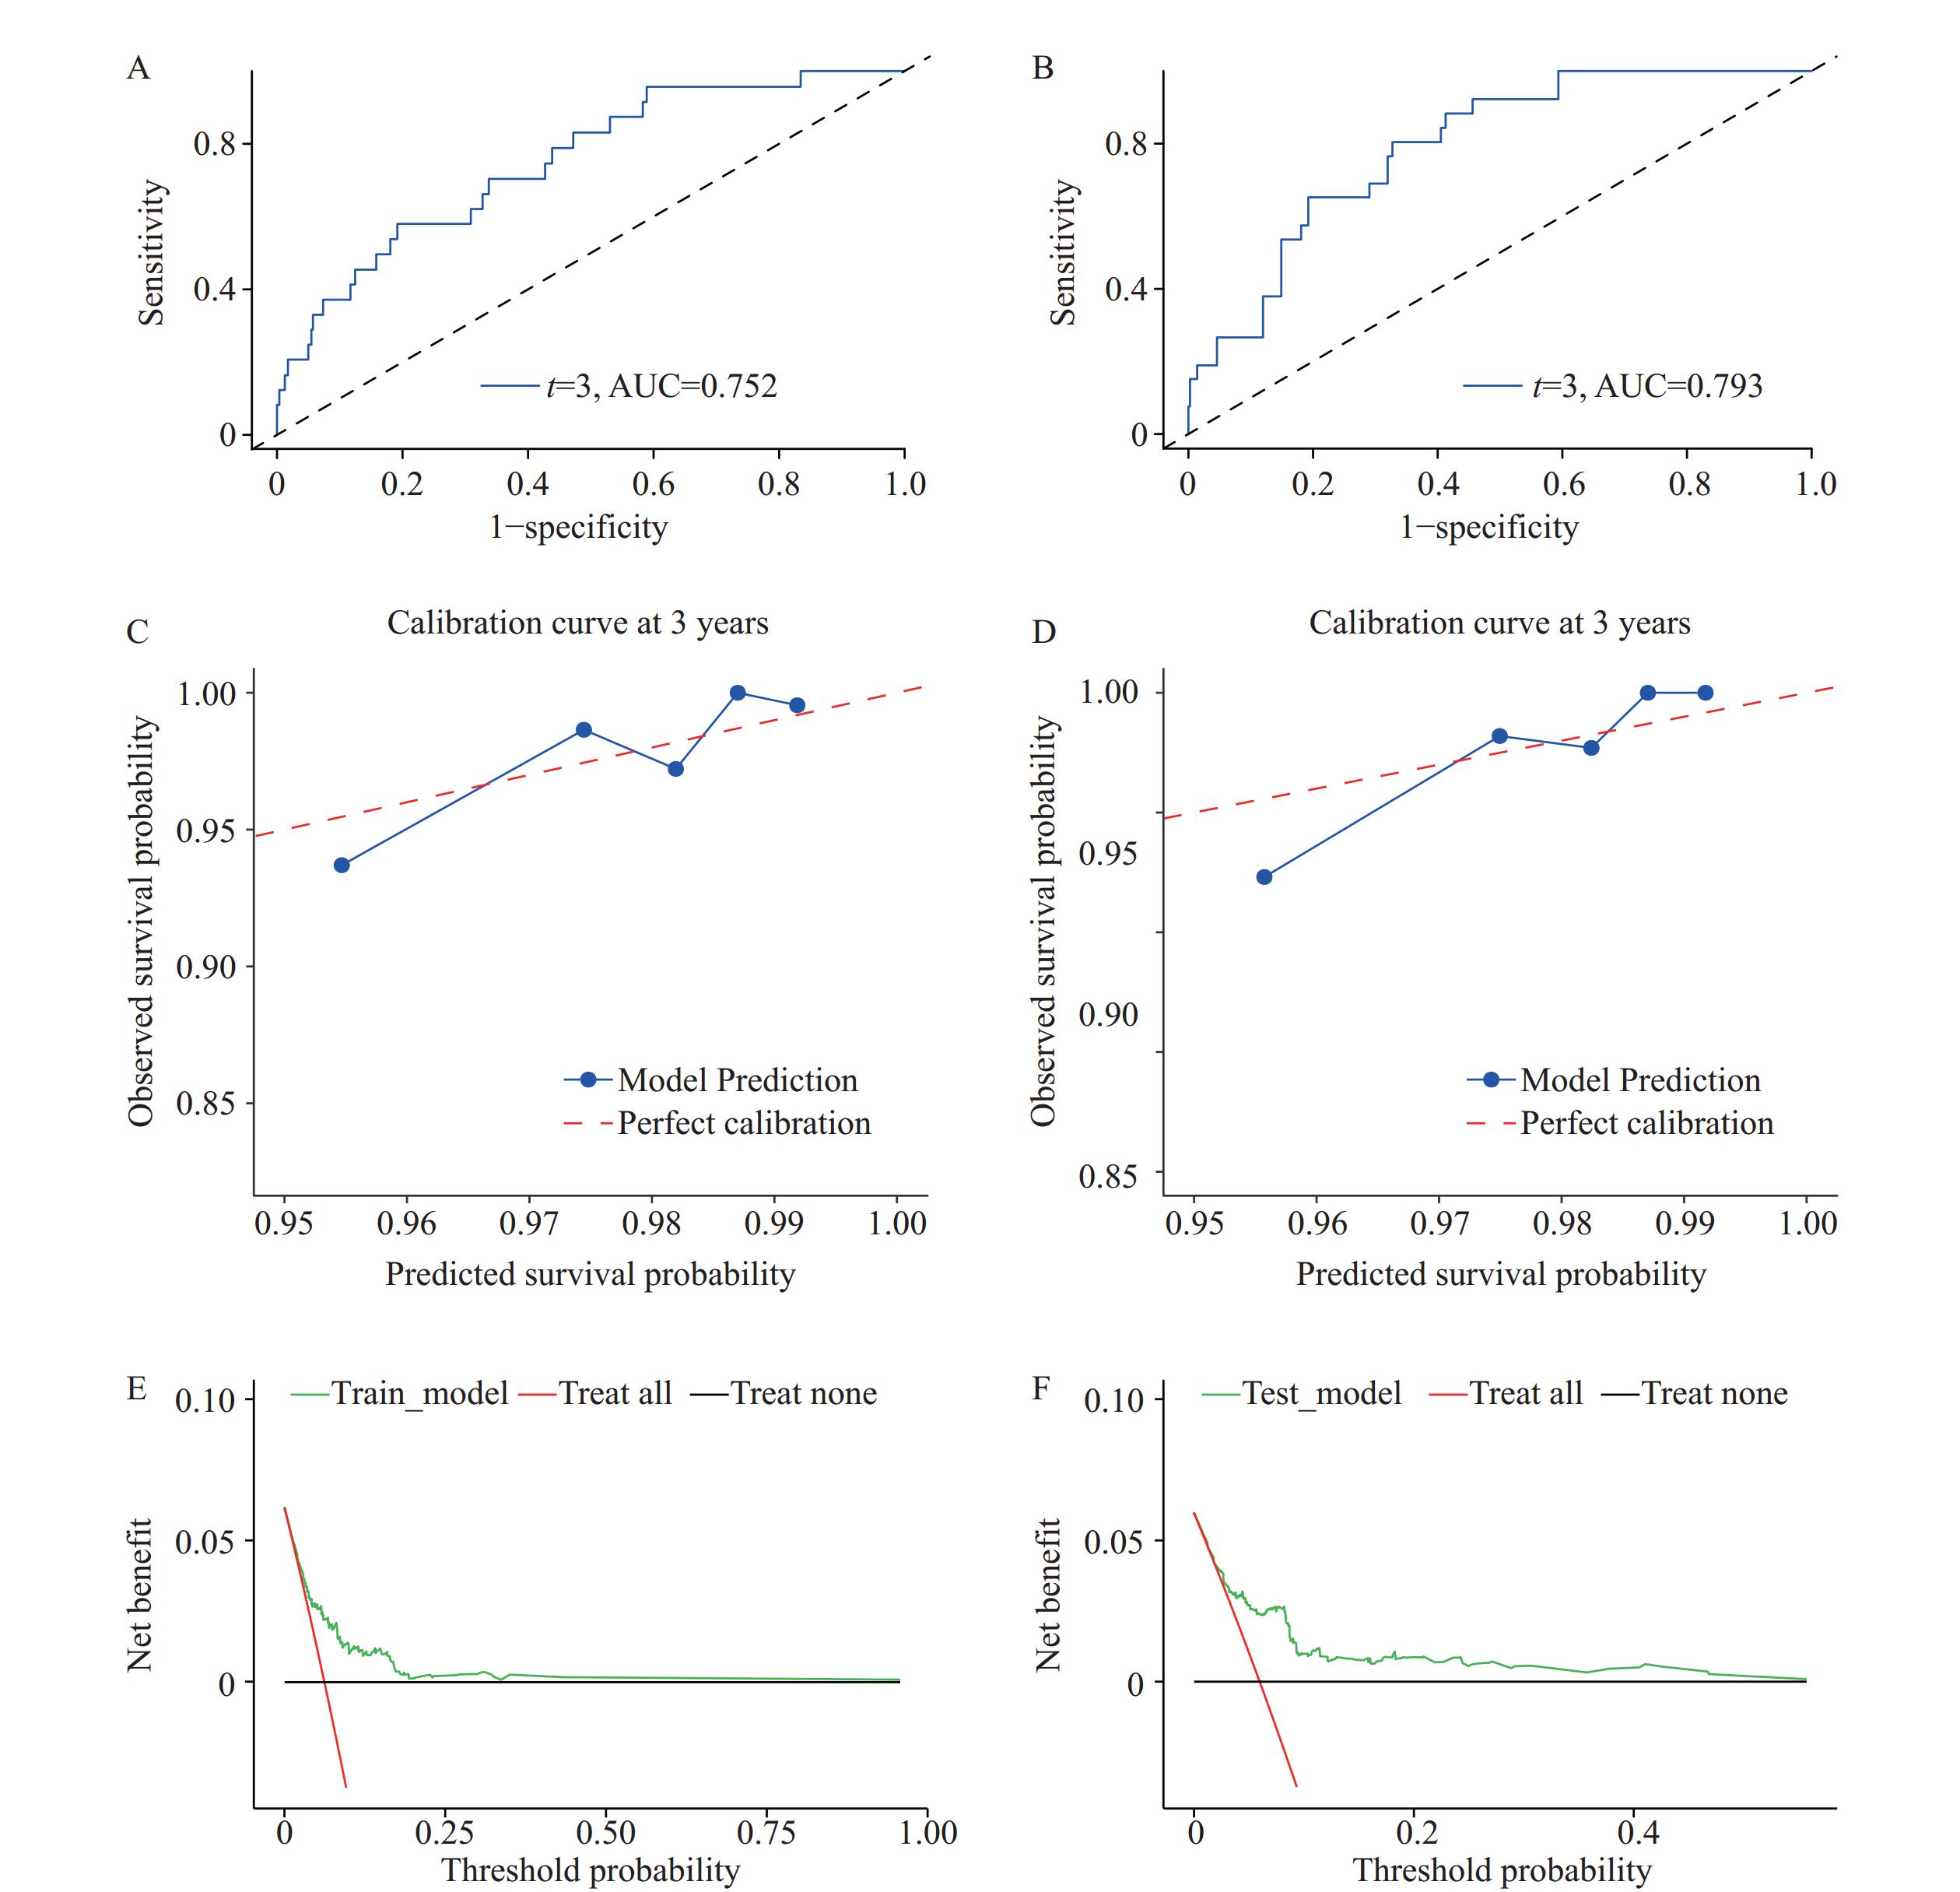 Figure 2.
Evaluation Graphs of the 3-Year Risk Prediction Model for Type 2 Diabetes in Older Adults with Prediabetes. (A) ROC Curve for the Training Set; (B) ROC Curve for the Validation Set; (C) Calibration Curve for the Training Set; (D) Calibration Curve for the Validation Set; (E) Decision Curve for the Training Set; (F) Decision Curve for the Validation Set.
-
This study developed a novel prediction model to identify older adults at high risk of progression from prediabetes defined by FPG, which, to our knowledge, is the first to specifically address progression in older adults with prediabetes. Our findings indicate that age, exercise, waist circumference, baseline FPG, TG, SBP, and dessert intake are the strongest predictors of progression to diabetes. The model demonstrates good discriminatory ability, satisfactory accuracy, and strong clinical applicability. These findings align with previous research showing that lifestyle factors such as physical activity and diet, along with metabolic parameters including abnormal blood glucose and TG levels, are important predictors of type 2 diabetes development (3–5).
In this study, we developed a predictive model using Cox proportional hazards regression, incorporating easily obtained variables. We evaluated the model's performance in terms of discrimination, calibration, and clinical utility, and established a risk score to facilitate practical application. Several models predicting the progression from prediabetes to diabetes have been previously reported. However, some were based on logistic regression rather than Cox proportional hazards modeling (6), while others did not perform decision curve analysis to assess clinical applicability or failed to evaluate model accuracy (7). Additionally, some models included an excessive number of predictors (8), or relied on 2-hour postprandial blood glucose and hemoglobin A1c (HbA1c), which are less readily available, potentially limiting generalizability. The decision curve analysis showed that our model provided greater net benefit than treating all or none across a threshold probability range of approximately 0.02 to 0.5, supporting its utility in guiding early preventive interventions for older adults with prediabetes.
Notably, most existing models have been developed for the general adult population, while predictive models specifically for progression from prediabetes to diabetes in older adults remain scarce. Although prediabetes is more prevalent in the older adult population, previous studies suggest that progression to diabetes is relatively uncommon in this demographic (9–10). Consequently, implementing broad interventions for all older adults with prediabetes may not be cost-effective. Our model helps identify older adults at high risk of progression to diabetes, enabling more targeted and efficient intervention and allocation of medical resources.
This study has several limitations. First, the model does not account for certain risk factors, such as genetic predisposition (e.g., family history of diabetes). Second, diabetes was defined based on FPG ≥7.0 mmol/L rather than HbA1c levels or the 2-hour oral glucose tolerance test, which may have led to an underestimation of diabetes incidence. However, FPG was chosen for its practicality and cost-effectiveness. Third, the model has undergone only internal validation, and further external validation using independent cohort data is needed to enhance its predictive accuracy.
In conclusion, we developed and validated a risk prediction model for the 3-year progression from prediabetes to diabetes based on FPG in an older adult population. This model can inform targeted interventions and help avoid unnecessary utilization of medical resources.
-
The HAELS study was approved by the Ethics Committee of the Chinese Center for Disease Control and Prevention. Written informed consent was obtained from all participants (or their proxies).
HTML

| Citation: |

|