
 Download:


-
Objectives: To investigate the associations of the triglyceride-glucose (TyG) index in different trimesters and its trajectories with the risk of large for gestational age (LGA).
Methods: A prospective cohort study was conducted including 46,236 singleton pregnant women who received regular antenatal care and delivered at Beijing Obstetrics and Gynecology Hospital, Capital Medical University between 2018 and 2022. Neonates were categorized into the LGA group (n=9,138) and the non-LGA group (n=37,098) based on birthweight. Pregnant women were stratified into high TyG (≥75th percentile) and low TyG (<75th percentile) groups based on their TyG index in each trimester. TyG trajectories across pregnancy were identified using group-based trajectory modeling with a quadratic polynomial function. Binary logistic regression was used to evaluate the associations between TyG levels, TyG trajectories, and LGA.
Results: In all three trimesters, the TyG index was significantly higher in the LGA group than in the non-LGA group. High TyG levels were associated with increased risks of LGA by 15%, 34%, and 80% in the first, second, and third trimesters, respectively. Four TyG trajectories were identified: consistently low, low-to-high, high-to-low, and consistently high. Compared with the consistently low group, the low-to-high [adjusted odds ratio (aOR)=1.37, 95% confidence interval (CI): 1.20, 1.56] and consistently high (aOR=1.29, 95% CI: 1.22, 1.37) groups showed significantly increased risks of LGA, whereas no significant association was observed in the high-to-low group (aOR=0.98, 95% CI: 0.91, 1.05).
Conclusions: Elevated TyG levels throughout pregnancy were associated with an increased risk of LGA. Maternal TyG levels may serve as a potential biomarker for excessive fetal growth. Monitoring and optimizing TyG levels during pregnancy, particularly from the first trimester onward, may contribute to lowering the risk of LGA, although interventional studies are needed to further verify this association.
-
Large for gestational age (LGA), defined as a birth weight above the 90th percentile for infants of the same sex and gestational age (1), is associated with significant maternal and neonatal risks, including higher rates of cesarean delivery, postpartum hemorrhage, shoulder dystocia, and long-term complications such as obesity, dysglycemia, and psychiatric disorders (2-4). Early prevention of LGA is essential for improving maternal and neonatal outcomes. The triglyceride-glucose (TyG) index, a marker of insulin resistance (IR) derived from fasting blood glucose (FBG) and triglycerides (TG) (5), has been associated with LGA risk in early pregnancy (6-8). However, the association between the TyG index across all trimesters and its trajectories with LGA remains unexplored. This prospective cohort study, using data from the Beijing Birth Cohort Study (BBCS) collected between 2018 and 2022, investigated the relationship between TyG index levels across all three trimesters and its trajectories with LGA. The analysis of 46,236 singleton pregnancies found a positive association between TyG index in each trimester and LGA risk. Managing the TyG index may help reduce this risk. These findings underscore the importance of monitoring the TyG index throughout pregnancy and implementing targeted interventions for LGA prevention and early detection. A graphical summary of the study design and key results is provided in
Supplementary Figure S1 .The study initially included 62,862 pregnant women who established maternal and child health records and received routine antenatal check-ups at Beijing Obstetrics and Gynecology Hospital between 2018 and 2022. Exclusion criteria included age <18 or >45 years, multiple pregnancies, gestational age <28 weeks, pre-pregnancy diabetes or hypertension, and missing data. The final sample size for analysis was 46,236, as shown in
Supplementary Figure S2 . Ethical approval was obtained from the Beijing Obstetrics and Gynecology Hospital Ethics Committee (2018-ky-009-01), and informed consent was provided by all participants. Fasting blood lipids, including TG, total cholesterol (TC), high-density lipoprotein cholesterol (HDL-C), and low-density lipoprotein cholesterol (LDL-C), as well as FBG, were measured in the first (7–13 weeks), second (24–28 weeks), and third trimesters (32–36 weeks). The TyG index was calculated as ln [TG (mg/dL) × FBG (mg/dL)/2]. Pre-pregnancy weight and height were recorded at the first antenatal visit, with pre-pregnancy body mass index (BMI) calculated as weight (kg) / height2 (m2). Gestational weight gain (GWG) was defined as the difference between pre-delivery and pre-pregnancy weight. Medical history, including diabetes, hypertension, and family history, was collected at the first prenatal visit. Gestational diabetes mellitus (GDM) was diagnosed via the oral glucose tolerance test (OGTT) at 24–28 weeks if any of the following criteria were met: fasting glucose ≥5.1 mmol/L, 1-hour glucose ≥10.0 mmol/L, or 2-hour glucose ≥8.5 mmol/L. Delivery details, including gestational age and birth weight, were obtained from electronic medical records.Continuous variables with normal distribution were compared using t tests and presented as mean±SD. Categorical variables were compared using the chi-square test and expressed as counts (n) and percentages (%). Participants were categorized into high (TyG ≥75th percentile) and low (TyG <75th percentile) groups. TyG trajectories across trimesters were modeled using a group-based trajectory model with a quadratic polynomial. The optimal number of classes was determined based on clinical relevance and the Bayesian information criterion. Binary logistic regression analyses assessed the association between the TyG index, its trajectories, and LGA. Stratified analyses were conducted by age, pre-pregnancy BMI, parity, and GDM status. All analyses were performed using SPSS (version 26, IBM, Armonk, New York, USA) and SAS (version 9.4; SAS Institute), with statistical significance set at a two-sided P<0.05.
A total of 46,236 pregnant women were included, with 9,138 delivering LGA infants and 37,098 delivering non-LGA infants. The LGA group exhibited higher maternal age, pre-pregnancy BMI, GWG, GDM incidence (18.57% vs. 15.37%), and TyG index values across all trimesters (
Supplementary Table S1 ). The 75th percentile of the TyG index in the first, second, and third trimesters were 8.47, 9.17, and 9.44, respectively. Binary logistic regression analysis showed that, without adjustment for confounders, the high TyG group had a 32% increased risk of LGA in the first trimester, 34% in the second trimester, and 48% in the third trimester. After adjusting for maternal age, gravidity, parity, gestational age, pre-pregnancy BMI, GWG, and GDM, the risk of LGA remained elevated, with a 9% increase in the first trimester [adjusted odds ratio (aOR)=1.09, 95% CI: 1.03, 1.15], 16% in the second trimester (aOR=1.16, 95% CI: 1.07, 1.25), and 36% in the third trimester (aOR=1.36, 95% CI: 1.28, 1.44) (Table 1). Further analysis categorized women into four TyG trajectories: consistently low (n=28,686), low-to-high (n=1,461), high-to-low (n=5,998), and consistently high (n=10,091) (Supplementary Figure S3 ). Compared to the consistently low group, the risk of LGA increased by 51% in the low-to-high group and 53% in the consistently high group (OR=1.51 and 1.53; 95% CI: 1.30, 1.77 and 1.43, 1.64, respectively). After adjusting for maternal age, gravidity, parity, gestational age, pre-pregnancy BMI, GWG, and GDM, the risk of LGA remained significantly higher, with a 37% increase in the low-to-high group and a 29% increase in the consistently high group (aOR=1.37 and 1.29; 95% CI: 1.20, 1.56 and 1.22, 1.37, respectively). The high-to-low group showed a slight increase in LGA risk in the unadjusted model (OR=1.12; 95% CI: 1.02, 1.23), but this association was no longer significant after adjusting for confounders (aOR=0.98; 95% CI: 0.91, 1.05) (Table 2). Subgroup analyses presented in Figure 1 revealed that high TyG levels were associated with higher LGA risk across subgroups defined by age, parity, pre-pregnancy BMI, and GDM status. Notably, the high-to-low trajectory group showed no significant increase in LGA risk. In women with GDM, the risk of LGA was 21.35%, 25.52%, 23.28%, and 25.73% for the consistently low, low-to-high, high-to-low, and consistently high groups, respectively. Women with GDM and high TyG levels showed a notably increased risk of LGA (aOR 1.49–2.41).TyG index LGA n (%) Crude OR (95% CI) Adjusted OR (95% CI)* First trimester TyG per unit increase 1.47 (1.39, 1.55) 1.15 (1.08, 1.22) Low 6,473 (18.62) Reference Reference High 2,665 (23.25) 1.32 (1.26, 1.39) 1.09 (1.03, 1.15) Second trimester TyG per unit increase 1.68 (1.54, 1.82) 1.34 (1.56, 1.87) Low 3,475 (18.95) Reference Reference High 1,457 (23.83) 1.34 (1.25, 1.44) 1.16 (1.07, 1.25) Third trimester TyG per unit increase 2.02 (1.89, 2.16) 1.80 (1.68, 1.93) Low 5,745 (18.35) Reference Reference High 2,572 (24.91) 1.48(1.40, 1.56) 1.36 (1.28, 1.44) Abbreviation: LGA=large for gestational age; TyG=triglyceride-glucose index; OR=odds ratio; CI=confidence interval.
* Multivariable logistic regression model adjusted for maternal age, gravidity, parity, gestational age, pre-pregnancy body mass index, gestational weight gain, and gestational diabetes mellitus.Table 1. Logistic regression analysis of the association between the TyG index and LGA in pregnant women receiving perinatal care at Beijing Obstetrics and Gynecology Hospital during 2018–2022.
TyG trajectories n LGA n (%) Crude OR (95% CI) Adjusted OR (95% CI)* Trajectory 1 28,686 5,104 (17.79) Reference Reference Trajectory 2 1,461 340 (23.27) 1.51 (1.30, 1.77) 1.37 (1.20, 1.56) Trajectory 3 5,998 1,218 (20.31) 1.12 (1.02, 1.23) 0.98 (0.91, 1.05) Trajectory 4 10,091 2,476 (24.54) 1.53 (1.43, 1.64) 1.29 (1.22, 1.37) Abbreviation: LGA=large for gestational age; TyG=triglyceride-glucose index; OR=odds ratio; CI=confidence interval.
* Multivariable logistic regression model, adjusted for maternal age, gravidity, parity, gestational age, pre-pregnancy body mass index, gestational weight gain, and gestational diabetes mellitus.Table 2. Logistic regression analysis of the association between TyG trajectories and LGA in pregnant women receiving perinatal care at Beijing Obstetrics and Gynecology Hospital during 2018–2022.
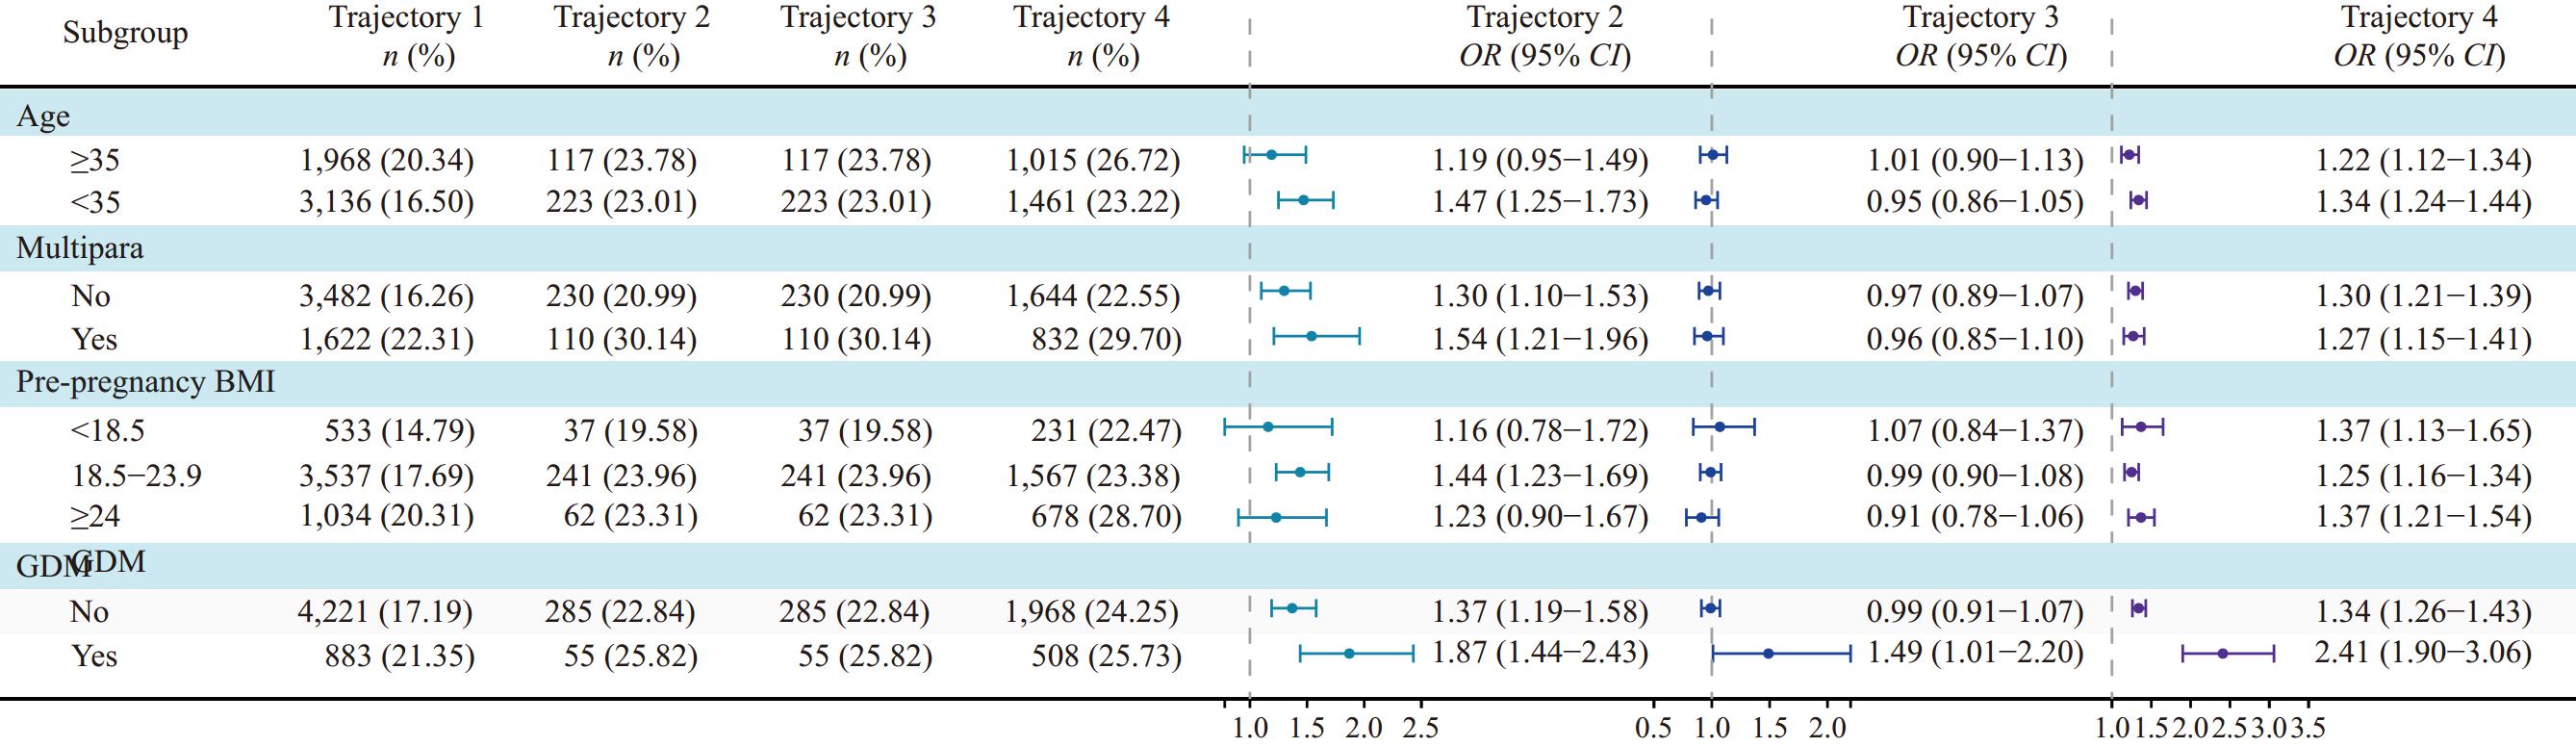 Figure 1.
Subgroup analysis of TyG trajectories and their association with LGA in pregnant women receiving perinatal care at Beijing Obstetrics and Gynecology Hospital during 2018–2022.
Note: Multivariable logistic regression models adjusted for maternal age, gravidity, parity, gestational age, pre-pregnancy body mass index, gestational weight gain, and gestational diabetes mellitus.
Abbreviation: LGA=large for gestational age; TyG=triglyceride-glucose index; OR=odds ratio; CI=confidence interval; BMI=body mass index; GDM=gestational diabetes mellitus.
-
The findings suggest that elevated TyG levels throughout pregnancy, particularly in the third trimester, are significantly associated with an increased risk of LGA. Compared to the consistently low TyG group, both the consistently high and low-to-high TyG groups exhibited a greater risk of LGA, while the high-to-low group showed no significant increase in risk. Additionally, women with GDM and elevated TyG levels demonstrated a significantly higher risk of LGA. Although these results provide valuable insights, further research is needed to elucidate the mechanisms by which TyG influences LGA. Given these findings, it is crucial to raise awareness about the role of the TyG index during pregnancy as a potential biomarker for LGA risk.
Several studies have highlighted the relationship between early pregnancy TyG index and the increased risk of LGA. Pazhohan et al. found a significant correlation between higher maternal TyG levels and an increased likelihood of LGA among Iranian women (7). Similarly, a study in Beijing demonstrated that pregnant women with a TyG index of ≥8.3 and 7.9–8.3 had 3.01–fold and 1.06-fold higher risks of LGA, respectively, compared to those with a TyG index of <7.9 in early pregnancy (8). Further evidence from 12,108 singleton pregnancies in Fujian, China, revealed that women in the highest TyG quartile had a 1.86-fold higher risk of GDM compared to those in the lowest quartile (6). However, these studies were limited by small sample sizes or focused only on early pregnancy TyG index, lacking insights into its impact across all trimesters. Our findings are consistent with previous research on early TyG index and LGA risk. Additionally, this study demonstrated that elevated TyG levels in the second and third trimesters were associated with an increased risk of LGA, highlighting the importance of monitoring TyG levels throughout pregnancy.
This study extends existing research by incorporating trajectory analysis, demonstrating that women with consistently high TyG levels or those whose levels increase from low to high face a higher risk of LGA than those with consistently low TyG levels. Notably, women whose TyG levels decreased from high to low — possibly due to interventions — showed no significant increase in LGA risk. These findings emphasize the potential importance of timely TyG management to reduce fetal overgrowth. Given the associated adverse maternal and neonatal outcomes and potential intergenerational effects, early intervention to manage elevated TyG levels may play a crucial role in improving maternal and infant health outcomes.
Previous research has established GDM as a significant risk factor for fetal overgrowth (9). Consistent with these findings, our study observed a higher incidence of GDM in mothers of LGA infants compared to those with non-LGA infants. Among women with GDM, a consistently high TyG index throughout pregnancy was associated with a marked increase in LGA risk. These findings suggest that closer monitoring of the TyG index in women with GDM may help manage IR and potentially reduce the risk of LGA.
Several limitations should be acknowledged. First, as a prospective cohort study, our ability to establish direct causal relationships is inherently limited. Second, although we adjusted for multiple potential confounders, residual confounding from unmeasured variables, such as dietary intake and physical activity, may still exist. Third, glycated hemoglobin (HbA1c) data were not collected for a subset of GDM patients in this cohort, which limited our ability to evaluate the association between the TyG index and LGA specifically among women with well-controlled GDM. Finally, since the participants in this study were limited to singleton pregnant women in Beijing, China, further validation is required before generalizing the findings to other populations.
In conclusion, this study suggests a potential association between the TyG index during pregnancy and an increased risk of LGA. Monitoring and managing the TyG index may help reduce this risk. These findings emphasize the importance of tracking the TyG index throughout pregnancy during prenatal check-ups. By closely monitoring TyG index, clinicians may identify women at higher risk for LGA and implement timely interventions. However, further research across diverse regions, ethnicities, and multicenter populations is needed to confirm and validate these findings.
-
The investigators, researchers, and all participants in this study for their valuable contributions.
-
All participants provided informed consent. The study was conducted in accordance with the Declaration of Helsinki and approved by the Ethics Committee of Beijing Obstetrics and Gynecology Hospital (2018-ky-009-01).
HTML
| Citation: |

|