
 Download:


-
The primary objective of basic public health services is to enhance population health by preventing and controlling chronic diseases through risk factor management. In China, the national program provides free health examinations for individuals aged 65 and above and those with chronic conditions such as diabetes and hypertension, with 120 million elderly people aged 65 and above receiving health management services in 2021 (1). However, considering that the prevalence of diabetes among the elderly in China exceeded 30% in 2017 (2), and the diabetes incidence per 1,000 person-years among the 60–69 years-old was greater than 6 (3), much greater attention should be directed toward health management and early-stage intervention for the entire elderly population (4). A document jointly issued by the National Health Commission and eight other departments emphasized the importance of implementing national basic public health service projects and strengthening health management for the elderly, including assessments, examinations, and health guidance (5). Therefore, effective diabetes management should be extended to high-risk populations, necessitating an efficient, user-friendly diabetes risk assessment tool to help implement community-level interventions for elderly individuals and healthcare workers.
In recent years, numerous risk prediction models have been developed for diabetes risk assessment. For example, the 2020 Chinese Guidelines for Type 2 Diabetes Prevention and Treatment recommend a screening model (2) based on epidemiological data from 14 Chinese provinces and cities collected between 2007 and 2008 (6). This model, known as the New Chinese Diabetes Risk Score (NCDRS), demonstrated an area under the curve (AUC) of 0.748 in its initial validation. However, like many other similar models (7), it was limited by unverified applicability to elderly populations (8). As noted in our previous research on the global population, even the simplest logistic model identified risk factors for Type 2 Diabetes Mellitus (T2DM) in the Chinese population, which helped improve predictive performance (9), highlighting the potential for developing a T2DM prediction model tailored to elderly Chinese individuals. Therefore, this study aimed to further construct a model based on a combination of evidence-based and empirical approaches, and conduct in-depth comparisons across broader populations.
According to the aim of this study, we developed and validated the integrated Chinese Adapted Risk Evaluation for Diabetes Mellitus (iCARE-DM) model for elderly Chinese individuals. This model was first constructed based on the pooled effect estimates from a meta-analysis of cohort studies that identified T2DM risk factors in East Asian populations, followed by validations for generalizability and robustness using three Chinese datasets with regional and economic disparities, and was compared with the NCDRS model and four machine learning (ML) models. Finally, we also provide a discussion on how to offer a practical tool for community healthcare practitioners to identify high-risk populations and inform evidence-based T2DM prevention strategies.
-
This study followed the Preferred Reporting Items for Systematic Reviews and Meta-Analyses (PRISMA) statement (10-11), with the protocol registered on PROSPERO (CED42023490828). We conducted a comprehensive search of peer-reviewed literature databases — CNKI, WanFang Data, VIP, SinoMed, PubMed (Medline), EMBASE, Web of Science, and the Cochrane Library — using a comprehensive set of search terms (see https://github.com/791115271/iCARE-DM-Model-Supplementary-File.git for more details). The review focused on studies reporting risk factors for T2DM published from 1964 to 2024. Study quality was assessed using the Ottawa Scale (12), and only studies with medium or higher quality ratings were included. We selected either random effects or fixed effects models based on heterogeneity assessment. For risk factors with effect size
$ \beta $ reported in at least four studies, we performed meta-analysis to identify statistically significant (P<0.05) risk factors. -
The iCARE-DM model is a 5-year diabetes risk prediction scoring model developed based on the Framingham Heart Study methodology (13). The model determines regression coefficients for each risk factor through meta-analysis and assigns scores based on the corresponding β coefficients to estimate diabetes risk. The detailed steps for constructing the risk scoring model are provided (see https://github.com/791115271/iCARE-DM-Model-Supplementary-File.git for more details).
-
This study employed four classic ML algorithms as benchmarks to compare with our proposed iCARE-DM model: Logistic Regression (LR), Support Vector Machines (SVM), eXtreme Gradient Boosting (XGBoost), and Random Forest (RF). These algorithms were used to establish predictive models for T2DM in the Hongguang population. Four resampling techniques were also implemented to improve model performance. Subsequently, external validation was conducted using both the Bao’an and Kailuan populations. Detailed information regarding these methods is provided in Supplementary File C.
-
The iCARE-DM model was externally validated in three Chinese populations (Kailuan, Hongguang, and Bao’an). Hongguang is an urban-rural integrated community in Chengdu with a balanced demographic structure and a large elderly population. The Bao’an population, from the economically advanced Shenzhen region, had access to high-quality healthcare. The Kailuan population, comprising active and retired employees from a major coal mining enterprise in Tangshan, provided comprehensive baseline and follow-up data on demographics, lifestyle, medical history, and laboratory measures, as documented in prior studies (14-15).
These populations all shared characteristics of large size, high participation rates, and strong follow-up continuity, allowing for validation of the risk scoring model across diverse geographical locations, economic conditions, and other factors. The Supplementary Material documents the introduction, inclusion and exclusion criteria, data collection, and definitions for the three populations.
-
Baseline differences between the T2DM onset and non-onset groups were assessed using the Wilcoxon rank-sum test for continuous variables and the chi-squared test for categorical variables. Subgroup analyses by age and gender were conducted to assess model performance across different demographics. Statistical analyses were performed using R software (version 4.2.1, R Foundation for Statistical Computing, Vienna, Austria), with a two-tailed P<0.05 considered statistically significant. Model performance was evaluated via Receiver Operating Characteristic curves (ROC), AUC, accuracy (ACC), sensitivity (SEN), specificity (SPE), C-index, and the Hosmer–Lemeshow test. Kaplan‒Meier curves were used to assess risk stratification.
-
Our literature search identified 6,757 articles, of which 4,530 remained after removing duplicates. We excluded 4,218 articles that were reviews, conference abstracts, studies on diabetic complications, or literature that did not match our study criteria. After full-text screening of 312 records, we ultimately included 70 reports from 80 articles in the meta-analysis. A PRISMA flowchart detailing the selection process is shown in https://github.com/791115271/iCARE-DM-Model-Supplementary-File.git
. The risk factors identified through meta-analysis included gender, age, smoking, central obesity, exercise, BMI, WHtR, hypertension, fatty liver, family history of diabetes, FBG, TG, TYG, HDL-C, and uric acid level. The effect values and corresponding references are presented in Table 1. Detailed information about the literature included in the meta-analysis and the references for each risk factor are provided in https://github.com/791115271/iCARE-DM-Model-Supplementary-File.git.
Risk factor Risk factor group RR (95% CI) I2 P β Points Gender Female 1 − − − 0 Male 1.288 (1.023, 1.622) 0.973 0.032 0.25 1 Age 1.042 (1.023, 1.061) 0.963 <0.001 0.04 60–69 / 1 70–79 / 3 ≥80 / 5 Smoking No 1 − − − 0 Yes 1.433 (1.187, 1.73) 0.963 <0.001 0.36 2 Central obesity No 1 − − − 0 Yes 1.666 (1.132, 2.45) 0.967 <0.001 0.51 3 Exercise Yes 1 − − − 0 No 1.233 (1.032, 1.475) 0.927 0.021 0.21 1 BMI (kg/m2) <18.5 1 − − − −2 18.5–23.9 0.673 (0.602, 0.752) 0.231 <0.001 −0.40 0 24.0–27.9 1.74 (1.417, 2.137) 0.936 <0.001 0.55 3 ≥28 2.492 (1.87, 3.32) 0.940 <0.001 0.91 5 WHtR ≤0.5 1 − − − 0 >0.5 2.509 (1.649, 3.817) 0.899 <0.001 0.92 5 Hypertension No 1 − − − 0 Yes 1.379 (1.121, 1.697) 0.976 0.002 0.32 2 Fatty liver No 1 − − − 0 Yes 2.427 (1.753, 3.359) 0.939 <0.001 0.89 4 Family history of diabetes No 1 − − − 0 Yes 1.621 (1.514, 1.737) 0.498 <0.002 0.48 2 FBG (mg/dL) <100 1 − − − 0 100–110 3.637 (2.405, 5.501) 0.979 <0.003 1.29 6 >110 11.767 (8.28, 16.722) 0.970 <0.004 2.47 12 Low HDL−C No 1 − − − 0 Yes 1.128 (1.05, 1.213) 0.010 0.001 0.12 1 TG (mmol/L) <1.7 1 − − − 0 ≥1.7 1.783 (1.451, 2.191) 0.883 <0.001 0.58 3 High Uric Acid No 1 − − − 0 Yes 1.203 (1.066, 1.358) 0.640 0.003 0.18 1 TYG <8.25 1 − − − 0 8.25–8.6 1.73 (1.245, 2.406) 0.614 0.001 0.55 3 8.6–9.0 2.426 (2.027, 2.904) 0.409 <0.001 0.89 4 ≥9.0 3.993 (2.971, 5.368) 0.557 <0.001 1.38 7 Note: “−” means the reference group in this analysis. “/” means the RR was modeled as a continuous variable.
Abbreviation: RR=risk ratio; CI=confidence interval; BMI=body mass index; WHtR=Waist-to-Height Ratio; FBG=Fasting Blood Glucose; HDL-C=High-Density Lipoprotein Cholesterol; TG=Triglycerides; TYG=Triglyceride-Glucose Index.Table 1. Summary characteristics of included studies and points of the iCARE-DM model.
-
The risk score for each factor was calculated based on the
$ \beta $ coefficient obtained from the meta-analysis, with a total maximum score of 54. The risk factors and their corresponding point values are presented in Table 1. -
The LR model built with SMOTE oversampling achieved the highest AUC (0.777) in the Hongguang population. In external validation cohorts (Kailuan and Bao’an), the AUC values were 0.735 and 0.686, respectively. Detailed results for all model combinations are presented in Table 2.
Resampling method ML model AUC SEN G-mean ACC SPE Hong guang Kailuan Bao’an Hong guang Kailuan Bao’an Hong guang Kailuan Bao’an Hong guang Kailuan Bao’an Hong guang Kailuan Bao’an ADASYN LR 0.773 0.735 0.686 0.595 0.611 0.528 0.679 0.677 0.633 0.764 0.740 0.740 0.774 0.749 0.759 SVM 0.636 0.518 0.513 0.244 0.068 0.000 0.474 0.257 0.000 0.881 0.919 0.917 0.920 0.978 1.000 XGB 0.680 0.700 0.653 0.191 0.092 0.067 0.428 0.300 0.255 0.918 0.922 0.892 0.962 0.979 0.967 RF 0.746 0.651 0.746 0.298 0.018 0.166 0.527 0.136 0.398 0.896 0.932 0.890 0.933 0.995 0.956 SMOTE LR 0.777 0.735 0.686 0.557 0.611 0.528 0.662 0.677 0.633 0.774 0.740 0.740 0.787 0.749 0.759 SVM 0.643 0.522 0.498 0.252 0.064 0.000 0.483 0.250 0.000 0.886 0.920 0.917 0.925 0.979 1.000 XGB 0.706 0.702 0.621 0.206 0.084 0.271 0.446 0.288 0.466 0.923 0.925 0.757 0.967 0.983 0.802 RF 0.750 0.651 0.734 0.122 0.019 0.010 0.346 0.137 0.100 0.932 0.932 0.915 0.981 0.995 0.997 BLSMOTE LR 0.769 0.735 0.686 0.511 0.611 0.528 0.661 0.677 0.633 0.834 0.740 0.740 0.853 0.749 0.759 SVM 0.681 0.533 0.522 0.206 0.054 0.000 0.441 0.229 0.000 0.903 0.916 0.917 0.945 0.976 1.000 XGB 0.729 0.600 0.556 0.206 0.093 0.012 0.445 0.299 0.108 0.918 0.905 0.900 0.962 0.961 0.981 RF 0.760 0.675 0.737 0.115 0.010 0.004 0.336 0.099 0.061 0.938 0.934 0.916 0.988 0.998 0.999 DBSMOTE LR 0.705 0.735 0.686 0.481 0.611 0.528 0.623 0.677 0.633 0.788 0.740 0.740 0.807 0.749 0.759 SVM 0.592 0.513 0.509 0.214 0.032 0.000 0.449 0.177 0.000 0.900 0.929 0.917 0.941 0.991 1.000 XGB 0.660 0.668 0.648 0.137 0.137 0.441 0.363 0.361 0.571 0.910 0.899 0.715 0.957 0.952 0.740 RF 0.744 0.663 0.732 0.046 0.007 0.012 0.213 0.086 0.110 0.936 0.935 0.914 0.990 0.999 0.996 Abbreviation: AUC=Area Under the Receiver Operating Characteristic Curve; ACC=Accuracy; SEN=Sensitivity; SPE=Specificity; T2DM=Type 2 Diabetes Mellitus; SMOTE=Synthetic Minority Over-sampling Technique; BLSMOTE=Borderline-SMOTE; DBSMOTE=Density-Based SMOTE; LR=Logistic Regression; SVM=Support Vector Machine; XGB=eXtreme Gradient Boosting; RF=Random Forest. Table 2. The results of T2DM prediction models based on machine learning.
-
After developing the iCARE-DM model, we comprehensively validated its performance across three external populations. Baseline characteristics of these populations are presented in https://github.com/791115271/iCARE-DM-Model-Supplementary-File.git. Preliminary validation revealed an optimal risk score cutoff value of 22.5 with an AUC of 0.741. Using available data from both Hongguang and Bao’an populations, we compared the performance of the iCARE-DM model with the NCDRS model using the C-index and Hosmer–Lemeshow test. The iCARE-DM model demonstrated optimal cutoff values of 24.5 (AUC: 0.783) and 25.5 (AUC: 0.766) in Hongguang and Bao’an populations, respectively, as detailed in Table 3. Risk stratification based on these cutoffs classified populations into low- and high-risk groups, with Kaplan‒Meier curves presented in https://github.com/791115271/iCARE-DM-Model-Supplementary-File.git. In contrast, the NCDRS model showed lower performance, with optimal cutoff values of 35.5 (AUC: 0.660) and 33.5 (AUC: 0.606) in the Hongguang and Bao’an populations, respectively, as summarized in Table 3. These results underscore the superior predictive accuracy of the iCARE-DM model.
Population Subgroup iCARE-DM model NCDRS model Cutoff AUC
(95% CI)ACC
(95% CI)SEN
(95% CI)SPE
(95% CI)C-index HL test Cutoff AUC
(95% CI)ACC
(95% CI)SEN
(95% CI)SPE
(95% CI)C-index HL test Kailuan Entire Population 22.5 0.741 (0.734, 0.749) 0.700 (0.700, 0.700) 0.657 (0.643, 0.671) 0.703 (0.699, 0.706) − − − − − − − − − Hong
guangEntire Population 24.5 0.783 (0.760, 0.807) 0.761 (0.680, 0.853) 0.664 (0.553, 0.756) 0.767 (0.676, 0.871) 0.809 (0.785, 0.833) 0.241 35.5 0.660 (0.634, 0.686) 0.622 (0.503, 0.690) 0.634 (0.541, 0.793) 0.621 (0.487, 0.697) 0.670 (0.643, 0.697) 0.347 50–74 years old 24.5 0.787 (0.761, 0.814) 0.767 (0.680, 0.873) 0.664 (0.541, 0.763) 0.773 (0.676, 0.892) 0.811 (0.784, 0.838) 0.047 35.5 0.665 (0.635, 0.694) 0.630 (0.512, 0.695) 0.649 (0.558, 0.778) 0.629 (0.499, 0.701) 0.673 (0.642, 0.704) 0.072 ≥75 years old 24.5 0.763 (0.712, 0.815) 0.737 (0.549, 0.841) 0.663 (0.522, 0.870) 0.742 (0.527, 0.862) 0.798 (0.750, 0.846) 0.905 33.5 0.640 (0.586, 0.693) 0.494 (0.332, 0.722) 0.750 (0.467, 0.924) 0.476 (0.292, 0.737) 0.659 (0.605, 0.713) 0.169 Male 27.5 0.766 (0.732, 0.800) 0.820 (0.735, 0.866) 0.596 (0.513, 0.691) 0.834 (0.738, 0.885) 0.791 (0.757, 0.825) 0.012 36.5 0.642 (0.605, 0.678) 0.694 (0.488, 0.710) 0.530 (0.483, 0.757) 0.703 (0.473, 0.719) 0.649 (0.611, 0.687) 0.912 Female 23.5 0.803 (0.771, 0.836) 0.767 (0.641, 0.836) 0.706 (0.627, 0.858) 0.771 (0.629, 0.848) 0.831 (0.798, 0.864) 0.675 35.5 0.682 (0.646, 0.718) 0.613 (0.438, 0.677) 0.681 (0.603, 0.877) 0.608 (0.411, 0.680) 0.696 (0.659, 0.733) 0.193 Rural 25.5 0.787 (0.749, 0.824) 0.863 (0.577, 0.903) 0.564 (0.508, 0.873) 0.879 (0.563, 0.923) 0.815 (0.779, 0.851) <0.05 36.5 0.650 (0.609, 0.690) 0.687 (0.517, 0.701) 0.569 (0.514, 0.762) 0.693 (0.507, 0.708) 0.654 (0.612, 0.696) 0.437 Urban 24.5 0.778 (0.748, 0.809) 0.751 (0.660, 0.821) 0.684 (0.593, 0.787) 0.756 (0.652, 0.837) 0.806 (0.775, 0.837) 0.796 33.5 0.666 (0.633, 0.700) 0.504 (0.449, 0.688) 0.775 (0.557, 0.846) 0.485 (0.423, 0.695) 0.683 (0.648, 0.718) 0.296 Bao’an Entire Population 25.5 0.766 (0.761, 0.771) 0.756 (0.753, 0.759) 0.654 (0.645, 0.667) 0.766 (0.762, 0.768) 0.781 (0.776, 0.786) <0.05 33.5 0.606 (0.600, 0.612) 0.599 (0.475, 0.602) 0.547 (0.540, 0.699) 0.604 (0.455, 0.607) 0.618 (0.611, 0.625) 0.140 50–74 years old 25.5 0.768 (0.763, 0.774) 0.761 (0.732, 0.763) 0.657 (0.647, 0.687) 0.770 (0.736, 0.773) 0.786 (0.781, 0.791) <0.05 33.5 0.606 (0.599, 0.612) 0.601 (0.476, 0.604) 0.544 (0.536, 0.697) 0.607 (0.457, 0.609) 0.617 (0.610, 0.624) 0.120 ≥75 years old 26.5 0.755 (0.742, 0.767) 0.761 (0.755, 0.792) 0.628 (0.579, 0.654) 0.773 (0.767, 0.810) 0.749 (0.735, 0.763) <0.05 32.5 0.622 (0.591, 0.652) 0.497 (0.344, 0.639) 0.722 (0.533, 0.874) 0.475 (0.290, 0.645) 0.628 (0.592, 0.664) 0.379 Male 25.5 0.755 (0.748, 0.762) 0.739 (0.736, 0.772) 0.659 (0.611, 0.671) 0.747 (0.744, 0.786) 0.772 (0.765, 0.779) <0.05 33.5 0.595 (0.586, 0.603) 0.548 (0.485, 0.636) 0.591 (0.479, 0.673) 0.544 (0.468, 0.650) 0.609 (0.600, 0.618) 0.533 Female 25.5 0.777 (0.770, 0.784) 0.773 (0.741, 0.777) 0.654 (0.643, 0.699) 0.784 (0.746, 0.787) 0.791 (0.784, 0.798) <0.05 31.5 0.617 (0.608, 0.625) 0.527 (0.523, 0.656) 0.653 (0.495, 0.668) 0.516 (0.511, 0.669) 0.630 (0.620, 0.640) 0.781 Rural 25.5 0.773 (0.766, 0.780) 0.747 (0.743, 0.778) 0.679 (0.636, 0.693) 0.752 (0.749, 0.789) 0.781 (0.774, 0.788) <0.05 31.5 0.612 (0.604, 0.621) 0.452 (0.449, 0.578) 0.731 (0.578, 0.744) 0.429 (0.426, 0.577) 0.617 (0.607, 0.627) <0.05 Urban 25.5 0.762 (0.755, 0.769) 0.768 (0.737, 0.771) 0.634 (0.621, 0.677) 0.781 (0.745, 0.785) 0.781 (0.774, 0.788) <0.05 32.5 0.606 (0.597, 0.614) 0.572 (0.567, 0.632) 0.580 (0.500, 0.598) 0.572 (0.566, 0.644) 0.618 (0.608, 0.628) 0.709 Abbreviation: AUC=Area Under the Receiver Operating Characteristic Curve; ACC=Accuracy; SEN=Sensitivity; SPE=Specificity; HL test=Hosmer-Lemeshow test; NCDRS=New Chinese Diabetes Risk Score. Table 3. The results of external validation and comparison results with NCDRS model.
-
Subgroup analyses demonstrated consistent superiority of the iCARE-DM model over the existing NCDRS model across all populations. Notably, the iCARE-DM model showed 18.3% (0.787 vs. 0.665) and 26.7% (0.768 vs. 0.606) higher AUC values in the Hongguang and Bao’an populations, respectively, with the most significant improvement observed in subjects aged <75 years (21.5%–27.3% AUC improvement). The predictive advantage was particularly prominent in female participants (17.7%–26.3% AUC improvement). The urban-rural subgroup analysis demonstrated superior predictive accuracy of the iCARE-DM model compared to the NCDRS model in both populations, with robust applicability across both urban and rural subpopulations (AUCs consistently exceeding 0.76). More details are presented in Table 3 and Figure 1.
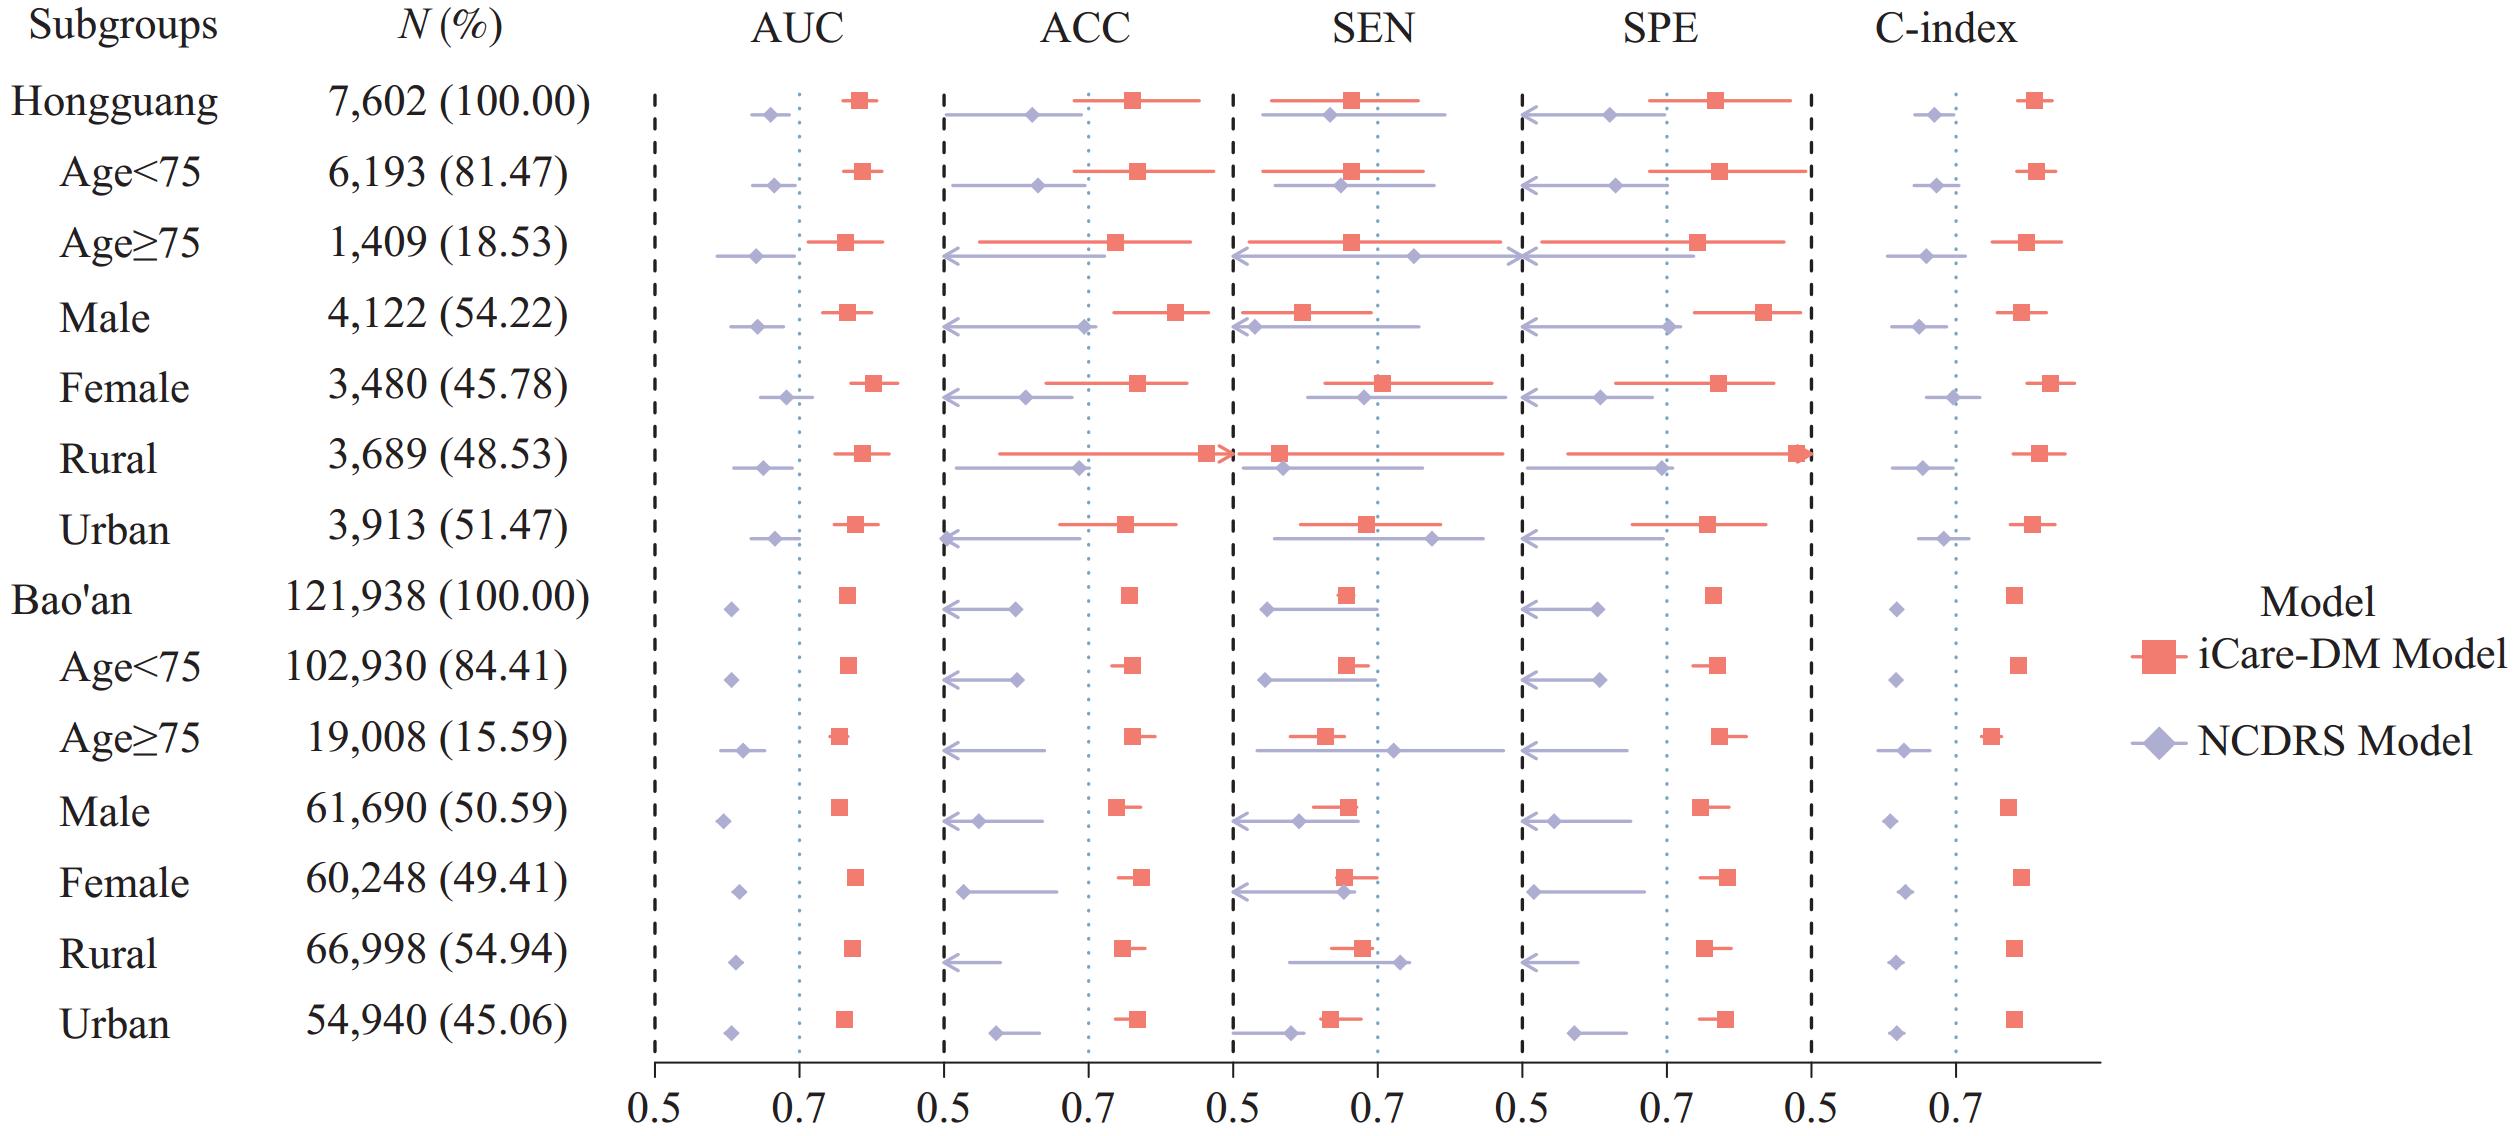 Figure 1.
Forest plot for subgroup analysis.
Abbreviation: AUC=Area Under the Receiver Operating Characteristic Curve; ACC=Accuracy; SEN=Sensitivity; SPE=Specificity. -
This study identified 15 risk factors for T2DM through a meta-analysis of 70 findings. The identified risk factors included gender, age, smoking, central obesity, exercise, BMI, WHtR, hypertension, fatty liver, family history of diabetes mellitus, FBG, TG, TYG, low HDL-C, and uric acid level. Elevated FBG was assigned the highest risk score (score=12), as elevated FBG is a common early indicator of prediabetes or incipient diabetes (16).
Based on routinely available data, we developed the iCARE-DM model, a T2DM prediction model suitable for the elderly Chinese population. External validation of the iCARE-DM model in three independent populations yielded AUC values of 0.741, 0.783, and 0.766, demonstrating strong predictive accuracy. Comparative analysis with the NCDRS model revealed superior performance of our model, which can be attributed to its age-specific design (focused on individuals >50 years old) and the inclusion of additional risk factors (e.g., smoking, fatty liver, FBG, and TYG index). These inclusions reflect recent findings in T2DM risk research and increase the model’s relevance to contemporary populations. For the LR model with ADASYN algorithm, the AUC (0.777) in the original population was comparable to that of the iCARE-DM model (0.783). However, an approximately 9% AUC difference was observed across validation datasets. For example, the LR model achieved an AUC of 0.777 in the original test dataset, while its AUC decreased to 0.686 in the Bao’an external validation dataset. This indicates that the generalizability and robustness of the ML model were inferior to those of the iCARE-DM model.
Subgroup analyses stratified by age and gender indicated that the meta-analysis model outperformed the NCDRS model across all subpopulations, including individuals aged <75 years and ≥75 years, as well as both male and female participants. These findings underscore the universal applicability of our model across diverse demographic groups.
The iCARE-DM model proposed in this study demonstrated significant practical utility through several key aspects: 1) The model identified 15 risk factors through high-quality cohort studies of East Asian populations, enhancing its representativeness. Comparative analyses with the NCDRS model confirmed its superior predictive accuracy. External validation across three geographically and economically diverse Chinese populations (from southwestern, southeastern, and northern regions) further confirmed its robustness and efficacy in identifying high-risk populations; 2) Its variables aligned with those of routine Chinese public health data, ensuring accessibility and ease of use for grassroots healthcare workers and elderly individuals; 3) By synthesizing recent T2DM research, our study contributed to refining screening tools and updating guidelines for elderly populations; 4) The scoring scale supported targeted health recommendations, enabling personalized health programs. In summary, the iCARE-DM model offered high accuracy, robustness, variable accessibility, and practical applicability.
This study had several limitations. First, a comprehensive bias assessment could not be made in the meta-analysis due to the limited variability in study characteristics. However, all included studies underwent rigorous quality evaluation and were derived from large-scale East Asian populations, demonstrating minimal heterogeneity in genetic and demographic backgrounds. Secondly, the meta-analysis primarily incorporated studies targeting populations aged 35 years and above, rather than specifically focusing on elderly individuals. However, this limitation actually reflects the scarcity of current research on diabetes risk assessment dedicated to populations over 50 years, which conversely highlights the necessity of our study. More importantly, despite this limitation, the predictive model still maintained accuracy, robustness, and consistent performance across various subgroups, suggesting that the applicability of the iCARE-DM model can be guaranteed in practice. Thirdly, the iCARE-DM model did not propose an exact overall cutoff value for T2DM diagnosis since this was beyond the scope of our study. However, our findings revealed comparable threshold ranges across different populations, which provides a foundation for future diagnostic research. In summary, these limitations illuminate directions for future exploration, and more in-depth research is highly anticipated to improve precision health management of T2DM for elderly people in China and beyond.
-
All participants provided informed consent. The study was approved by the Ethics Committee of West China Fourth Hospital and West China School of Public Health, Sichuan University (Approval Number Gwll2024175); the Ethics Committee of School of Public Health, Sun Yat-Sen University (Approval Number 2022-091); and the Ethics Committee of Kailuan General Hospital (Approval Number: 2006-05).
HTML
Screening of Risk Factors Based on Meta-Analysis

Model Construction
The iCARE-DM model
T2DM prediction model based on ML
Multicenter External Validation
Statistical Analysis
Screening of Risk Factors Based on Meta-Analysis
The Risk Score of iCARE-DM Model

Performance Evaluation and Validation of the ML Model
Performance Evaluation and Validation of the iCARE-DM Model
Multicenter external validation
Subgroup analysis
| Citation: |

|