
 Download:


-
Sub-Saharan Africa accounted for over 90% of global malaria cases and deaths annually after 2010, with approximately 75% of the total malaria prevention and control (P&C) funding sourced from global donors (1). The United States of America (USA), the United Kingdom (UK), the Global Fund to Fight AIDS, Tuberculosis and Malaria (GF), and the United Nations agencies provided about 90% of total global assistance, covering most countries in this region over the past decade (1). Through combined local and global efforts, malaria prevalence and mortality nearly halved from 2000 to 2015; however, this momentum has not been maintained, with a notable rebound following the coronavirus disease 2019 (COVID-19) pandemic (2). Given the current challenges and limited funding, it is imperative to identify the obstacles to malaria P&C progress in Sub-Saharan Africa and maximize the effectiveness of available resources. Although service coverage and quality have been identified as major barriers to malaria P&C development in Africa, few studies in the past five years have comprehensively analyzed P&C service status across Sub-Saharan Africa, and even fewer have statistically examined donor effects on malaria-related service improvements. This study aims to construct a cascade of malaria P&C practices, analyze major donors’ funding contributions to each level of the cascade and their effects, identify challenges, provide suggestions for improving global anti-malarial assistance effectiveness, and promote malaria P&C development in Africa.
-
Data on malaria P&C practice coverage and febrile rates were obtained from the Demographic and Health Surveys (DHS) and the Malaria Indicator Surveys (MIS). These surveys provided data on: insecticide-treated mosquito net (ITNs) use and indoor residual spraying (IRS) implementation in households; intermittent preventive treatment during pregnancy (IPTp) among women aged 15–49; diagnostic blood testing, and type and timing of treatment among febrile children under age 5 (U-5 children). Thus, the target population is limited to these groups. Data on country characteristics, including population, gross nation income (GNI), malaria incidence, and domestic malaria funding, were obtained from the World Bank dataset, the Global Burden of Disease Study 2021 (GBD 2021), and the World Health Organization (WHO)’s World Malaria Reports. Funding data for the major donors — USA, UK, GF, and United Nations International Children’s Emergency Fund (UNICEF) — were obtained from official reports of the corresponding agencies and cross-checked with the World Malaria Reports and the Institute for Health Metrics and Evaluation (IHME) Development Assistance for Health (DAH) database. Links to all data sources are available in
Supplementary Table S1 . -
Based on WHO recommendations (3) and considering data availability, a comprehensive malaria P&C cascade was defined to include: 1) ITNs and IRS use, 2) IPTp service, 3) care-seeking when fever occurs, 4) blood testing, 5) timely medical treatment, and 6) full course of medicine use. Donor funding was categorized into 1) ITNs and IRS, 2) IPTp, 3) diagnosis, and 4) treatment, and estimated accordingly. Each level of the cascade was further classified as “recommended” or “unrecommended” based on the WHO Guidelines for Malaria (3). The definitions of recommended practices (RPs) and unrecommended practices (UPs) are listed in
Supplementary Table S2 . As most countries lacked data on diagnostic results, it was impossible to determine whether children who received anti-malarial drugs were diagnosed with malaria; therefore, levels 5) and 6) in the cascade included all children treated with drugs. To describe trends in cascade coverage, considering the limited data points for each country, we developed a new indicator called balanced annual percentage change (BAPC). The formula is:$$ {b}_{ijk}=\frac{{c}_{ij(p+1)}-{c}_{ijp}}{{L}_{ijk}} $$ $$ {BAPC}_{ij}=\frac{\sum _{k=1}^{k=n}{{L}_{ijk}b}_{ijk}}{\sum _{k=1}^{k=n}{L}_{ijk}} $$ where k is the sequence number of the periods between two available data points, and period k begins at year p and ends at year p+1;
$ {c}_{ijp} $ is the coverage of measure j of country i in year p;$ {L}_{ijk} $ is the length of time of period k; n is the total number of the periods. This indicator describes and compares countries’ overall trends in the coverage of each cascade measure. -
The frequency and timing of surveys varied greatly across countries. To include as many countries as possible, we divided the 2011–2022 time range into four periods: 2011–2013, 2014–2016, 2017–2019, and 2020–2022. One data point represented a country’s condition in the corresponding period, and countries with two or more data points were included.
For analyzing donor funding effects, one-year lagged panel analysis (4) was selected, with control variables including 1) malaria incidence, 2) population, 3) GNI, and 4) domestic malaria funding. The dependent variables were interpolated and explanatory variables were min-max normalized. Data was processed with IBM SPSS Statistics 20 (IBM Corp., Armonk, NY, USA). Figures were created with Origin 2023 (OriginLab Corp., Northampton, MA, USA).
-
This study included 1,638,505 person-time observations across 26 countries. The average sample size per country in each period was 12,036 for children under age 5 (U-5) and 11,388 for women aged 15–49. Detailed demographic characteristics of the study countries and sample sizes are presented in
Supplementary Tables S3–S5 . -
The coverage of cascade components among U-5 children and women aged 15–49 by country and period are presented in Supplementary Table S4 and Table S5; and Figure 1 panels (A)–(D) illustrate the population-balanced coverage of the malaria P&C cascade, febrile rates, and malaria incidence among U-5 children across the four study periods. From 2011–2013 to 2014–2016, coverage of all P&C measures nearly doubled. However, since 2016, all rates have declined at different but nonetheless alarming rates. Notably, blood test rates were lower than treatment rates during 2011–2016, and by 2014–2016, treatment rates exceeded incidence rates. These findings suggest potential mistreatment of febrile children without confirmed diagnoses, although data quality limitations may have contributed to these discrepancies. By 2017–2019, blood test rates surpassed treatment rates, but without data on diagnostic results, it remained impossible to determine whether all treated children had confirmed malaria diagnoses. As shown in Figure 1 panels (E)–(H), among women aged 15–49, RP coverage of ITNs and IRS followed similar trends to those observed in U-5 children, while IPTp coverage increased throughout the 12-year period, albeit at a decreasing pace. Comparatively, RP coverage in women showed a faster and more sustainable growth.
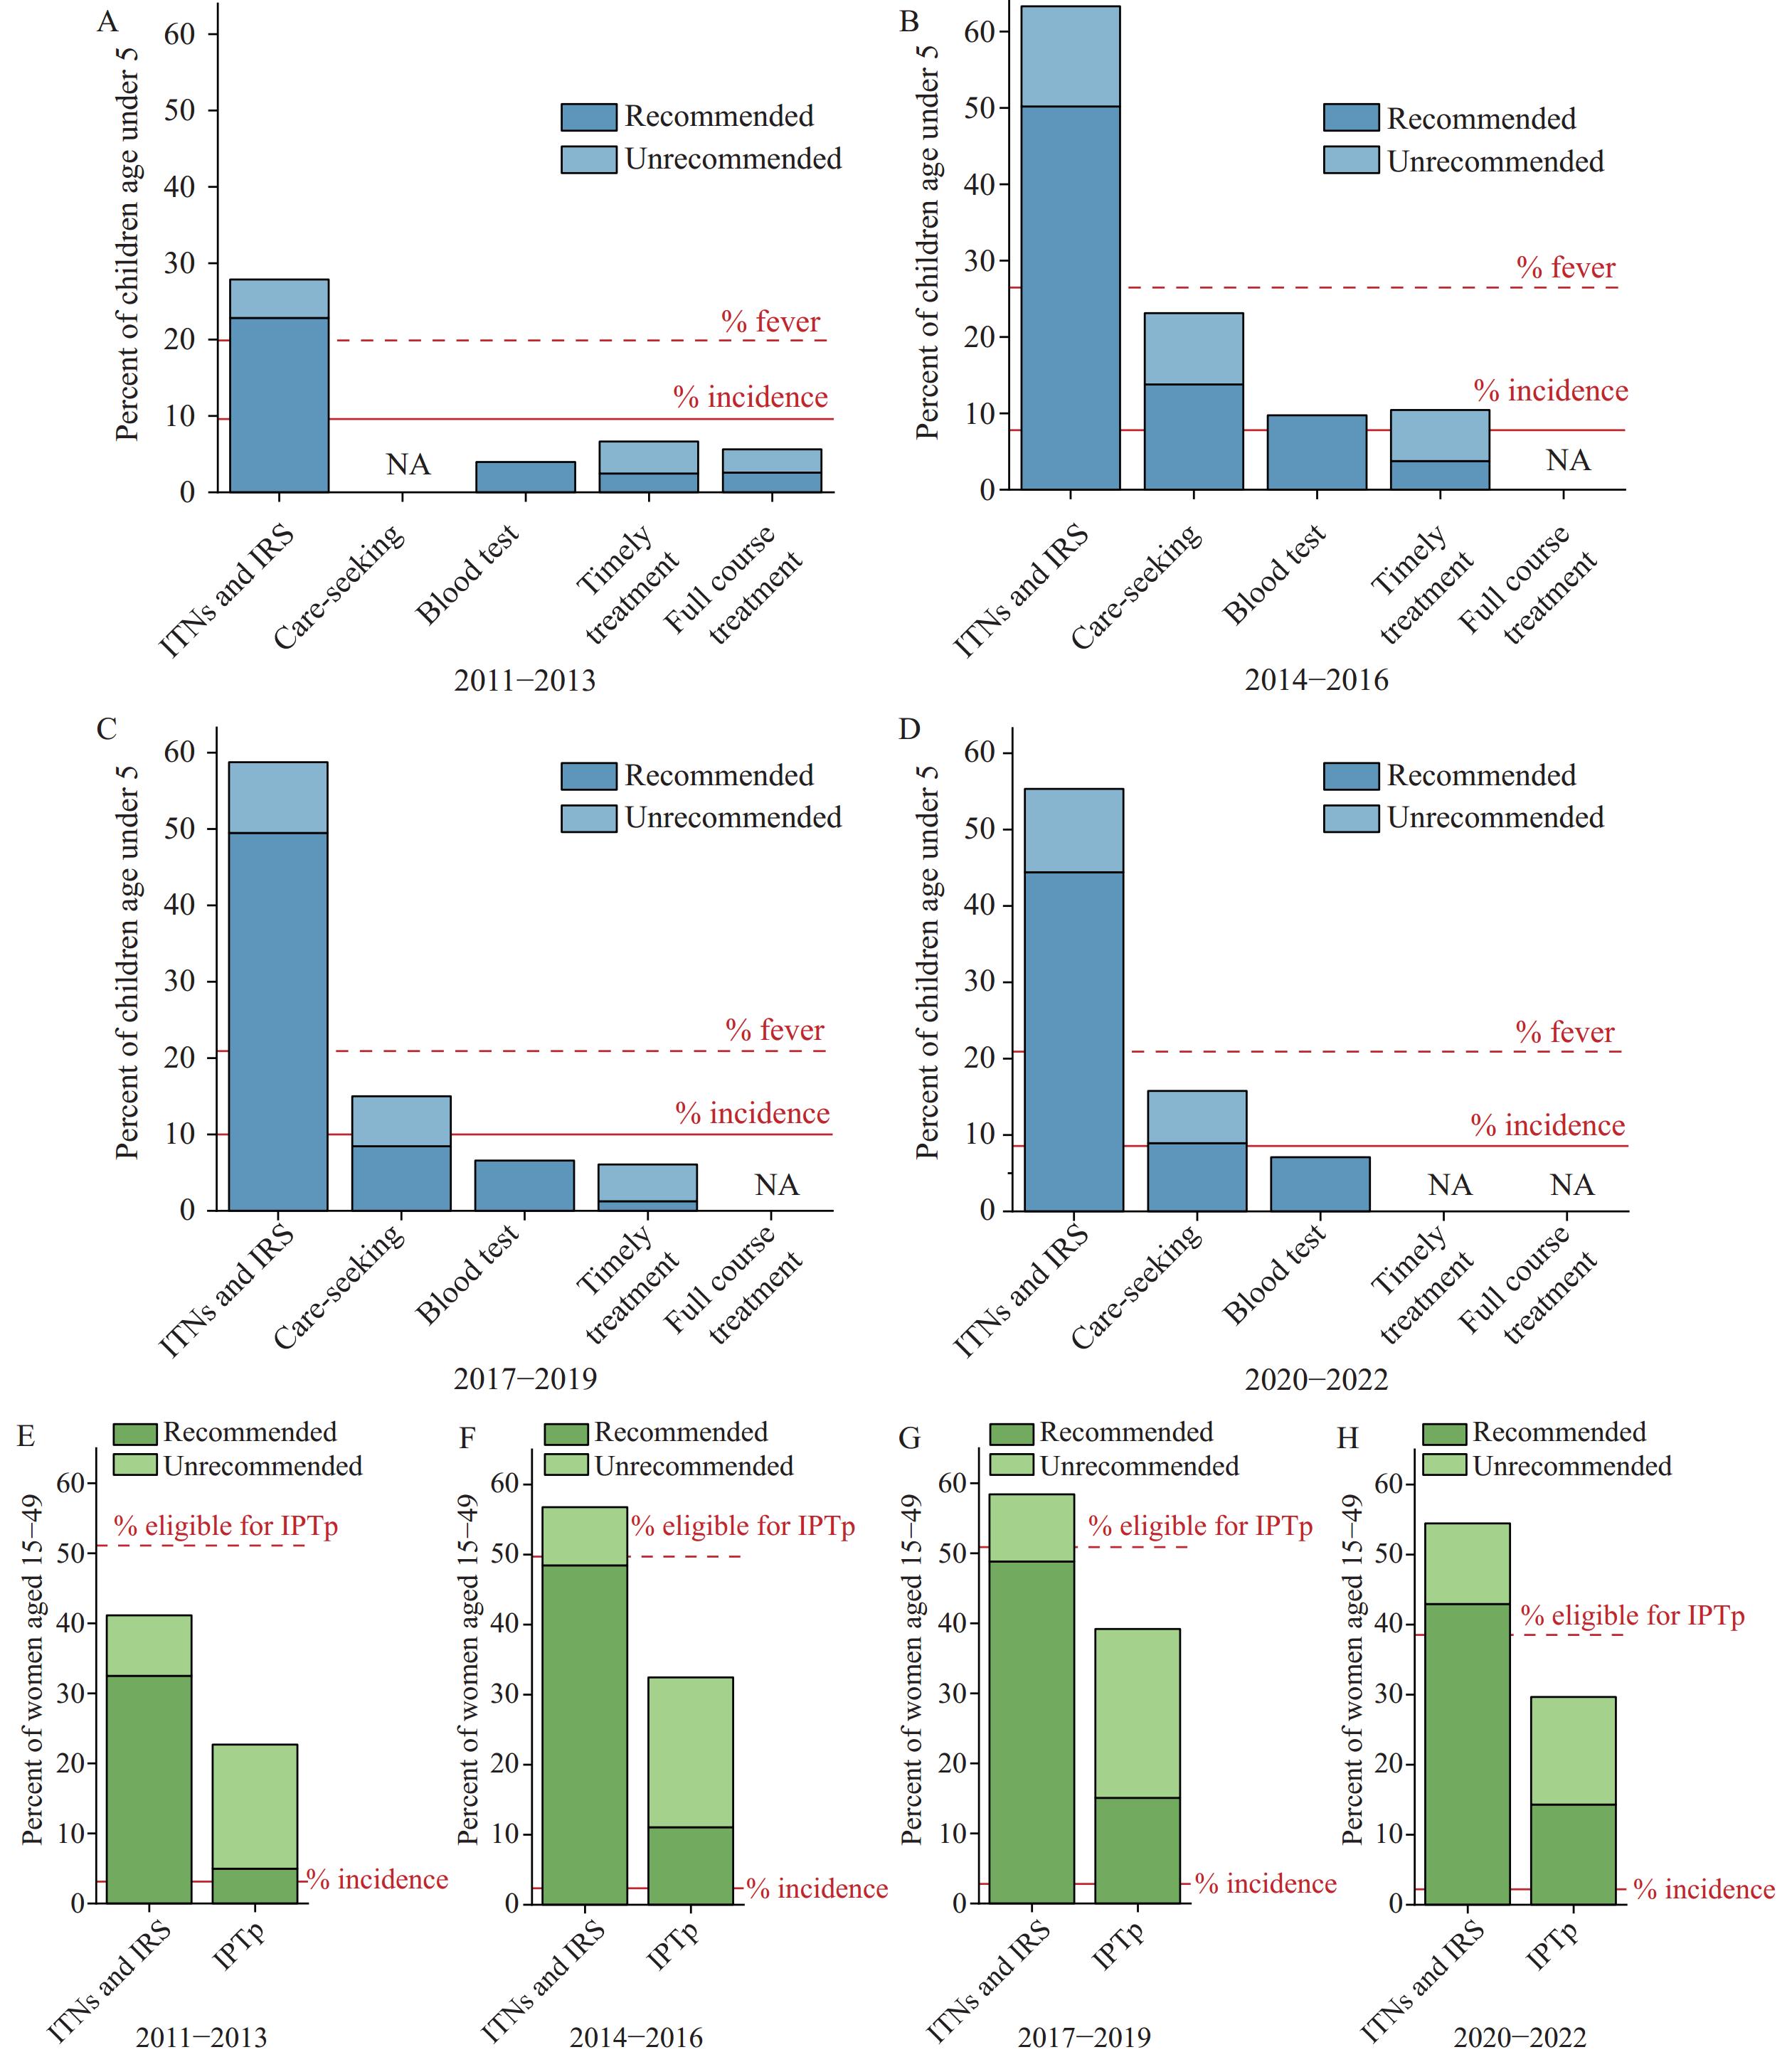 Figure 1.
Coverage of the cascade of malaria prevention and control. (A) children under age 5 (U-5) in 2011−2013; (B) children under age 5 (U-5) in 2014−2016; (C) children under age 5 (U-5) in 2017−2019; (D) children under age 5 (U-5) in 2020−2022; (E) women aged 15−49 in 2011−2013; (F) women aged 15−49 in 2014−2016; (G) women aged 15−49 in 2017−2019; (H) women aged 15−49 in 2020−2022.
Note: The dotted red lines represent the average fever rates reported in the DHS: (A) 19.90%, (B) 26.49%, (C) 20.93%, and (D) 20.92%. The solid red lines indicate the average malaria incidence rates reported in the IHME GBD 2021: (A) 9.61%, (B) 7.79%, (C) 10.01%, and (D) 8.57%. The dotted red lines represent the pregnancy rates among surveyed women reported in the DHS: (E) 51.09%, (F) 49.71%, (G) 50.87%, and (H) 38.51%. The solid red lines indicate the average malaria incidence rates reported in the IHME GBD 2021: (E) 3.13%, (F) 2.35%, (G) 2.78%, and (H) 2.21%.
Abbreviation: NA=not available; ITNs=insecticide treated nets; IRS=indoor residual spraying; IPTp=intermittent preventive treatment during pregnancy; IHME=institute for health metrics and evaluation; GBD=global burden of disease.
Figure 2 presents the BAPC of cascade coverage. RP coverage of ITNs and IRS increased to varying degrees among both U-5 children and women in 16 countries. For IPTp, only Mali and Ghana exhibited declines in RP coverage, while most countries showed considerable progress; meanwhile, UP coverage decreased in approximately half of the countries. Changes in care-seeking rates varied substantially across countries; growth in blood test rates was most promising, while treatment rates trended downward in most countries. Countries exhibited three main types of practice changes: Type I (ideal) — overall increase with RP increasing while UP decreasing, or RP increasing faster than UP; Type II (less ideal) — widened RP-UP gap with UP increasing faster than RP, or RP decreasing while UP increased more rapidly; Type III (unideal) — overall decrease with RP increasing but UP decreasing faster, or RP decreasing while UP increasing more slowly, or both decreasing. For ITNs and IRS, IPTp, care-seeking, and treatment, 0.00%, 4.17%, 26.67%, and 19.05% of countries fell into Type II, while 38.46%, 18.18%, 60.00%, and 57.14% fell into Type III, respectively.
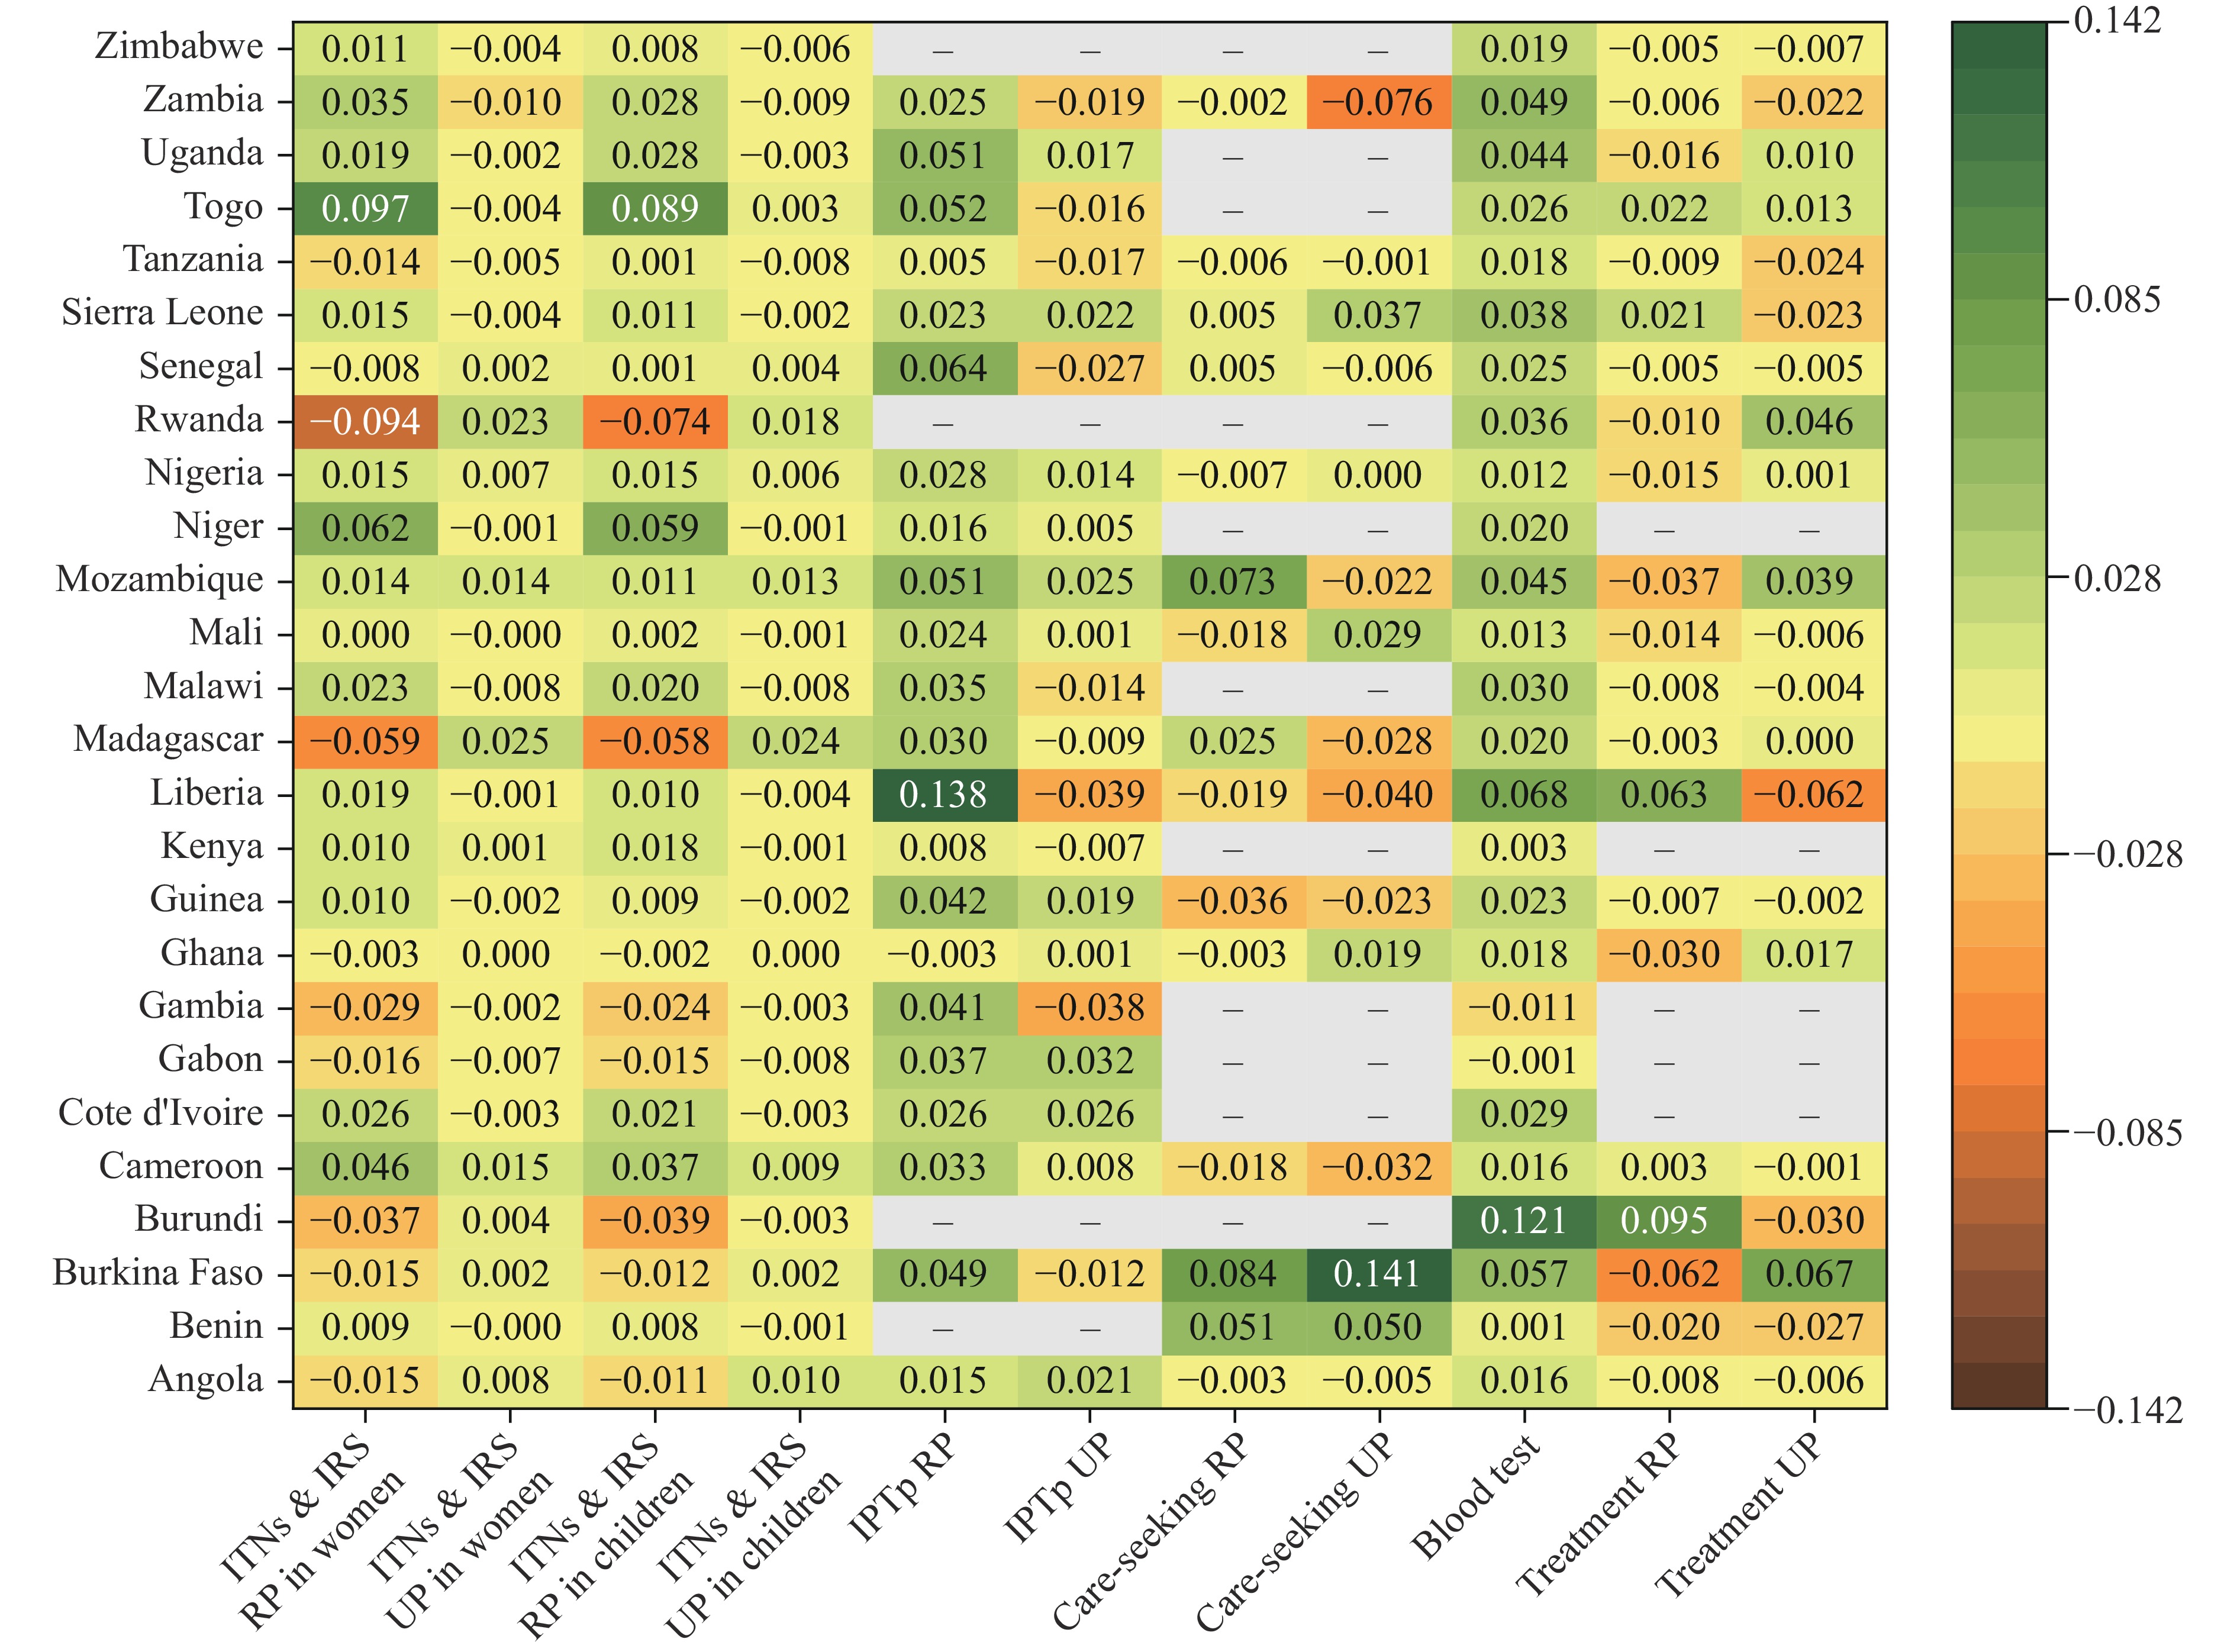 Figure 2.
BAPC of the cascade coverage by country.
Note: − indicates missing values.
Abbreviation: BAPC=balanced annual percentage change; ITNs=insecticide treated nets; IRS=indoor residual spraying; IPTp=intermittent preventive treatment during pregnancy; RP=recommended practice; UP=unrecommended practice.
-
Figure 3 illustrates the funding contributions from the four major donors to the 26 study countries by component and year. During 2011–2020, total funding reached 7.15 billion USD, increasing from 627.24 million USD in 2011 to 721.89 million USD in 2020, with an annual average of 715.43 million USD. The USA and the GF contributed 94.65% of total funding with relatively stable patterns. In contrast, funding from the UK and UNICEF showed considerable volatility, with rapid austerity evident. The procurement and distribution of ITNs were the primary focus for the USA, UK, and UNICEF, accounting for 57.78%, 54.39%, and 56.33% of their annual funding, respectively. The GF emphasized medical supply and service optimization for IPTp (37.97%) and treatment (36.62%) simultaneously.
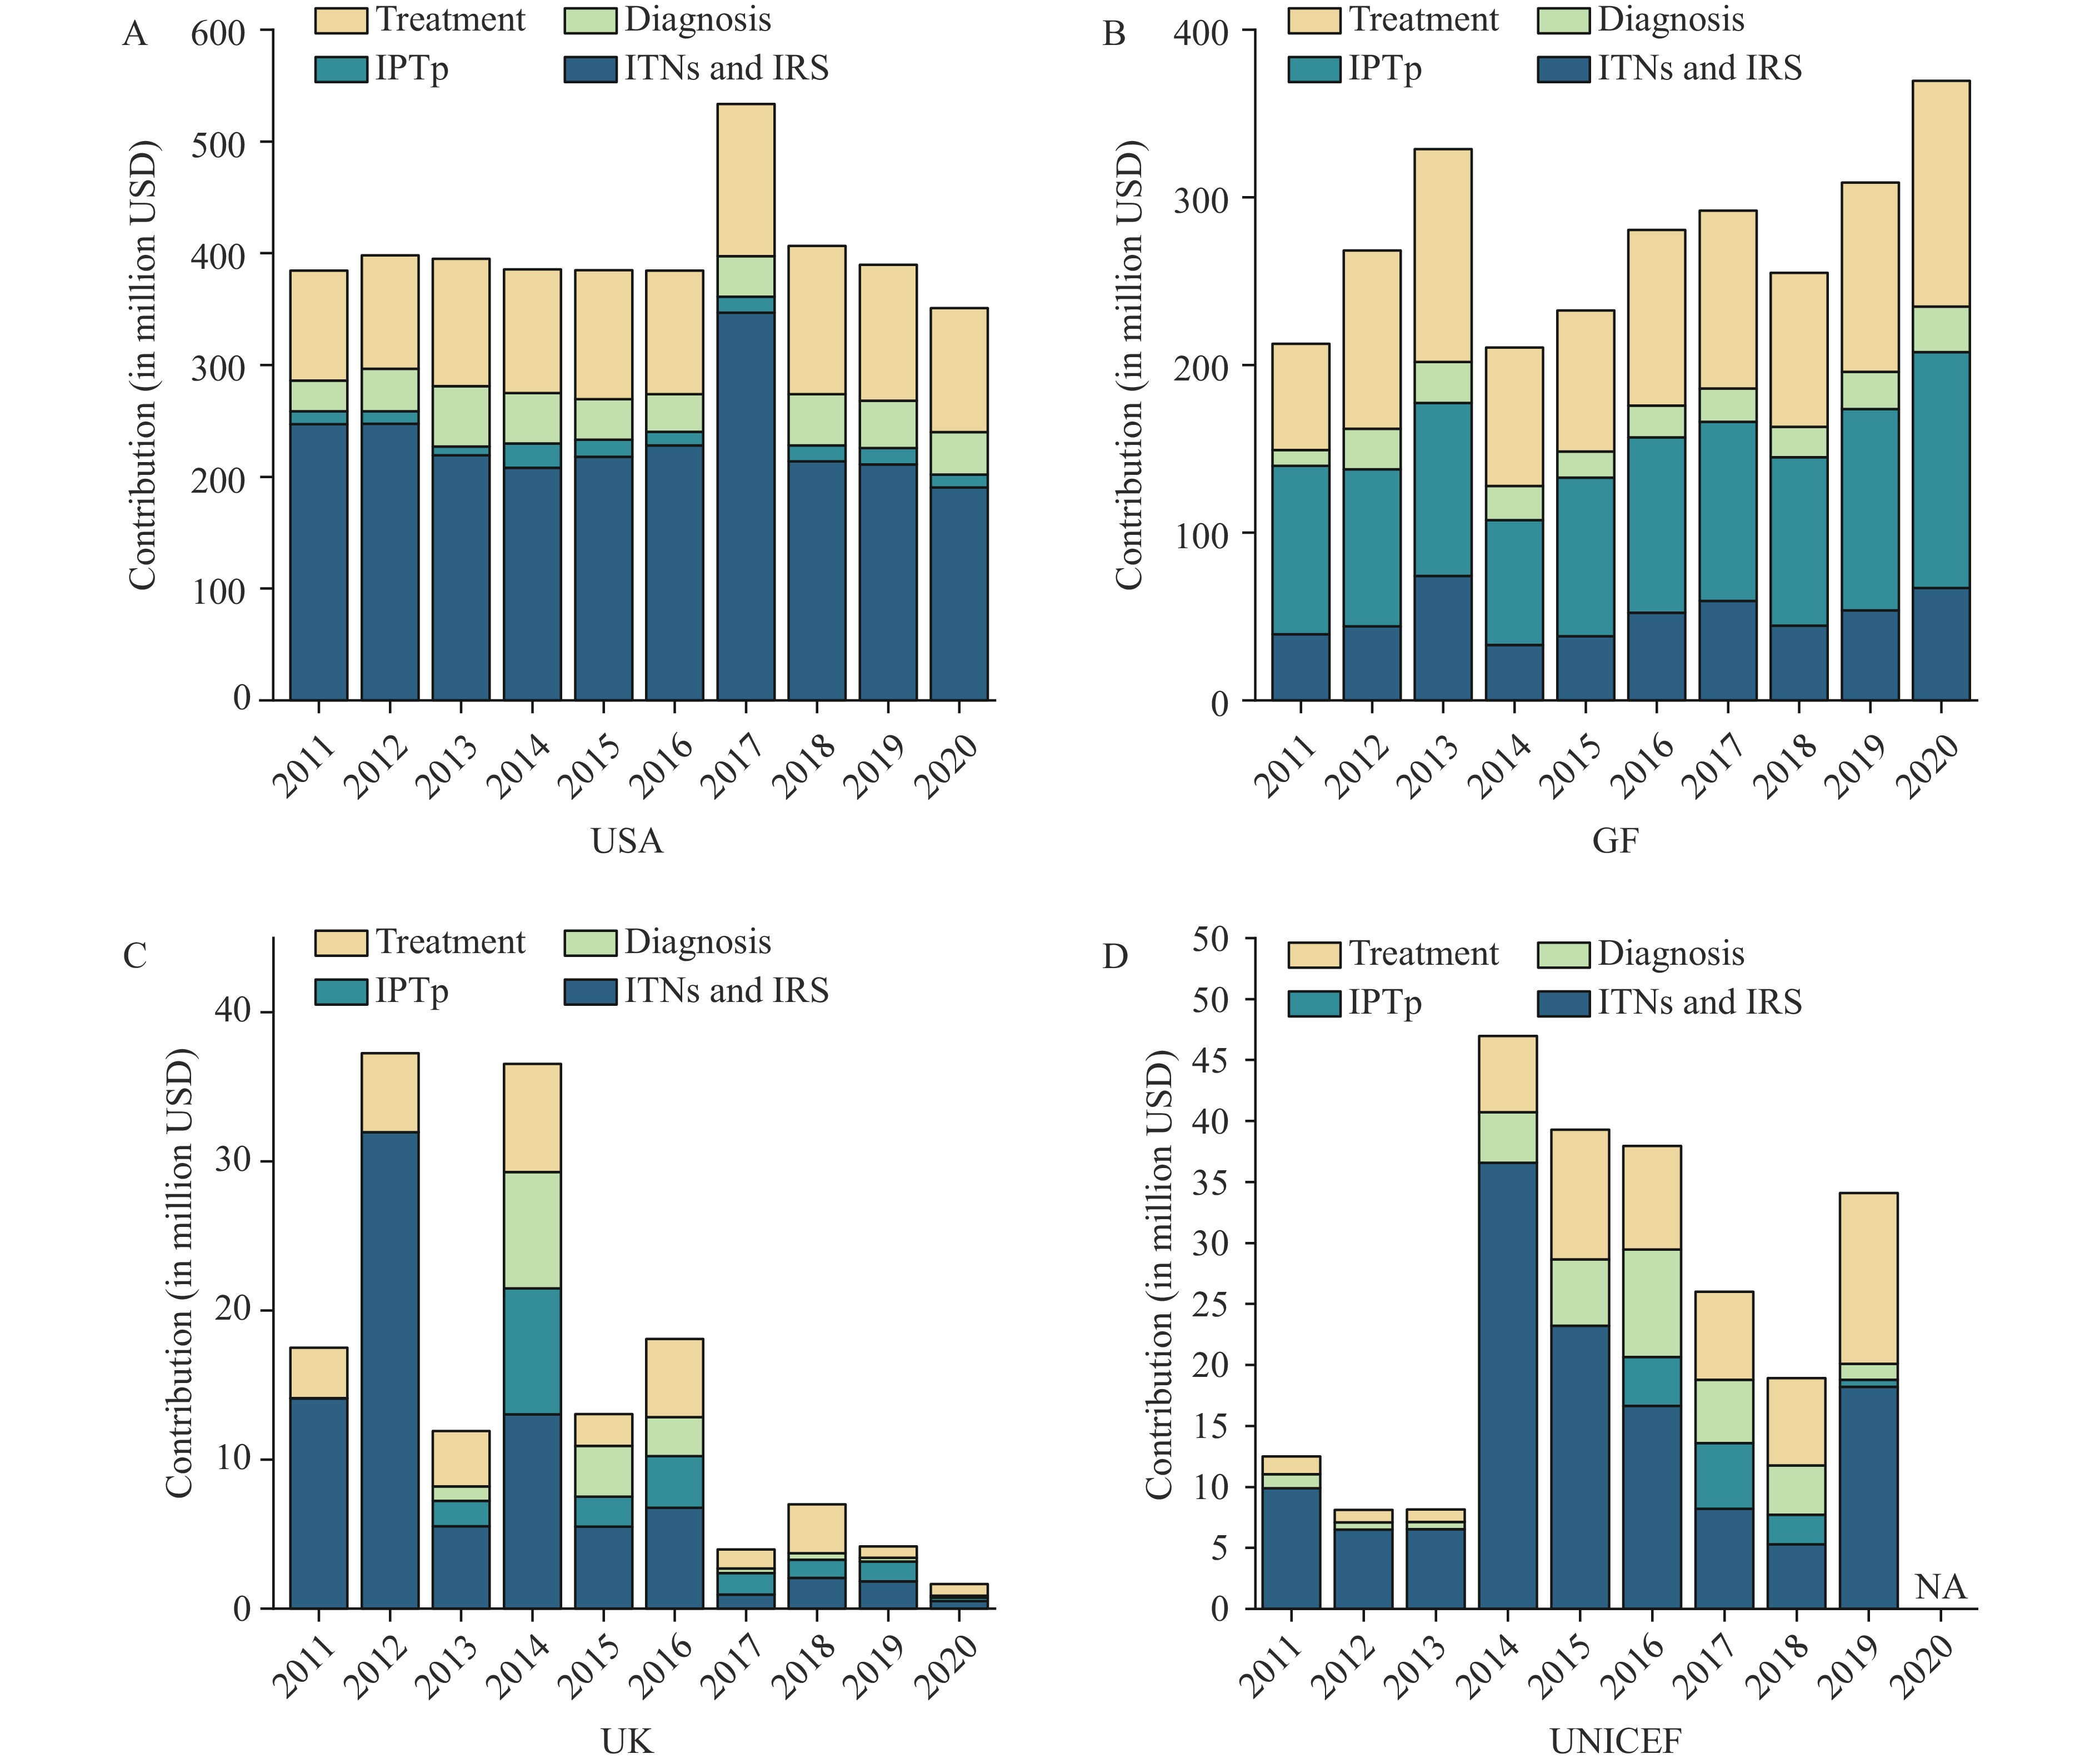 Figure 3.
Funding from major donors by type of intervention. (A) United States of America (USA); (B) Global Fund to Fight AIDS, Tuberculosis and Malaria (GF); (C) United Kingdom (UK); (D) United Nations International Children’s Emergency Fund (UNICEF).
Abbreviation: USA=United States of America; GF=Global Fund to fight AIDS, Tuberculosis and Malaria; UK=United Kingdom; UNICEF=United Nations International Children’s Emergency Fund; ITNs=insecticide treated nets; IRS=indoor residual spraying; IPTp=intermittent preventive treatment during pregnancy.The results of the one-year lagged panel regression are presented in Table 1. Based on Breusch-Pagan and Hausman tests, random effect model was selected. For both U-5 children and women aged 15–49, aggregated funding was positively correlated with coverage of ITNs and IRS total coverage and RP. Among individual donors, only the USA demonstrated effectiveness in improving coverage of ITNs and IRS, care-seeking, and IPTp.
Population Donor U-5 children Women aged 15−49 USA UK GF UNICEF Total USA UK GF UNICEF Total ITNs and IRS As recommended 0.271*
(0.062, 0.481)−0.136
(−0.363, 0.090)0.075
(−0.102, 0.253)−0.045
(−0.301, 0.209)0.251*
(0.048, 0.454)0.247*
(0.052, 0.442)−0.145
(−0.354, 0.063)0.057
(−0.106, 0.222)−0.032
(−0.267, 0.203)0.226*
(0.037, 0.415)Unrecommended 0.002
(−0.106, 0.111)−0.008
(−0.130, 0.113)−0.039
(−0.133, 0.054)−0.005
(−0.142, 0.130)−0.016
(−0.121, 0.088)−0.007
(−0.059, 0.045)0.001
(−0.052, 0.054)0.001
(−0.040, 0.043)−0.012
(−0.072, 0.046)−0.006
(−0.057, 0.044)In total 0.279*
(0.046, 0.513)−0.137
(−0.393, 0.118)0.036
(−0.164, 0.236)−0.049
(−0.337, 0.238)0.239*
(0.012, 0.465)0.248*
(0.058, 0.439)−0.144
(−0.349, 0.061)0.205
(−0.074 0.484)−0.038
(−0.419, 0.342)0.227*
(0.042, 0.412)IPTp As recommended – – – – – 0.189*
(0.015, 0.363)−0.182
(−0.446, 0.082)−0.068
(−0.294, 0.157)−0.026
(−0.289, 0.249)−0.048
(−0.270, 0.174)Unrecommended – – – – – 0.092
(−0.035, 0.220)−0.045
(−0.228, 0.137)−0.007
(−0.194, 0.178)−0.007
(−0.167, 0.152))0.002
(−0.154, 0.159)In total – – – – – 0.285*
(0.094, 0.475)−0.204
(−0.480, 0.072)−0.073
(−0.317, 0.171)−0.016
(−0.302, 0.269)−0.042
(−0.283, 0.197)Care−seeking Within 24 h 0.201
(−0.039, 0.441)−0.081
(−0.509, 0.346)−0.285
(−0.532, 0.039)0.194
(−0.159, 0.547)−0.085
(−0.340, 0.169)– – – – – After 24 h 0.356*
(−0.127, 0.584)0.031
(−0.390, 0.454)−0.139
(−0.388, 0.109)0.039
(−0.304, 0.383)0.102
(−0.149, 0.324)– – – – – In total 0.539
(−0.127, 0.951)−0.049
(−0.800, 0.701)−0.239
(−0.575, 0.150)0.235
(−0.380, 0.851)0.015
(−0.431, 0.465)– – – – – Blood test 0.061
(−0.130, 0.252)−0.195
(−0.469, 0.078)0.075
(−0.088, 0.239)−0.053
(−0.259, 0.152)−0.041
(−0.165, 0.082)– – – – – Treatment Within 24 h −0.050
(−0.225, 0.124)−0.005
(−0.204, 0.192)0.002
(−0.218, 0.222)−0.051
(−0.180, 0.283)−0.024
(−0.219, 0.170)– – – – – After 24 h 0.116
(−0.062, 0.295)0.010
(−0.192, 0.213)0.137
(−0.088, 0.364)0.043
(−0.199, 0.285)0.160
(−0.033, 0.354)– – – – – In total 0.051
(−0.111, 0.215)0.032
(−0.148, 0.212)0.131
(−0.073, 0.335)0.076
(−0.137, 0.289)0.120
(−0.054, 0.296)– – – – – Note: – indicates missing values.
Abbreviation: USA=United States of America; UK=United Kingdom; GF=Global Fund to Fight AIDS, Tuberculosis and Malaria; UNICEF=United Nations International Children's Emergency Fund; ITNs=Insecticide Treated Nets; IRS=Indoor Residual Spraying; IPTp=Intermittent Preventive Treatment during Pregnancy.
* indicates P<0.05.Table 1. One-year lagged panel regression of cascade coverage and major donors’ funding.
-
From 2011 to 2016, the coverage of each level of the prevention and control cascade nearly doubled. This finding aligns with a 2015 publication that reported care-seeking rates exceeding 50% and first-line medication compliance rates below one-third across 43 Sub-Saharan African countries (5). However, after 2016, most services experienced declining coverage at varying rates, with over half of the countries falling into the type III category for care-seeking and treatment. Such a decrease partially corresponds with World Malaria Reports 2017–2023, and warns of the difficulties in developing these health system components. Additionally, the type II countries of a considerable proportion require special attention due to the potential harm caused by the widening gap between UPs and RPs, as supported by substantial evidence (6–8).
The panel analysis results align with existing studies (9-10). Two potential concerns require attention: first, for services showing statistically significant relationships between assistance funding and service coverage, the effects may manifest in both RPs and UPs, suggesting limited control over implementation processes. Second, prevention and care-seeking represent upstream components of the malaria P&C cascade, which depend more directly on material supply and behavioral change advocacy. The downstream components — including parasitological diagnosis through blood testing and timely, full-course treatment — place higher demands on the individual capacities of doctors in public and private health facilities, community health workers, laboratory technicians, pharmacists, and even drug retailers, calling for greater attention from governments and external partners.
Meanwhile, most funding from the UK, the GF, and UNICEF showed no statistically significant impact on improving cascade coverage. Three possible explanations exist: 1) funding data exhibited little pattern, particularly for the UK amid Brexit and accompanying policy shifts (11); 2) considering the substantial investment needed to sustain various measures throughout the P&C system, donors’ influence may lie in maintaining existing coverage; and 3) increased funding and materials alone had limited impact on service accessibility and availability, indicating the considerable mediating effect of overall health system capacity, as noted above.
Effective implementation of national malaria strategic plans requires a systematic approach involving enhanced political will and governance mechanisms, indigenous medical manufacturing capacity, well-maintained supply chains, and improved primary and secondary health services (12). Our results suggest that capacity building and quality assurance at the farthest end of the health system are urgently needed. For example, to correctly manage non-malarial febrile illnesses (13), strengthen supply chain management and stock-out reporting (14), and support public and private health facilities — including clinics, drug shops, and pharmacies — in their compliance with treatment guidelines based on adequate drug supply (15).
This study has several limitations: 1) seeing the retrospective nature of the DHS program, the data may be subject to recall bias; 2) due to the limited surveyed groups in the DHS, service coverage could only be measured in children under age 5 and women aged 15–49, rather than the entire population; and 3) the domestic malaria funding (as a controlled variable) could not be broken down into detailed programs. Overall, this study suggests that strengthening capacity at the farthest end of the health system, supported by increased global funding, may offer a pathway to avoid the gloomy outlook for malaria control and elimination.
HTML
Data Sources
Indicators


Statistical Analysis
The Cascade of Malaria P&C
Funding to the Cascade and Effects
| Citation: |

|