
 Download:


-
Introduction: As China’s population rapidly ages, concerns have emerged about whether increased longevity among older adults is accompanied by improvements in health status.
Methods: This study analyzed data from the 2010 and 2020 Chinese censuses to estimate healthy life expectancy (HLE) at age 60 and examined changes in urban-rural disparities and their driving factors. We applied the Sullivan method to estimate gender- and residence-specific HLE, while using the continuous change decomposition method to analyze how mortality and health status contributed to urban-rural differences.
Results: Between 2010 and 2020, both the absolute years of HLE and its proportion of total life expectancy increased, with the urban-rural gap narrowing over time. However, the primary driver of urban-rural HLE disparities has shifted from mortality levels to health status, a pattern more pronounced among men. Decomposition analysis further reveals that compared to 2010, the key age groups contributing to urban-rural HLE disparities in 2020 have shifted to older ages, reflecting a transition in health inequalities as the population ages. These findings suggest that while HLE among China’s older population has improved, the nature of health inequalities is evolving.
Conclusions: Future public health policies should place greater emphasis on addressing non-fatal health conditions, particularly in rural areas and among the oldest-old, by improving the accessibility and quality of health services to promote healthy aging and reduce urban-rural health disparities.
-
In 2023, China’s average life expectancy (LE) reached 78.6 years, nearing the 2030 target of 79.0 years set by Healthy China 2030, signaling continuous improvements in longevity (1). While mortality provides insight into population health, population aging coupled with epidemiologic transition may cause divergence between mortality and morbidity. Specifically, increases in LE are often accompanied by more years lived in poor health. As such, public health focus should shift toward achieving “healthy longevity,” with healthy life expectancy (HLE) serving as a critical indicator that reflects both quality and length of life (2). Moreover, considering that LE at birth is less sensitive to mortality changes in older adults, LE and HLE of the older population have become more suitable measures for evaluating population health in aging societies. Previous research has examined trends in HLE and its disparities among China’s older population (3-4). However, the distinct contributions of mortality and morbidity, as well as the specific age groups contributing to these differences, remain underexplored. This study, using mortality and self-rated health data from the 2010 and 2020 censuses, applied the Sullivan method to estimate LE and HLE at age 60 by urban-rural residence. Additionally, we conducted continuous change decomposition analysis to assess the age-specific contributions of mortality and morbidity to the urban-rural HLE gap. Our findings reveal that older adults have become “longer-lived and healthier” between 2010 and 2020. The narrowing of urban-rural differences in HLE was the main driver behind the reduction in LE gaps. However, morbidity’s contribution to urban-rural HLE gaps is increasing, particularly among older men, where the main contribution has shifted from mortality to morbidity. Furthermore, the age groups driving these differences are themselves aging over time. While China’s older population demonstrates a clear trend toward the compression of morbidity, non-fatal health outcomes continue to significantly impact health disparities between population groups. This suggests that as longevity continues to improve, it is essential to not only ensure that additional years are spent in good health but also to pay closer attention to non-fatal health conditions and quality of life among rural populations and the oldest old.
Age-specific mortality and morbidity rates by gender and residence for 2010 and 2020 were derived from the sixth and seventh National Population Censuses. To obtain more accurate estimates of old-age mortality, we smoothed observed single age-specific mortality rates by fitting the Kannisto model for adults aged 80 and older, stratified by gender, residence, and time period (5). In this study, morbidity was measured using self-rated health (SRH). Health data for individuals aged 60 and above were collected through the question, “Your health status is ____?” Responses of “healthy” and “mostly healthy” were categorized as good SRH, while responses of “unhealthy but able to take care of yourself” and “disabled” were classified as poor SRH (6).
Based on mortality data, we constructed abridged life tables (with an open age group set at 90 years and older) for 2010 and 2020 by gender and urban-rural residence. Using age-specific morbidity rates for the corresponding populations, we employed the Sullivan method (7) to estimate HLE and unhealthy life expectancy (UHLE) at age 60. To analyze urban-rural disparities in HLE, we applied the continuous change decomposition method (8), which allowed us to decompose the urban-rural gaps for both 2010 and 2020. This approach facilitated the estimation of overall and age-specific contributions of mortality and disability. Statistical analyses were conducted using R (version 4.3.2; the R Core Team, Vienna, Austria).
Between 2010 and 2020, HLE increased in both absolute terms (years) and relative terms (proportion of HLE to LE) for both men and women, while the urban-rural gap in LE narrowed. In 2010, urban men had an LE of 21.95 years, 3.04 years longer than rural men (18.91 years). By 2020, this gap had decreased to 1.83 years (23.27 vs. 21.44 years). This narrowing primarily resulted from faster improvements in rural men’s LE, which increased by 2.53 years compared to a 1.32-year increase among urban men during this period. Similar patterns were observed among women — the urban-rural gap in LE decreased from 2.91 years (24.96 vs. 22.05 years) to 2.03 years (26.72 vs. 24.69 years) between 2010 and 2020, driven by an increase of 2.64 years in rural women’s LE compared to a 1.76-year increase in urban women’s LE. However, the reduction in the urban-rural gap for women (0.88 years) was smaller than that for men (1.21 years) (Figure 1).
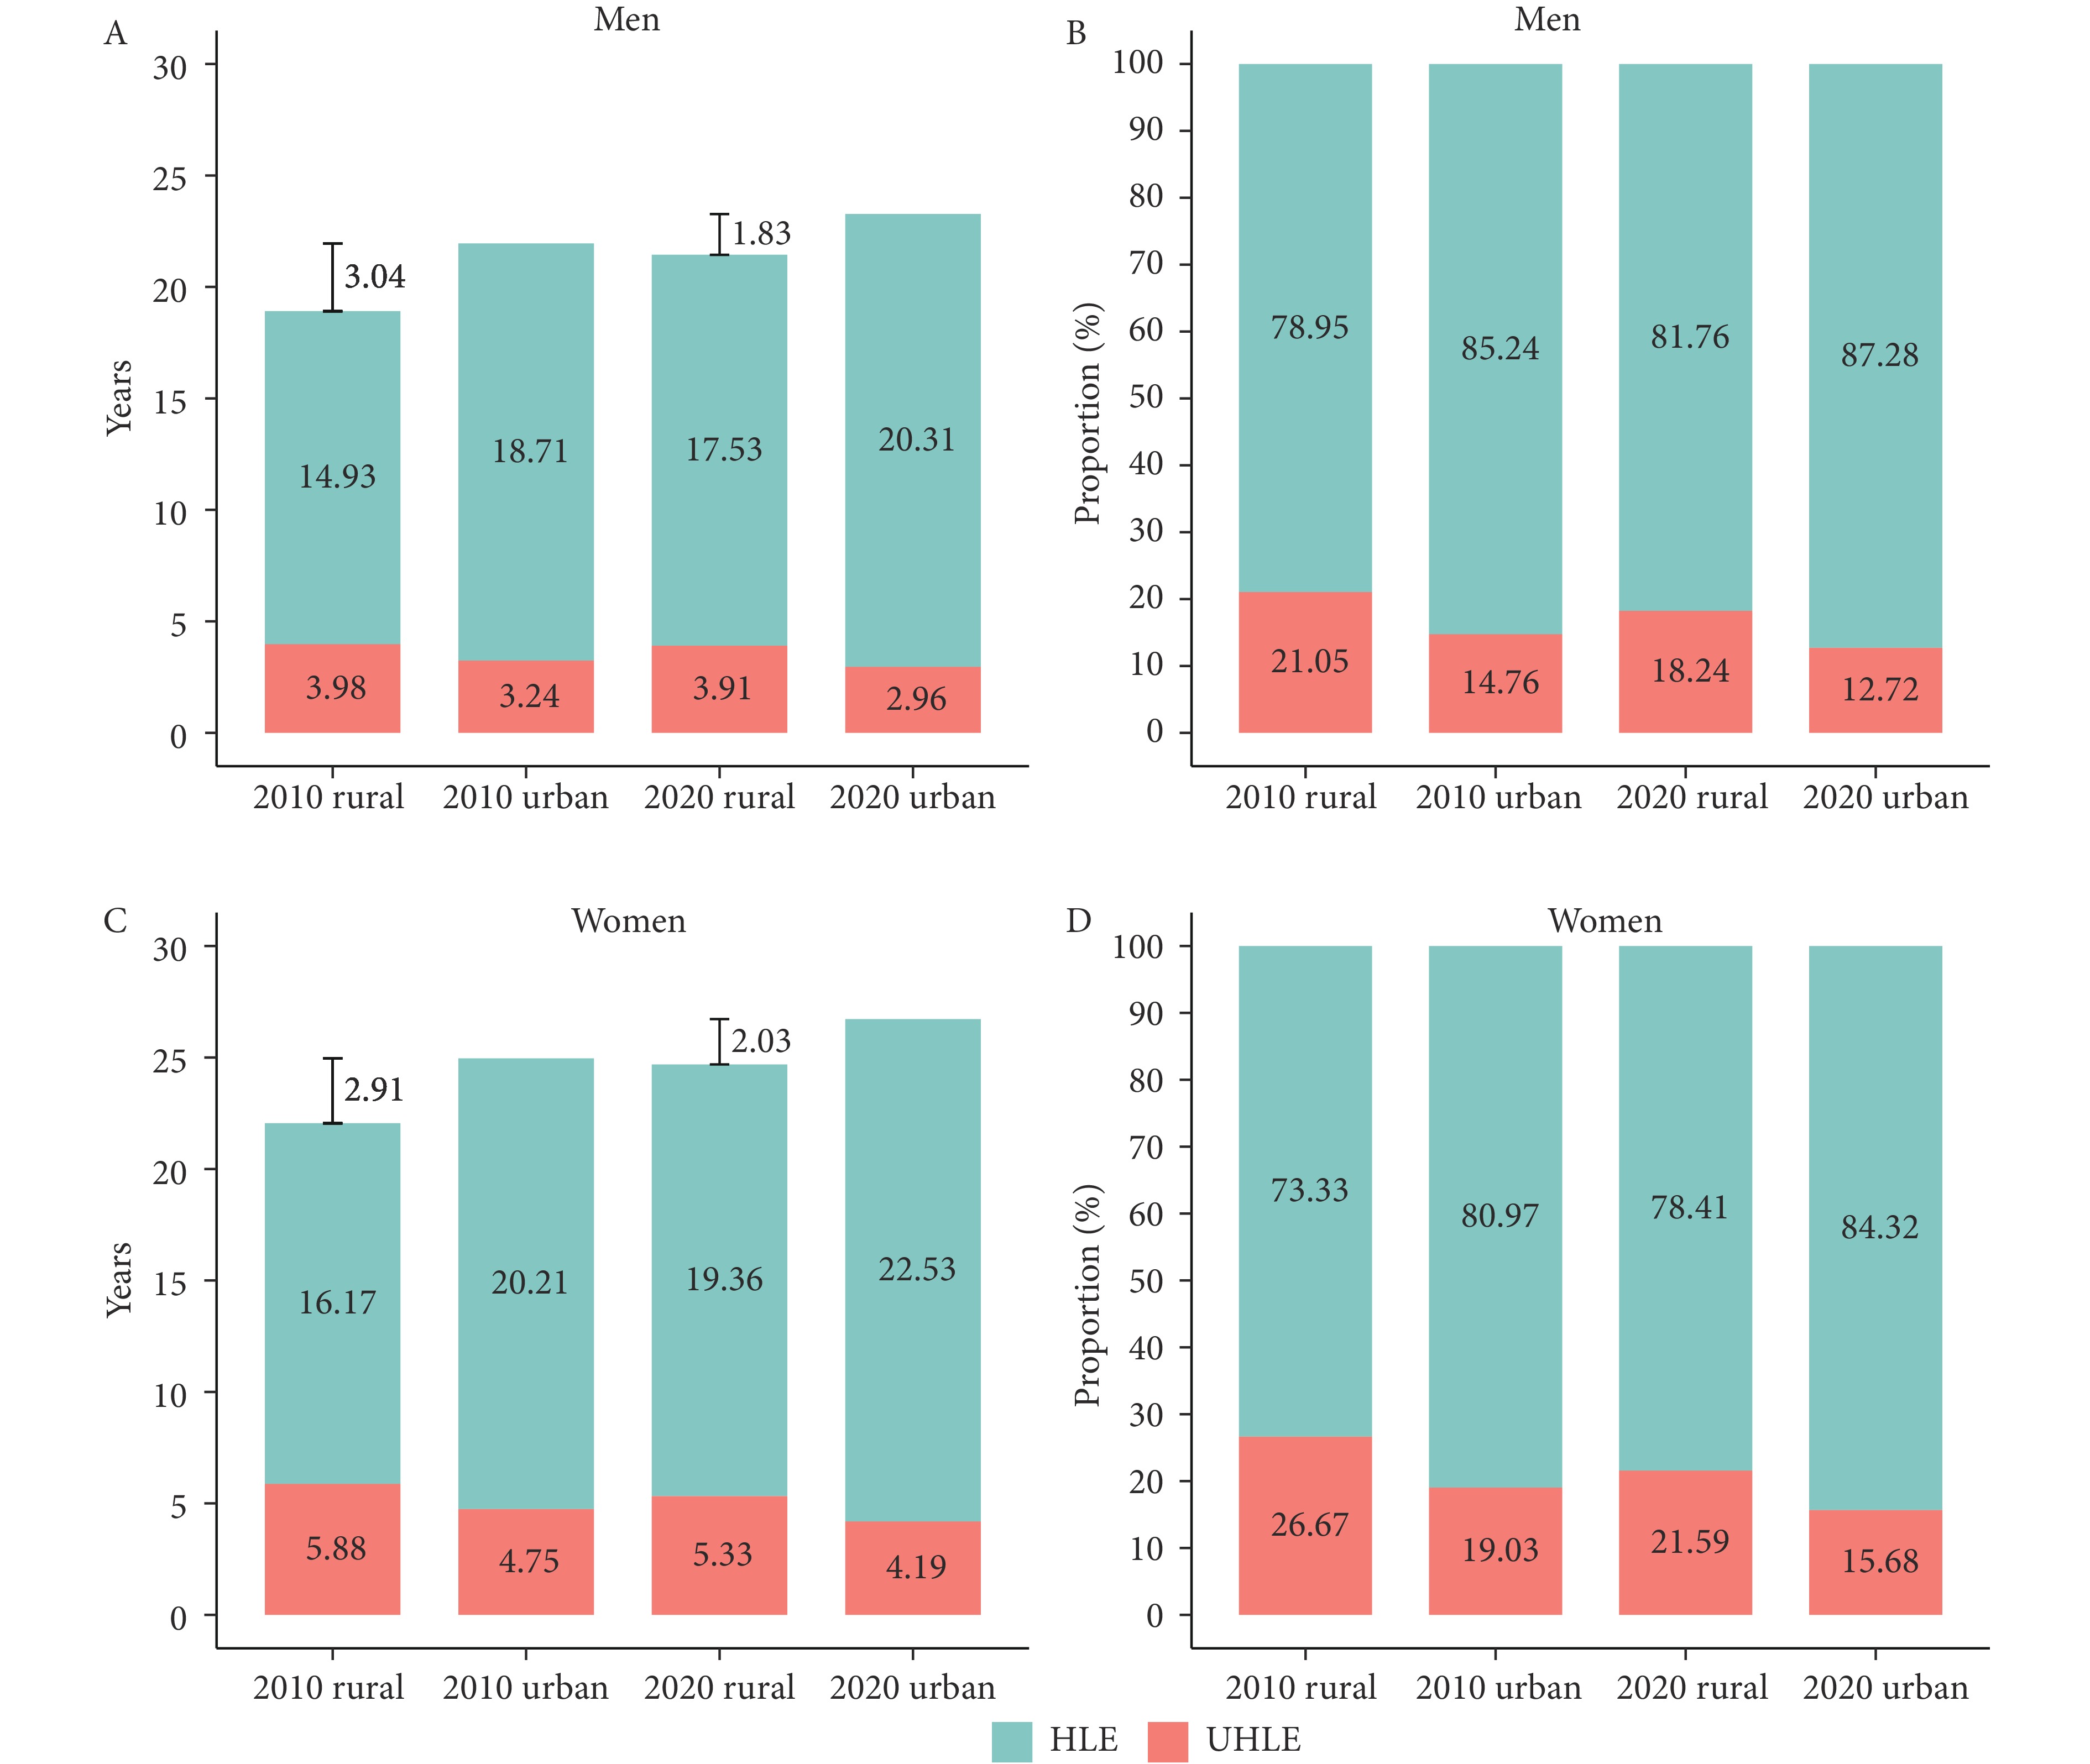 Figure 1.
Healthy life expectancy and unhealthy life expectancy at age 60 by gender and residential area in 2010 and 2020. (A) HLE and UHLE in absolute terms among men; (B) HLE and UHLE in relative terms among men; (C) HLE and UHLE in absolute terms among women; (D) HLE and UHLE in relative terms among women.
Note: The vertical lines and numbers in the two charts on the left indicate the urban-rural disparities in life expectancy for each gender in 2010 and 2020.
Abbreviation: HLE=healthy life expectancy, UHLE=unhealthy life expectancy.
Decomposition results are presented in Table 1. In 2010, the urban-rural gap in HLE was larger for women than for men (4.04 vs. 3.78 years). Furthermore, the contributions of mortality and morbidity to this gap varied between genders. For men, 2.09 years (55.29%) of the gap was attributed to mortality, while 1.69 years (44.71%) were due to morbidity. In contrast, the gap among women was primarily driven by morbidity, accounting for 2.22 years (54.95%). By 2020, although the urban-rural gap in HLE remained larger for women than for men (3.18 vs. 2.78 years), morbidity became the dominant contributor to the gap for both genders (men: 1.43 years, 51.39%; women: 1.79 years, 56.29%).
Urban-rural HLE gap and its decomposition results Men Women 2010 2020 2010 2020 HLE, years (1) Urban 18.71 20.31 20.21 22.53 (2) Rural 14.93 17.53 16.17 19.35 (3) Difference 3.78 2.78 4.04 3.18 Contribution, years (%) (4) Mortality 2.09 (55.29) 1.35 (48.61) 1.82 (45.05) 1.39 (43.71) (5) Morbidity 1.69 (44.71) 1.43 (51.39) 2.22 (54.95) 1.79 (56.29) Note: The rows of the table have the following relationships: (3)=(1)−(2)=(4)+(5).
Abbreviation: HLE=healthy life expectancy.Table 1. Decomposition of the urban-rural gap in healthy life expectancy at age 60 by gender in 2010 and 2020.
Figure 2 further displays age-specific contributions of mortality and morbidity to the urban-rural gap by gender. In 2010, the largest contribution came from the 70–74 age group for both men (0.83 years, 22.06%) and women (0.89 years, 22.05%). By 2020, this shifted to the 75–79 age group, with contributions of 0.49 years (17.62%) for men and 0.64 years (20.12%) for women. In contrast to 2010, the contributions across the under-85 age groups in 2020 became more evenly distributed, with smaller differences in their respective values, particularly for men.
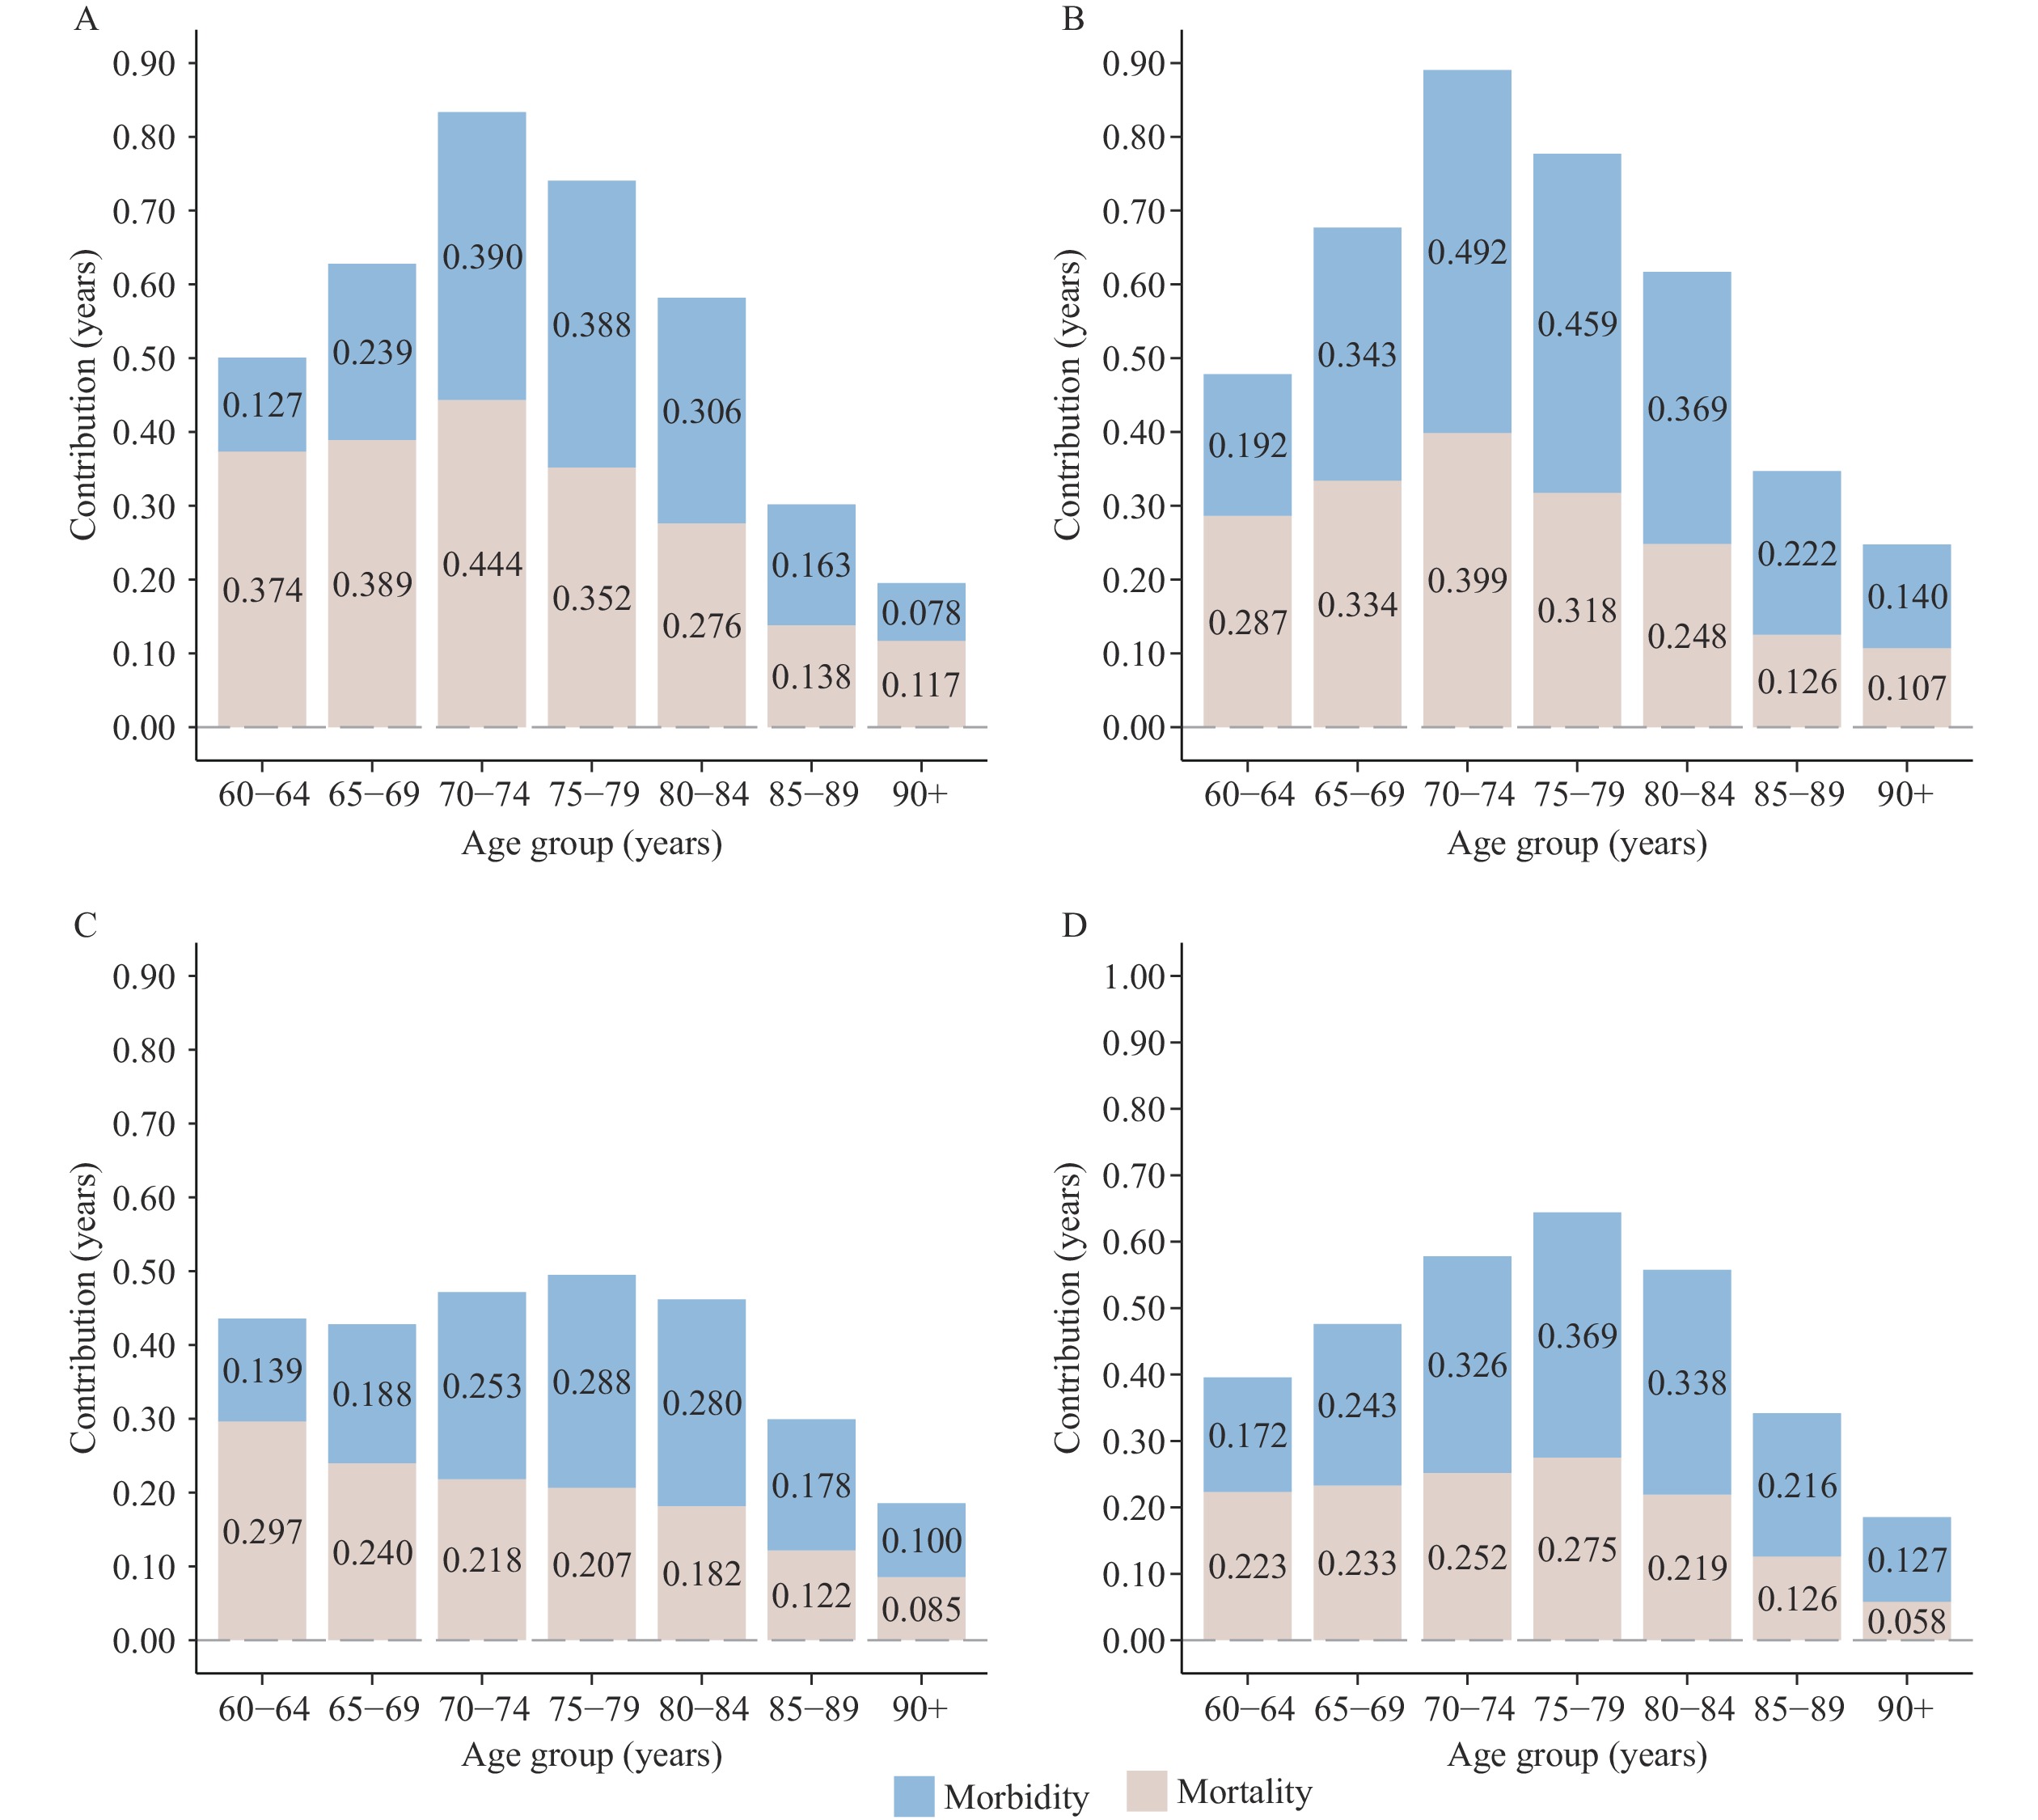 Figure 2.
The contributions of mortality and morbidity to the urban-rural gap in healthy life expectancy by gender and 5-year age groups in 2010 and 2020. (A) Age-specific contributions among men in 2010; (B) Age-specific contributions among women in 2010; (C) Age-specific contributions among men in 2020; (D) Age-specific contributions among women in 2020.
Abbreviation: HLE=healthy life expectancy. -
Based on the most recent census data from 2010 and 2020, we observed an upward trend in LE, HLE, and the ratio of HLE to LE among the older population, indicating a general expansion of healthy lifespan. Notably, the narrowing urban-rural gap in HLE suggests that older adults in rural areas have experienced greater health benefits from social development. However, the contribution of morbidity to the urban-rural disparity in HLE has become more pronounced, with older age groups increasingly contributing to this gap. These findings suggest that moving forward, non-fatal health conditions, including overall well-being, will play a greater role in shaping health disparities in aging populations, relative to mortality.
Our estimates of LE and HLE are consistent with previous studies using the same data source (9). Researchers have also found that the expansion of healthy lifespan was more pronounced in rural areas, with reductions in morbidity contributing more to HLE growth than declines in mortality. A possible explanation is that rural areas have experienced faster improvements in socioeconomic and healthcare conditions in recent years. Additionally, a selective effect may have led to a healthier profile among surviving older adults in rural areas at the time of the survey.
Previous studies on HLE decomposition often used counterfactual methods, which are best suited for comparing HLE at different time points within the same population. In contrast, this study applies a novel decomposition approach to estimate the contributions of mortality and morbidity to HLE differences between urban and rural populations at a single time point. We also broke these contributions down by age group, providing new insights to help policymakers better address the urban-rural HLE gap.
From a gender perspective, the male-female health-survival paradox (10) has consistently positioned morbidity as the primary driver of urban-rural HLE disparities among women. Over time, morbidity’s contribution has increased significantly, and among men, it has surpassed mortality to become the dominant factor. Age-specific analysis revealed that the key age groups contributing to urban-rural disparities shifted to older cohorts in 2020 compared to 2010. Concurrently, the contributions from age groups under 85 have become more evenly distributed. These findings emphasize the importance of focusing on quality of life improvements for all older adults rather than merely extending lifespan. Targeted interventions should prioritize women and younger older adults to create a more comprehensive approach to healthy aging.
The transition from mortality-driven to morbidity-driven health disparities in aging populations necessitates a fundamental shift in public health and elder care policies. As older adults’ health needs become increasingly influenced by chronic conditions and non-fatal health issues, implementing comprehensive health policies that prioritize long-term disease prevention, management, and overall well-being is critical, rather than solely focusing on extending life expectancy. For rural areas, where morbidity reduction has shown the most promise in improving health outcomes, policymakers should enhance access to quality healthcare services and improve health literacy. Furthermore, efforts should focus on improving quality of life for women and the oldest-old, as these groups experience higher morbidity rates that significantly affect their health outcomes.
A limitation of this study is that SRH may be influenced by various factors, including cultural norms, personal expectations, and understanding of health information (11). In rural areas, where healthcare quality and accessibility are generally lower, older adults may not fully recognize their health conditions, potentially leading to an overestimation of their SRH. Nevertheless, as the data were obtained from the Census, the potential selection effect is likely negligible, given the comprehensive coverage and representativeness of the dataset. Despite its subjectivity, SRH captures an individual’s overall sense of well-being, offering a broader perspective compared to objective health measures.
In conclusion, our study provides a comprehensive and detailed analysis of urban-rural inequalities in healthy longevity among China’s aging population, using a novel decomposition approach to distinguish between the impacts of mortality and morbidity on HLE. This framework addresses a significant gap in HLE research and can be applied to future studies.
-
The data used in this study were obtained from the Sixth and Seventh National Population Censuses. As these datasets contain aggregated information and do not include identifiable personal data, ethical approval and informed consent were not required.
HTML
| Citation: |

|