
 Download:


-
Brucellosis is a globally distributed zoonotic disease that causes substantial economic losses in agriculture and poses a significant public health concern worldwide (1). Human brucellosis cases have been documented across all 31 provincial-level administrative divisions (PLADs) in China (2). Case numbers have shown continuous growth in recent years, driven by multiple socioeconomic factors, particularly the expansion of sheep and goat livestock industries and increased economic development (3). Understanding the epidemiological change between southern and northern areas is therefore crucial for developing targeted and effective control measures. This study aims to elucidate the epidemiological evolutionary characteristics of human brucellosis and examining the relationships among multiple contributing social factors. These insights will contribute to the development of tailored countermeasures to combat the spread of brucellosis.
-
The Qinling-Huaihe Line served as the geographical demarcation between northern and southern areas China, encompassing 16 northern PLADs and 15 southern PLADs. Case numbers and incidence rates were obtained from the National Information System for Disease Control and Prevention of China and the China Health Statistical Yearbook. Economic indicators were sourced from the National Bureau of Statistics (http://www.stats.gov.cn/) (
Supplementary Table S1 ). The geographic distribution and biotype profiles of 1,643 Brucella strains documented from 1950 to 2016 were compiled from previously published sources (4), while subsequent strain data from 2017 to 2021 were extracted from annual infectious disease surveillance reports in China.Data processing and analysis were performed using Excel 2016 (Microsoft, Redmond, WA, USA). A heatmap was generated using an online data analysis pipeline (https://www.chiplot.online/#Line-plot), and disease growth trends were visualized using semilogarithmic curves. Correlation analysis was performed using Pearson’s correlation coefficient by R Studio (Ross Ihaka and Robert Gentleman, Boston, MA, United States).
-
The epidemic evolution of human brucellosis can be categorized into three distinct phases: 1) severe epidemic period (1950–1985), 2) primary control period (1986–1995), and 3) continuous increase period (1996–present). The reported case progression demonstrates a clear transmission pattern: originating in the northeast, spreading northward, then moving southwest, and ultimately reaching China’s southern most point — Hainan Island (Figure 1). The number of reported cases has increased dramatically, from 8 in 1950 to 69,767 in 2021, with the incidence rate rising from 0.002/100,000 to 4.949/100,000 during this period (Figure 1).
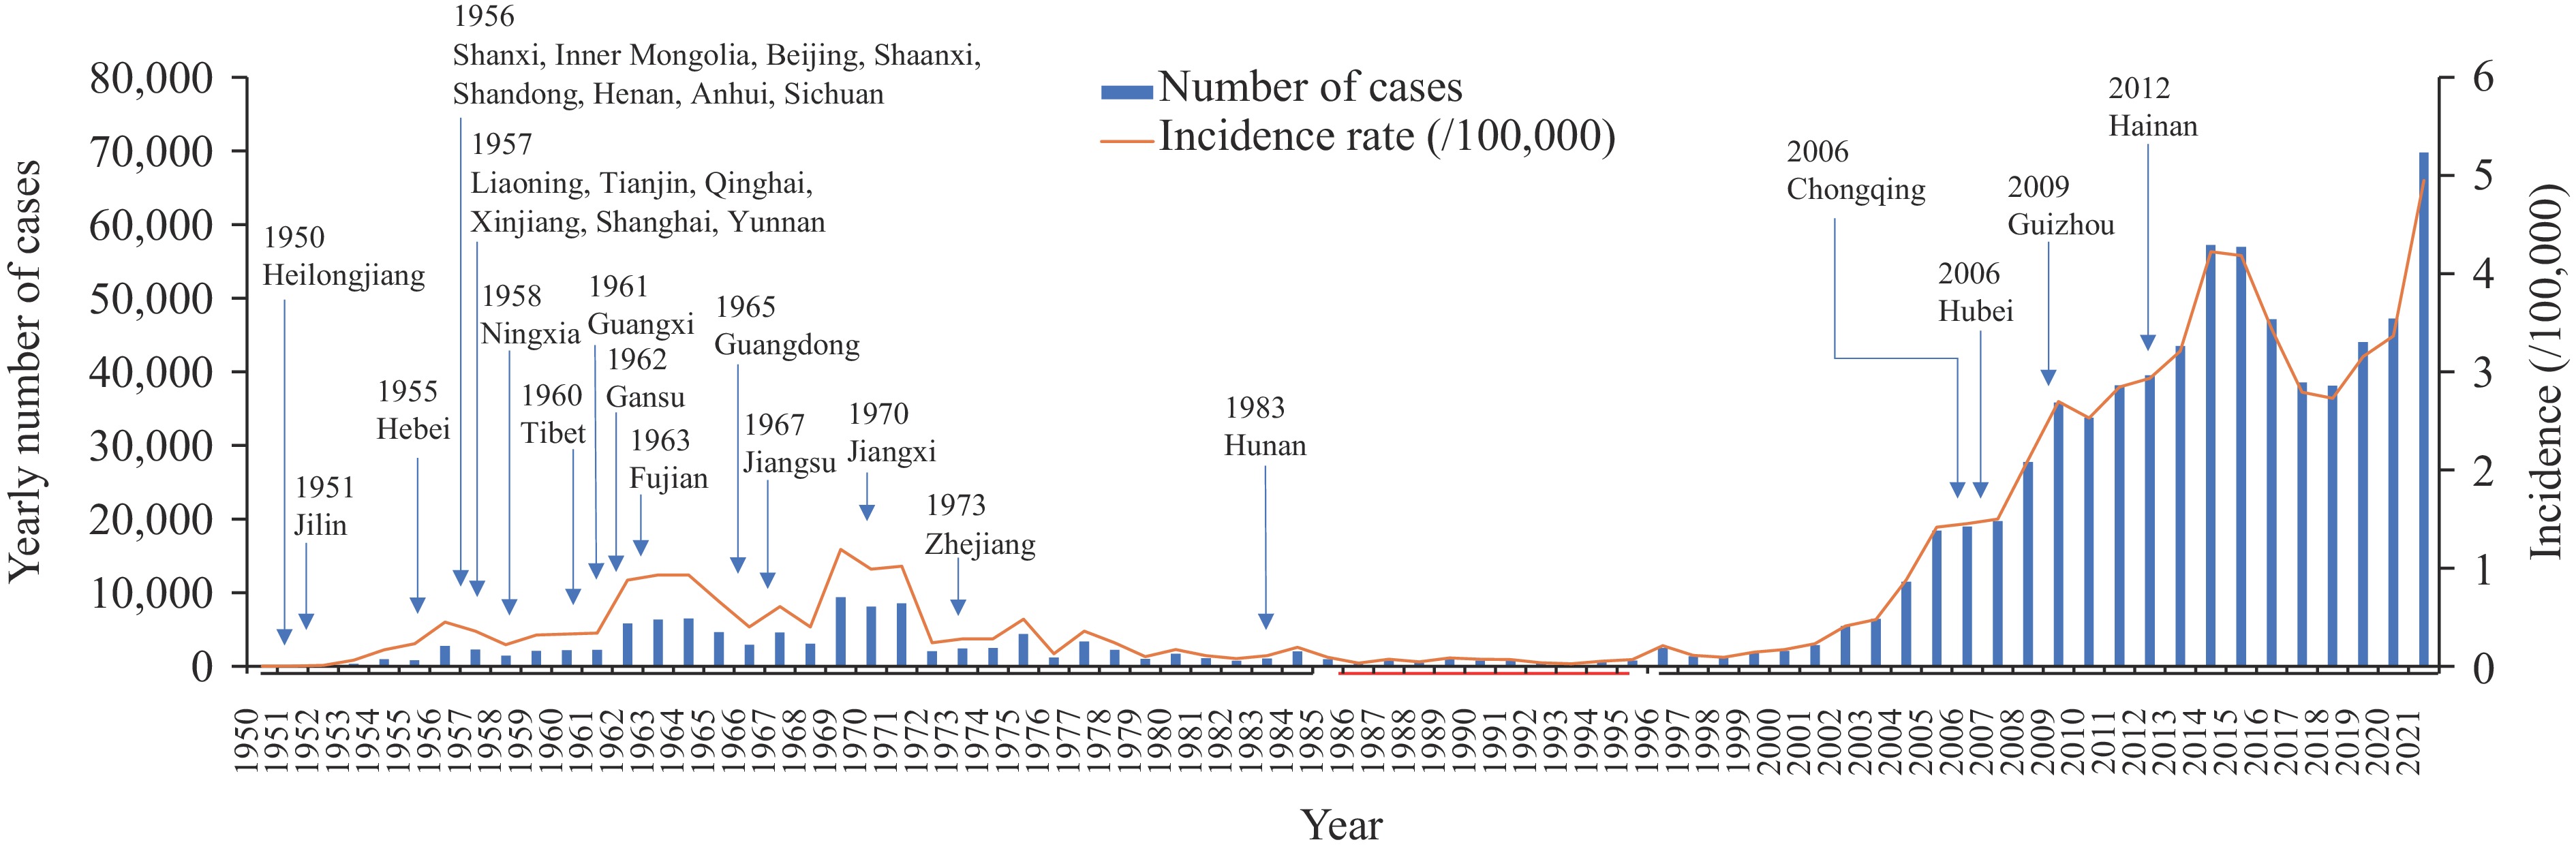 Figure 1.
The changing trend of reported cases and incidence rate of human brucellosis from 1950-2021.
Note: Blue arrow indicates the first reported case of human brucellosis in each PLAD or region. The bold black line parallel to the X-axis represents the duration of two epidemic periods, and the bold red line indicates the duration of the control period of human brucellosis in China.
Abbreviation: PLAD=provincial-level administrative division.
Out of the 815,347 reported cases, 796,987 (97.7%) occurred in the northern, while only 18,360 (2.3%) were reported in the southern. Although the southern has experienced a considerable increase in cases since 2010, the northern continues to bear the majority of cases (Figure 2). The incidence rate of human brucellosis in the southern remained below 0.463/100,000 in 2015 and 1.485/100,000 in 2021 (
Supplementary Table S1 ).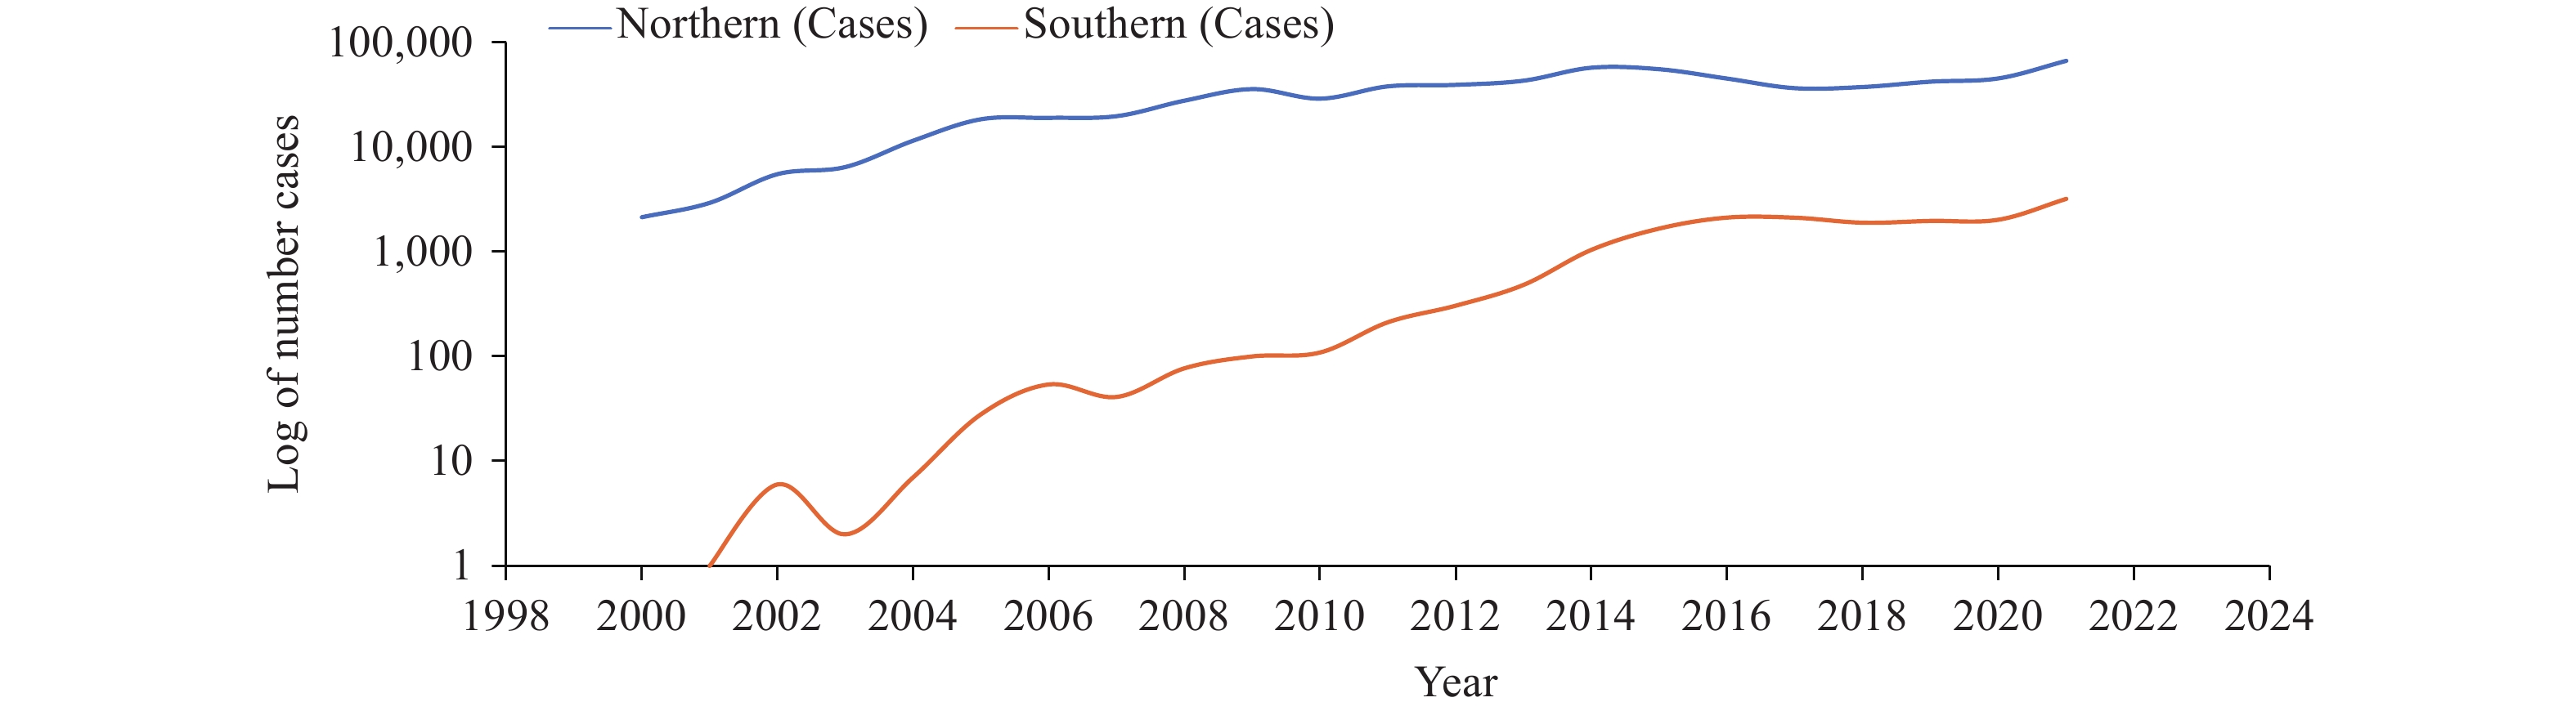 Figure 2.
Growth trends of human brucellosis between northern and southern China.
Note: There were no reported cases from Hong Kong SAR; Macao SAR; and Taiwan, China; the incidence rate in these three regions was 0/100,000.
Abbreviation: SAR=Special Administrative Region.
From 2000 to 2021, both the fixed base ratio growth rate of cases and incidence rate showed a consistent upward trend nationally, while the sequential growth rate exhibited an initial increase followed by a decrease and subsequent increase (Table 1). A parallel pattern emerged between northern and southern regions, where the fixed base ratio growth rate maintained steady increases, while the sequential growth rate fluctuated between periods of growth and decline.
Year Number of cases Incidence rate (/100 000) Cases Fixed base ratio
growth rate (%)Sequential
growth rate (%)Incidence
(/100 000)Fixed base ratio
growth rate (%)Sequential
growth rate (%)2000 2,126 − − 0.171 − − 2001 2,918 37.25 37.25 0.229 34.03 34.03 2002 5,505 158.94 88.66 0.411 139.99 79.05 2003 6,448 203.29 17.13 0.478 179.16 16.32 2004 11,472 439.60 77.92 0.882 415.18 84.55 2005 18,416 766.23 60.53 1.416 727.03 60.53 2006 19,013 794.31 3.24 1.454 748.86 2.64 2007 19,721 827.61 3.72 1.500 775.83 3.18 2008 27,767 1,206.07 40.80 2.101 1,126.80 40.07 2009 35,816 1,584.67 28.99 2.696 1,474.37 28.33 2010 33,772 1,488.52 −5.71 2.530 1,377.06 −6.18 2011 38,151 1,694.50 12.97 2.845 1,560.95 12.45 2012 39,515 1,758.65 3.58 2.933 1,612.08 3.08 2013 43,486 1,945.44 10.05 3.212 1,774.84 9.51 2014 57,222 2,591.53 31.59 4.223 2,364.97 31.48 2015 56,989 2,580.57 −0.41 4.183 2,341.80 −0.94 2016 47,139 2,117.26 −17.28 3.439 1,907.47 −17.79 2017 38,554 1,713.45 −18.21 2.794 1,531.12 −18.75 2018 39,296 1,748.35 1.92 2.829 1,551.43 1.25 2019 44,036 1,971.31 12.06 3.153 1,740.75 11.46 2020 47,245 2,122.25 7.29 3.365 1,864.62 6.73 2021 69,767 3,181.61 47.67 4.949 2,788.97 47.05 Table 1. Epidemic growth trends of cases and incidence from 2000 to 2021.
The period between 2011 and 2021 represented the peak of reported cases, accounting for 63.6% (520,197/818,413) of all documented incidents. This was followed by the periods 2001–2010, 1961–1970, and 1971–1980 (Figure 3A). The lowest case numbers were recorded during 1991–2000 (Figure 3A). At the provincial level, the number of cases can be stratified into four distinct ranks (I–Ⅳ). Rank I comprises solely Inner Mongolia, which reported the highest number of cases in mainland China, representing 37.6% (307,595/818,413) of total cases. Rank II encompasses five northern PLADs, while rank III includes six PLADs. Rank Ⅳ, representing the lowest case numbers, consists of all southern PLADs (Figure 3A). While approximately 98% of the reported cases were concentrated in the northern, the Southern experienced a notable increase in case reports from 2014 onward.
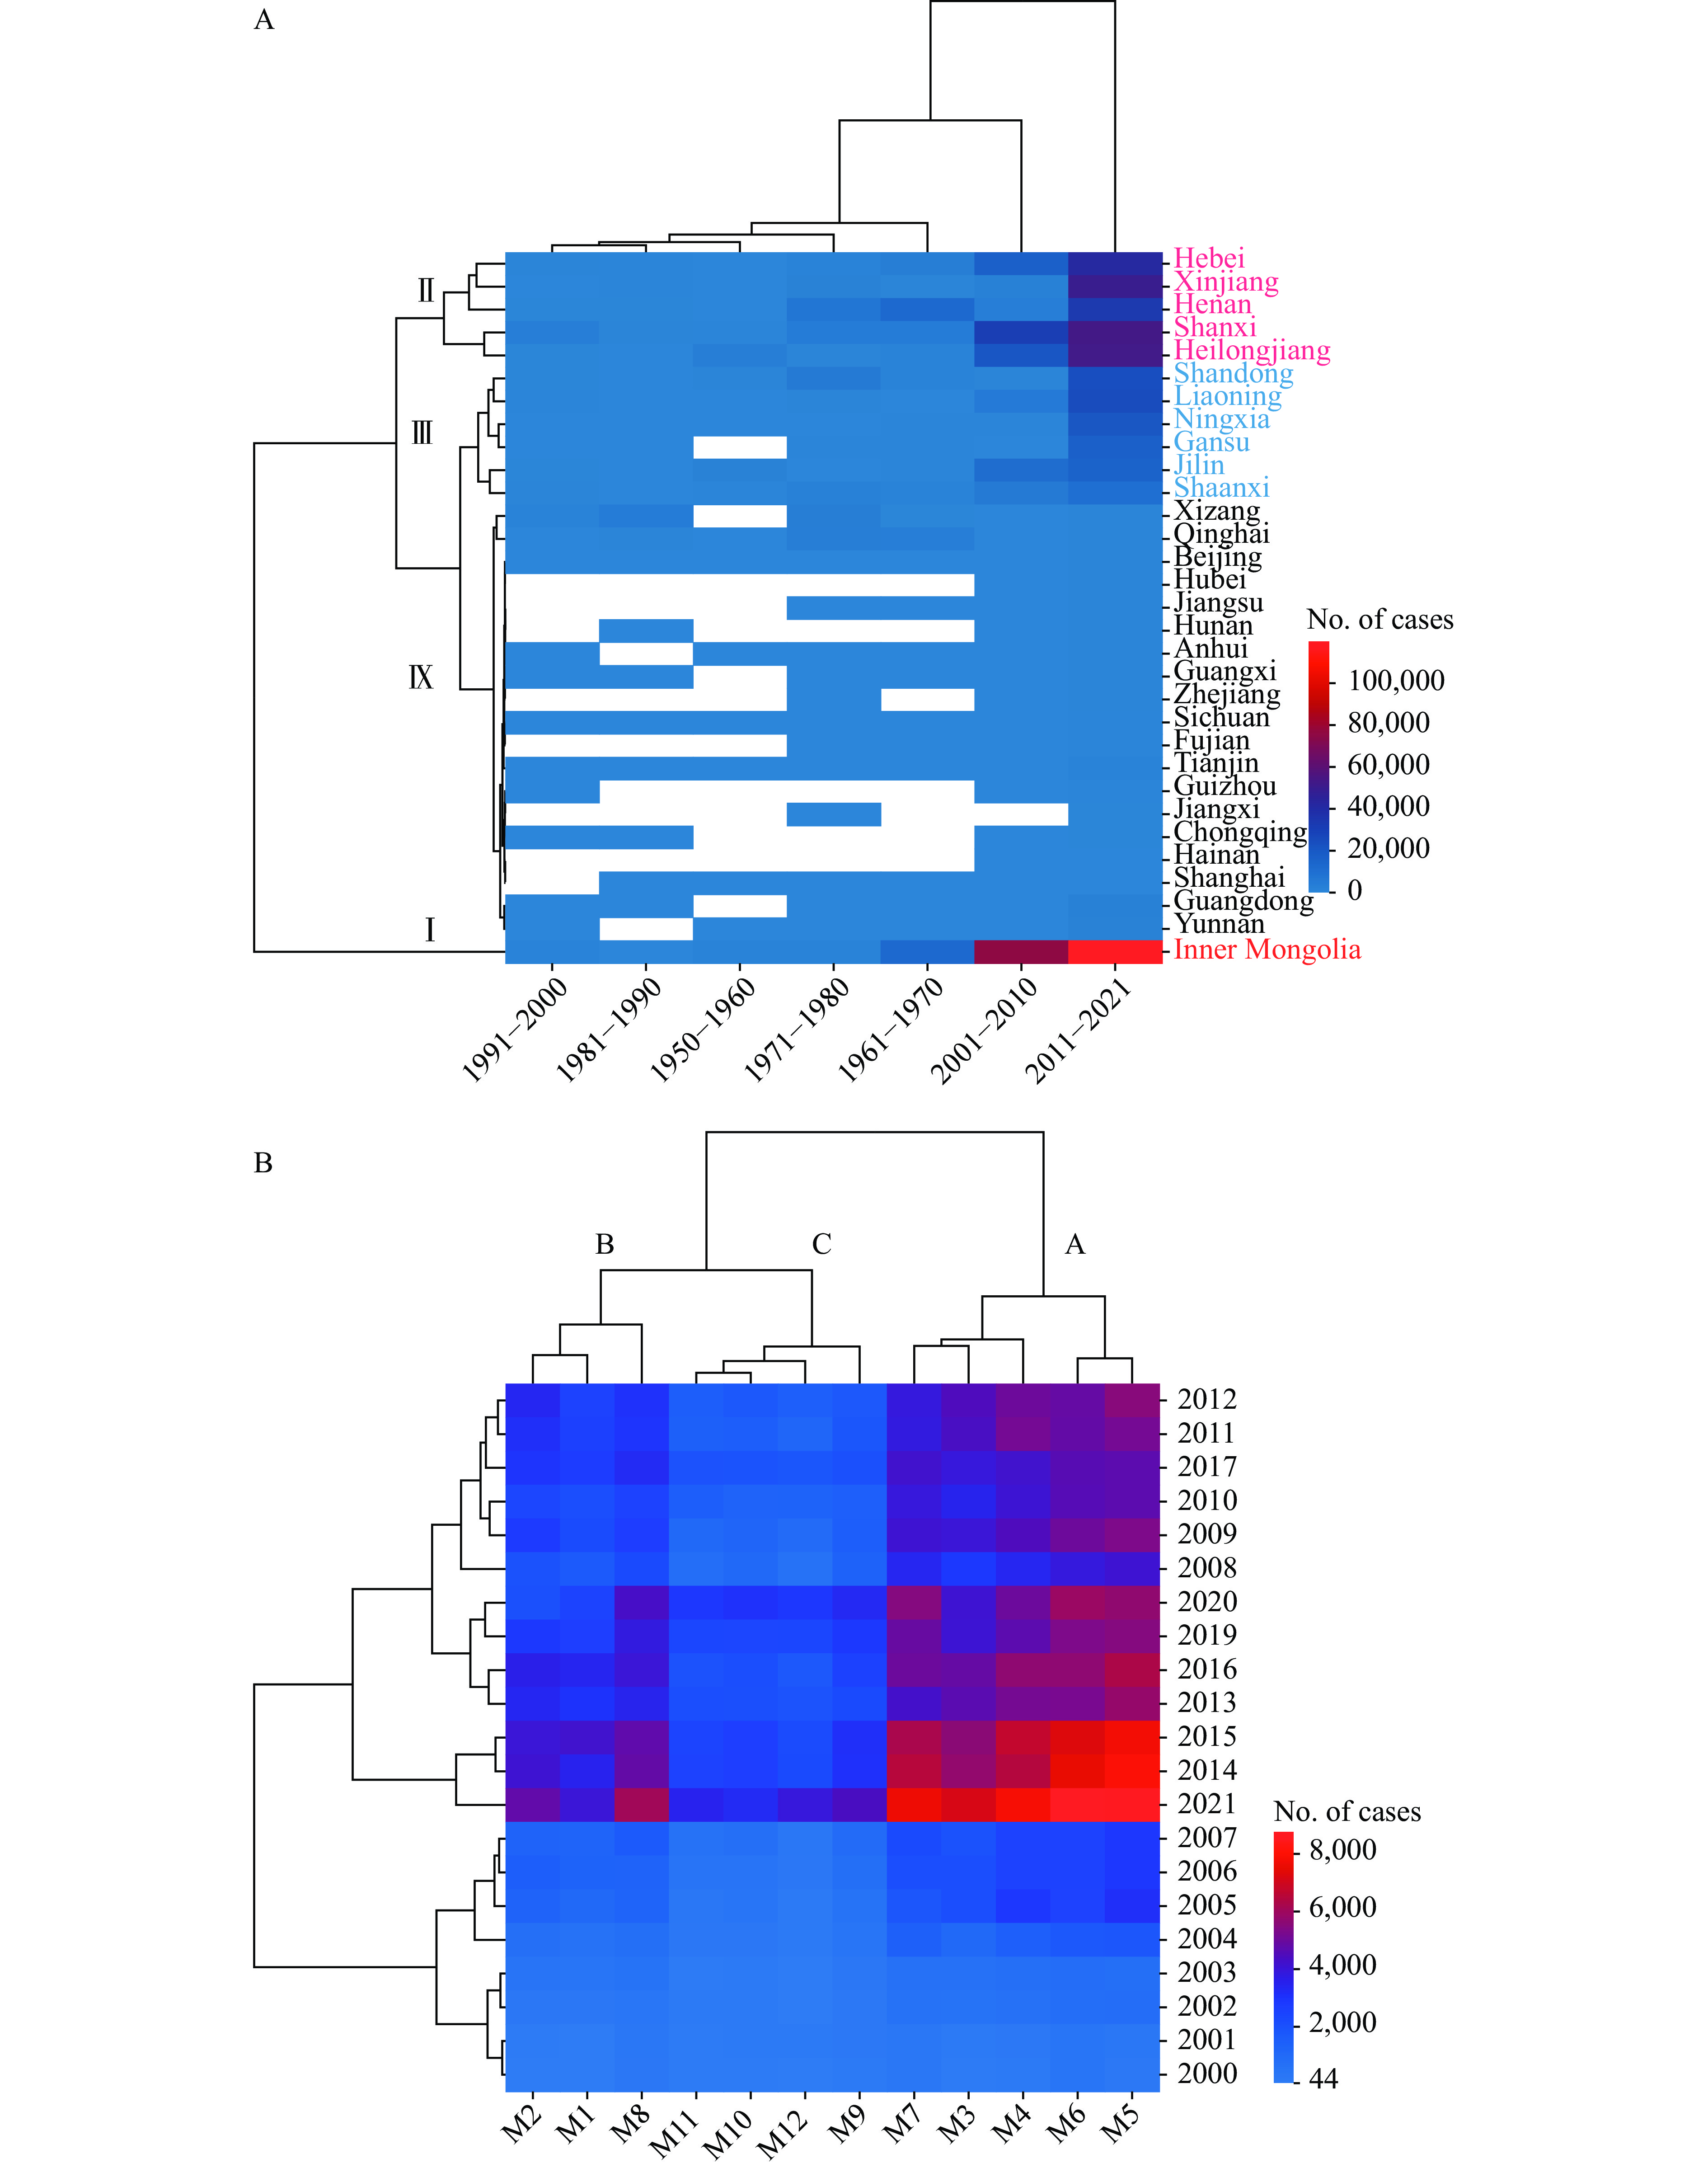 Figure 3.
Distribution features of human brucellosis in northern and southern China. (A) Time and regions; (B) seasonal distribution.
The seasonal distribution patterns show a remarkable similarity between northern and southern regions, with case numbers reaching a peak in May and trough in November across both areas (Figure 3B). The seasonal distribution of cases can be categorized into three distinct groups: group A, spanning March to July, exhibits the highest number of reported cases; group B, encompassing January, February, and August, shows intermediate levels; and group C, extending from September to December, demonstrates the lowest case numbers (Figure 3B).
Analysis of 2,787 Brucella strains isolated between 1950 and 2021. While B. melitensis and B. abortus were predominantly distributed in the northern, B. suis and B. canis strains were primarily found in the southern. Notably, B. melitensis has emerged as the dominant species nationwide, with substantial isolates recovered from southern PLADs, including Guangdong, Zhejiang, and Hainan. B. abortus strains were predominantly isolated from Inner Mongolia and Sichuan PLADs, while B. suis strains were distributed across Inner Mongolia, Ningxia, Guangxi, Guangdong, and Hainan. On its part, B. canis strains were primarily isolated from Beijing, Jiangsu, and Guangxi. There was a clear transition from multiple dominant species before 2000 to the current single predominance of B. melitensis (Figure 4).
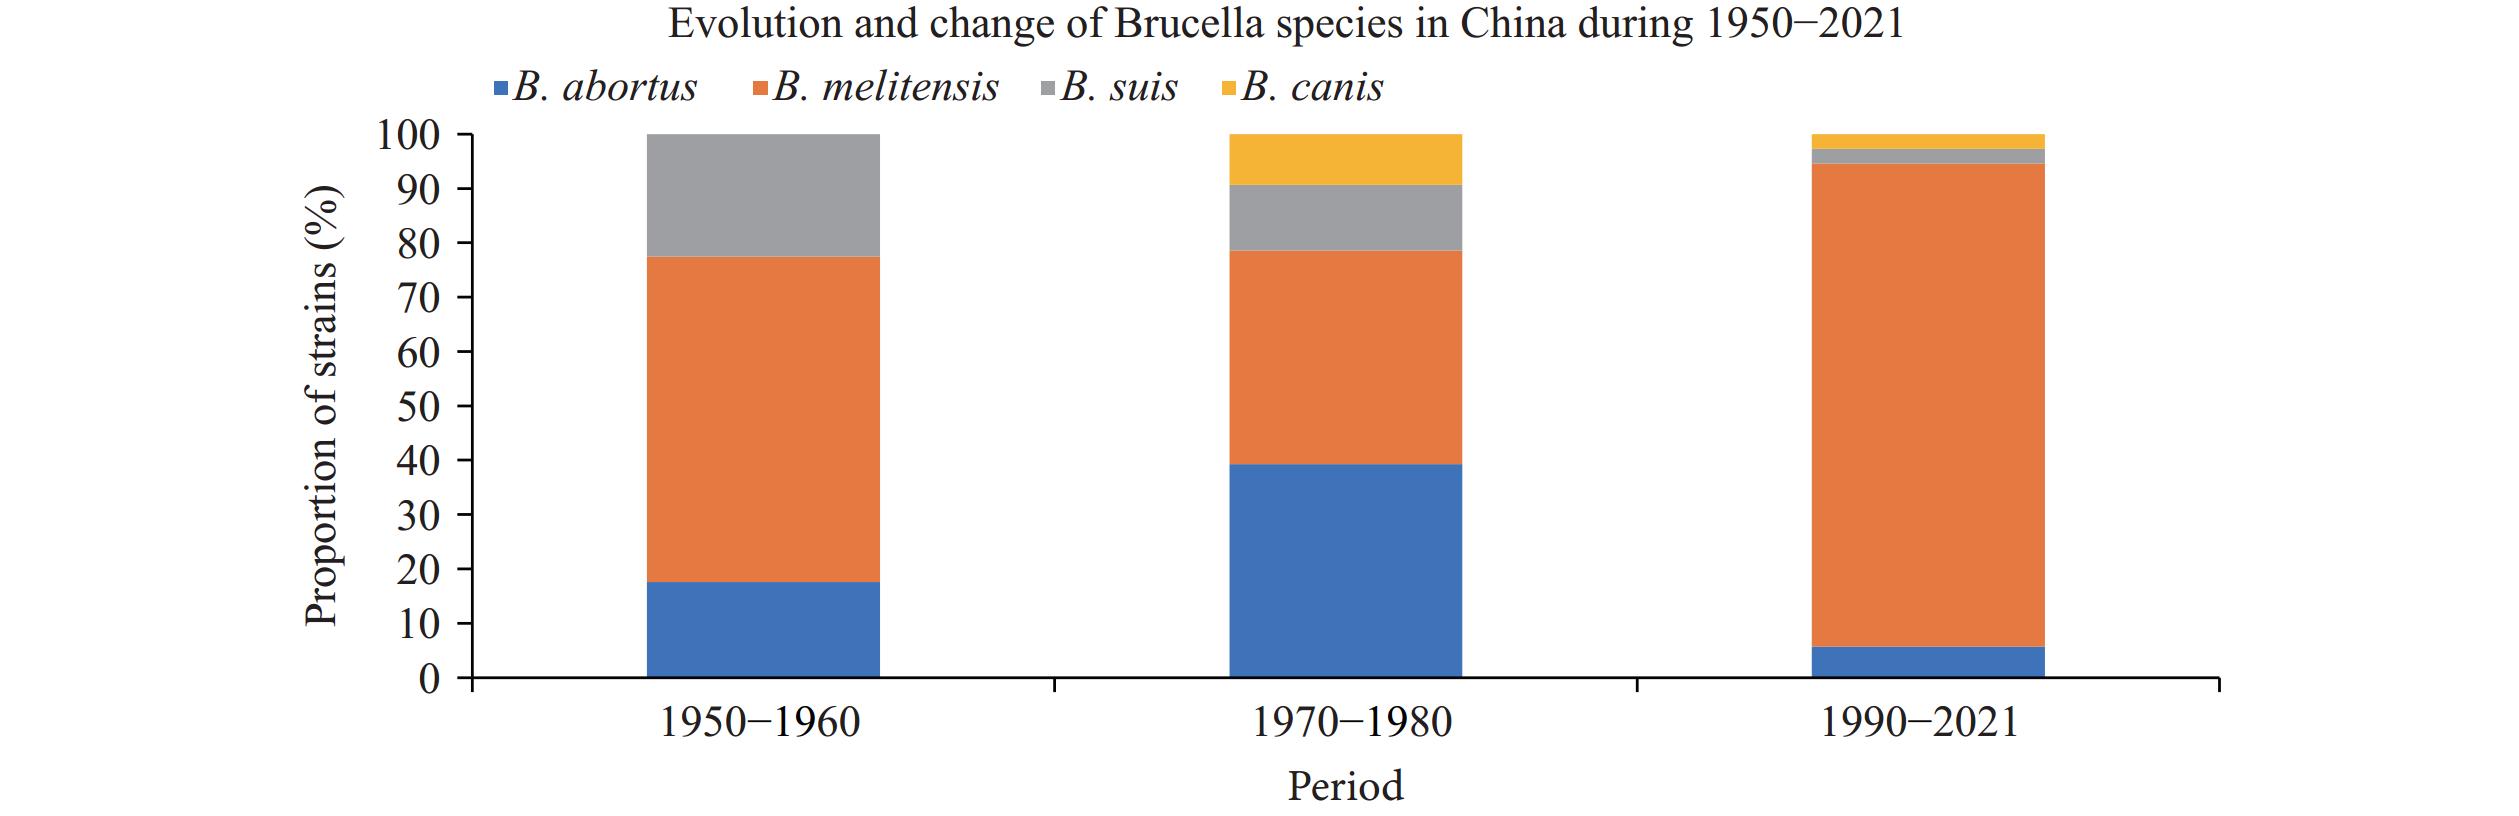 Figure 4.
Species/biotype change trends of Brucella strains in China.
Correlation analysis revealed significant associations between human brucellosis cases, multiple animal husbandry and economic factors (Figure 5), including mutton price (R=0.91), followed by mutton production (R=0.84), milk production (R=0.83), per capita disposable income (R=0.83), beef production (R=0.77) and end-of-year sheep and goat counts (R=0.75) (Figure 5 and
Supplementary Table S2 ). Figure 5.
Correlation analysis of reported cases and incidence rate (
Abbreviation: TTD=Ten thousand heads; TTT=Ten thousand tons; CNY=Chinese Yuan.Supplementary Figure S1 ) of human brucellosis and animal husbandry factors. -
Our analysis reveals a three-phase progression of human brucellosis in China, characterized by an initial epidemic from 1950–1985, a control period from 1986 to 1995, and disease re-emergence from 1996 to 2021. Due to mass animal vaccination campaigns implemented in the late 1970s, the Brucella infection rate decreased to 0.3% in humans and 0.5%–1.0% in animals. Since 1995, human brucellosis has re-emerged as an epidemic disease in China, driven by multiple policy and technical factors. Notably, there has been an increased socioeconomic development alongside persistent lifestyle farming practices. These findings emphasize the crucial importance of maintaining continuous surveillance and intervention measures, even during periods of low disease incidence, to prevent epidemic re-emergence.
High-incidence clusters are predominantly located in northeastern China, while low-incidence clusters are concentrated in southern regions (5). Traditional farming practices, driven by profit maximization in limited spaces often lead to the import of infected animals, and increased abortion rates. This results in frequent human-animal contact and an increased infection risk. The prevalence of small, individually operated farms leads to arbitrary implementation of epidemic prevention measures, resulting in inadequate detection and vaccination protocols, insufficient compensation mechanisms, and continued circulation of infected animals in the market (6).
In the southern, Guangdong and Yunnan provinces reported the highest case numbers and incidence rates, This means that southern cases had minimal impact on the overall endemic progression for nearly two decades, suggesting that controlling brucellosis in the Northern would contribute to a decreased southern incidence. For the southern, recommended strategies include strengthened inspection and quarantine of imported animals and their byproducts, alongside enhanced disease intervention in high-risk populations.
This study has shown that the mutton price, mutton production, milk production, and per capita disposable income are significantly correlated with high brucellosis incidence. Sheep inventory, gross domestic product (GDP), and climate have also been significantly associated with human brucellosis incidence in China (7). A clear relationship exists between disease status and economic resources: countries with higher GDP per capita tend to be free from bovine brucellosis (8). Regions characterized by larger sheep and cattle populations, lower GDP per capita, higher wind speeds, and lower mean temperatures are more likely to become high-risk areas (9).
The control and prevention of human brucellosis require long-term investment and systematic multi-sectoral cooperation. Although animal vaccination represents the most cost-effective control measure with demonstrated positive impact on human brucellosis prevention (10), currently available vaccines alone cannot eliminate brucellosis in any host species (11). Various control methods are employed, including infected animal culling, herd segregation, and vaccination programs. The prevention, control, and eradication of brucellosis demands substantial financial support, unwavering commitment, and extensive resources (12-13). Successful disease control necessitates implementing mass animal vaccination programs, increasing environmental disinfection frequency, ensuring timely elimination of infected animals, and maintaining persistent disease surveillance systems.
This comprehensive analysis elucidates the disease’s transmission trajectory from northern China through the central and developed coastal regions, ultimately reaching the southwestern areas. The synchronized fluctuations in disease incidence between northern and southern regions suggest that effective control measures implemented in the northern could significantly reduce disease prevalence in the southern, though additional evidence is needed to validate this hypothesis. Implementation of integrated surveillance programs incorporating serological, bacteriological, and genomic monitoring in southern regions would provide crucial data to support this relationship. The study demonstrates that brucellosis incidence is intrinsically linked to economic development indicators, including increased mutton, beef, and milk production, as well as rising per capita disposable income, indicating that socioeconomic advancement and growing demand for animal products are primary drivers of persistent brucellosis transmission. Priority should be given to enhancing surveillance and control of infected animals through sustained vaccination programs in high-incidence areas, implementation of systematic surveillance protocols, and strict regulation of infected animal movement.
HTML
| Citation: |

|