
 Download:


-
Radon (222Rn), a naturally occurring radioactive gas, is the second leading cause of lung cancer and has been associated with leukemia (1-4). The concentration of indoor radon has become an increasing public health concern. To protect public health, it is essential to incorporate predictive modeling of indoor radon levels during the architectural design phase. Such modeling enables optimal selection of building locations, appropriate sizing of doors and windows, and evidence-based selection of construction materials. By optimizing building structural parameters, it becomes possible to prevent elevated indoor radon levels before construction completion, thereby safeguarding public health. Therefore, developing an accurate indoor radon concentration prediction model is crucial.
HTML
-
A device for measuring radon concentration is illustrated in Figure 1. The prefabricated block wall was sealed by applying an anti-radon coating to four or five surfaces, leaving one or two surfaces exposed for testing.
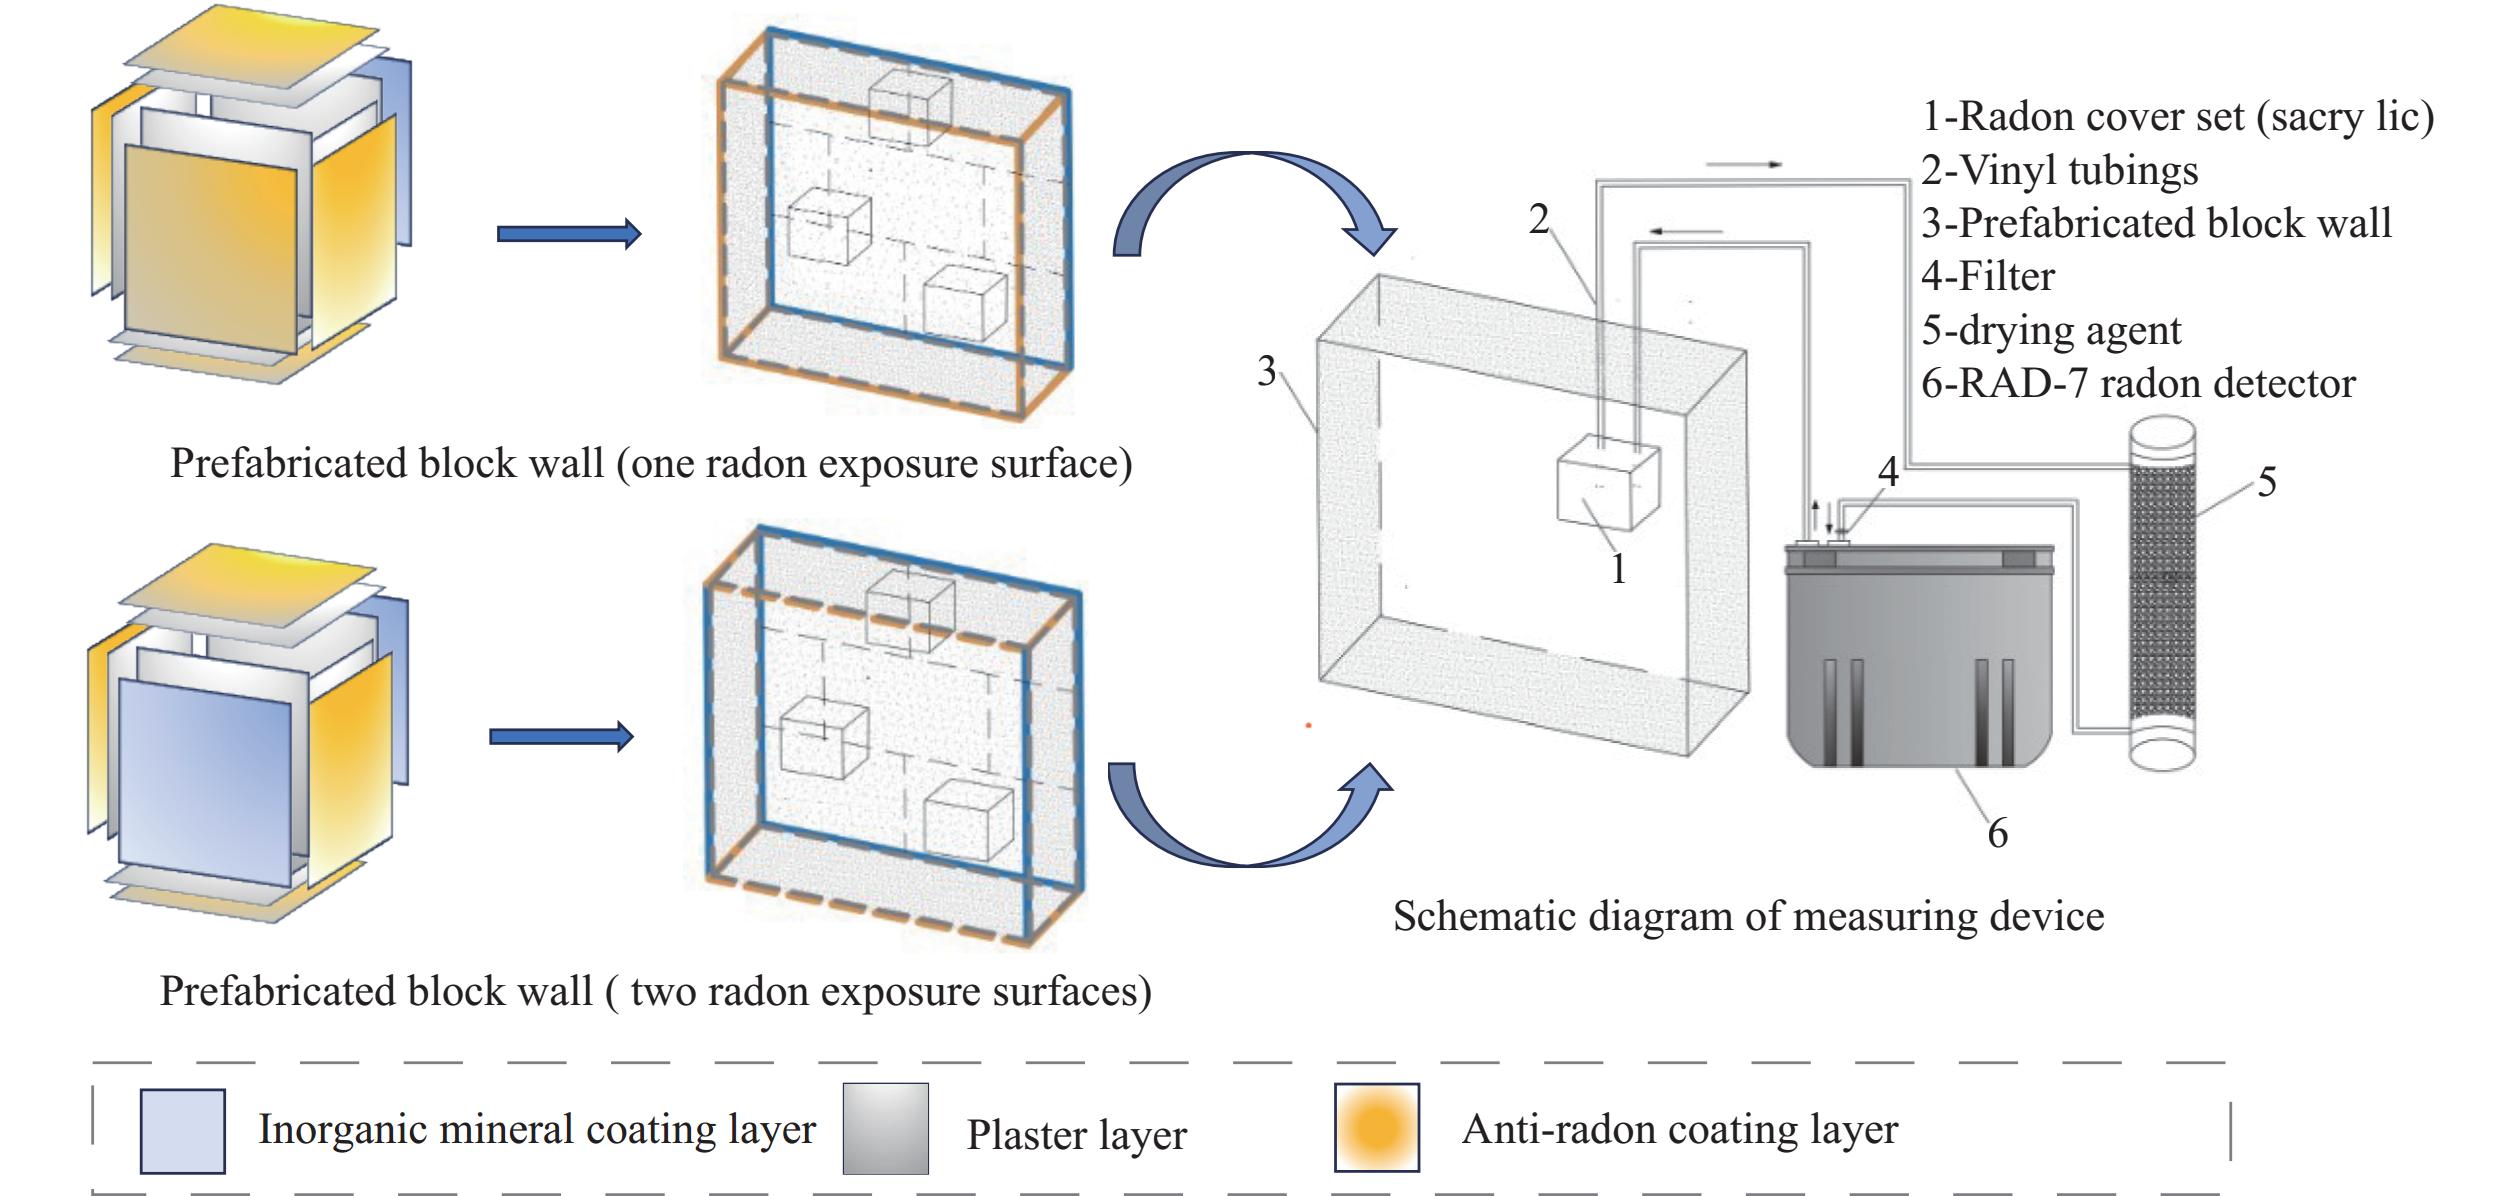 Figure 1.
Schematic diagram of prefabricated block wall and experimental setup.
-
To determine indoor radon concentrations originating from building envelopes, we first established a fitting function for radon exhalation rate as a function of temperature and thickness using multivariate nonlinear regression analysis. We then calculated the total radon contribution by multiplying the surface area of each building envelope by its respective radon exhalation rate. For structures with curved interior surfaces, as illustrated in Figure 2, we employed geometric transformation relations to compute the effective surface area.
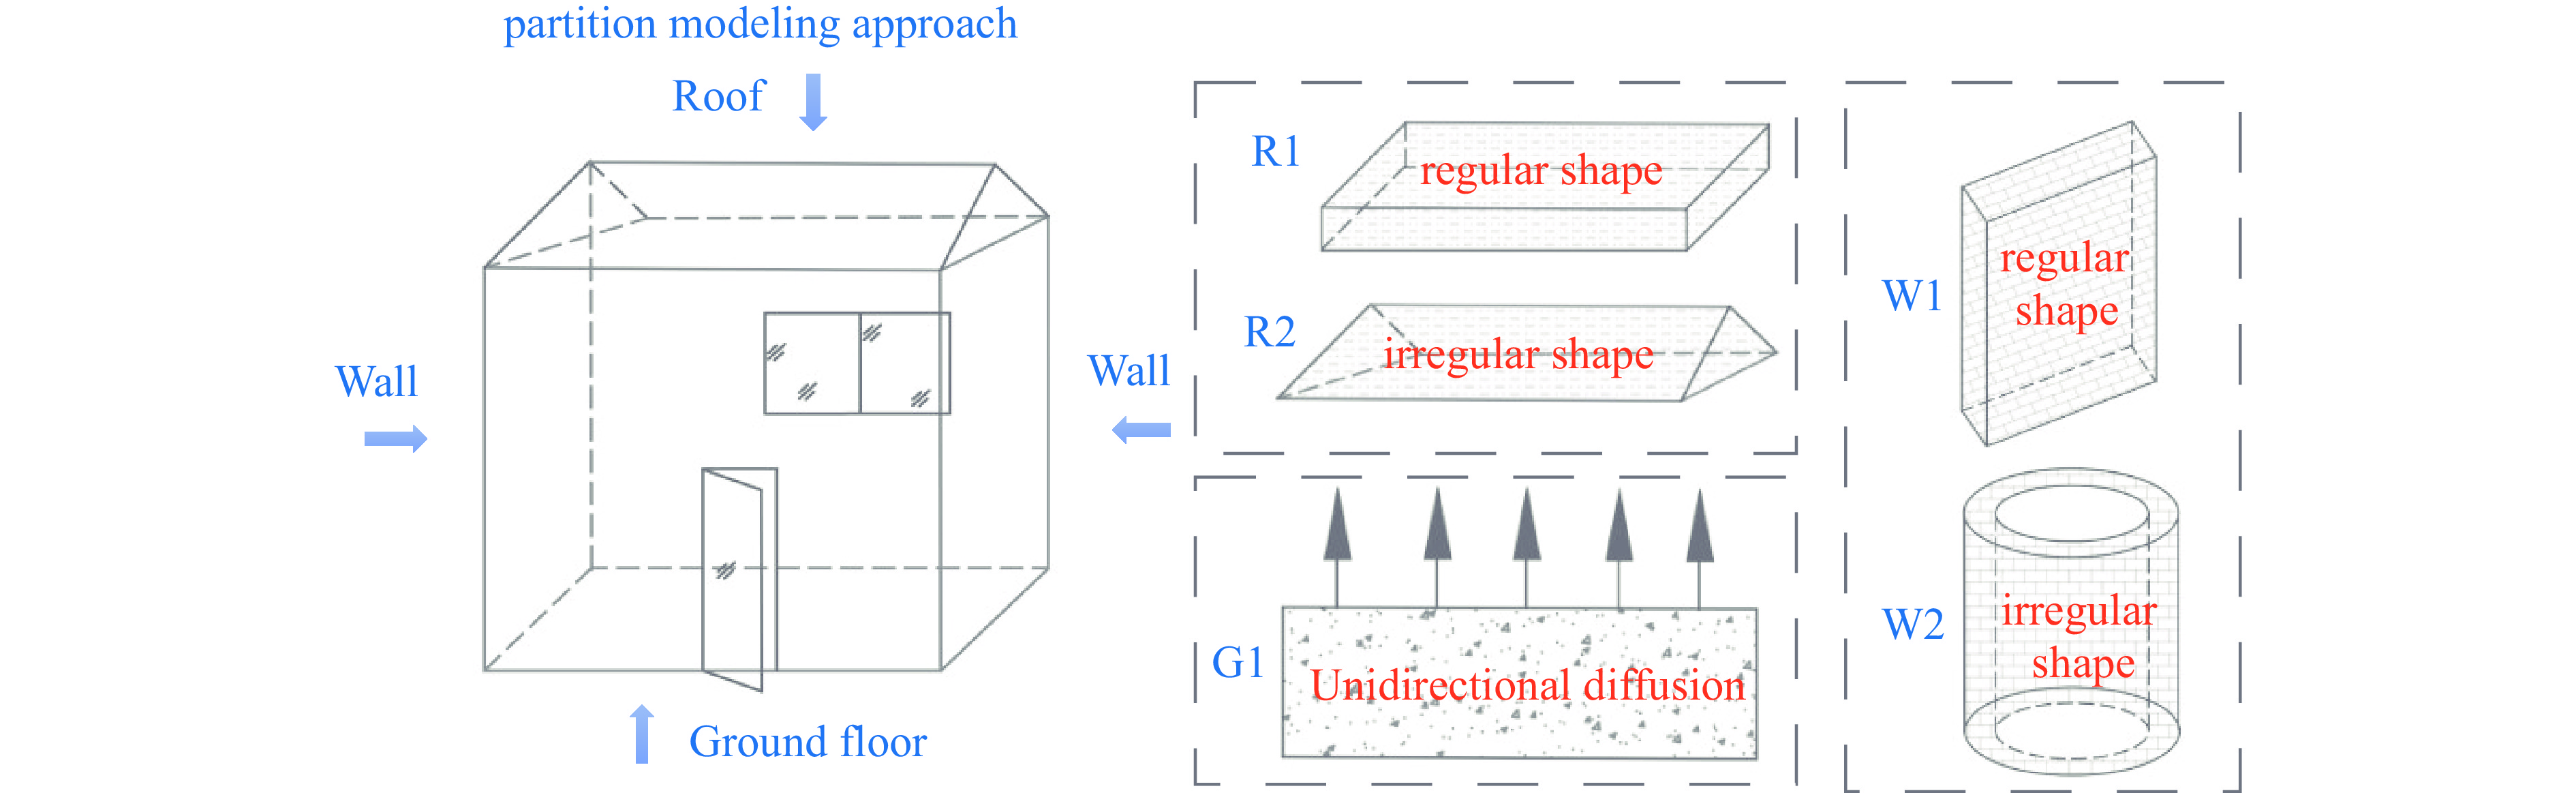 Figure 2.
A schematic diagram illustrating the overall spatial structure of an indoor environment, including the shapes of different main building envelopes.
Notes: R1 is the roof of regular shape; R2 is the roof of irregular shape; W1 is the wall of regular shape; W2 is the wall of irregular shape; G1 is the ground floor. -
We developed a prediction model for indoor radon concentration that accounts for radon exhalation rate from each building envelope at varying temperatures and thicknesses under conditions where building materials are the primary radon source and windows and doors remain closed. For scenarios where the bottom layer consists of soil and outdoor radon primarily originates from soil exhalation, we derived an expression for indoor radon concentration under ventilated conditions with open windows.
Prefabrication of the Block Walls and Construction of A Radon Experimental Model
Calculation of the Surface Radon Exhalation Rate from Various Source Items in Indoor Buildings
Establishment of a Prediction Model for Indoor Radon Concentration Under Natural Air Exchange Conditions
-
Using autoclaved concrete blocks as raw materials, we measured the surface radon exhalation rates of prefabricated block walls (one radon exposure surface) at three distinct thicknesses and five constant temperatures. Based on these measurements, we developed a fitting function to characterize the relationship between radon exhalation rate and the variables of temperature and wall thickness. The resulting fitting model is illustrated in Figure 3, with the corresponding mathematical expression presented in Equation (1).
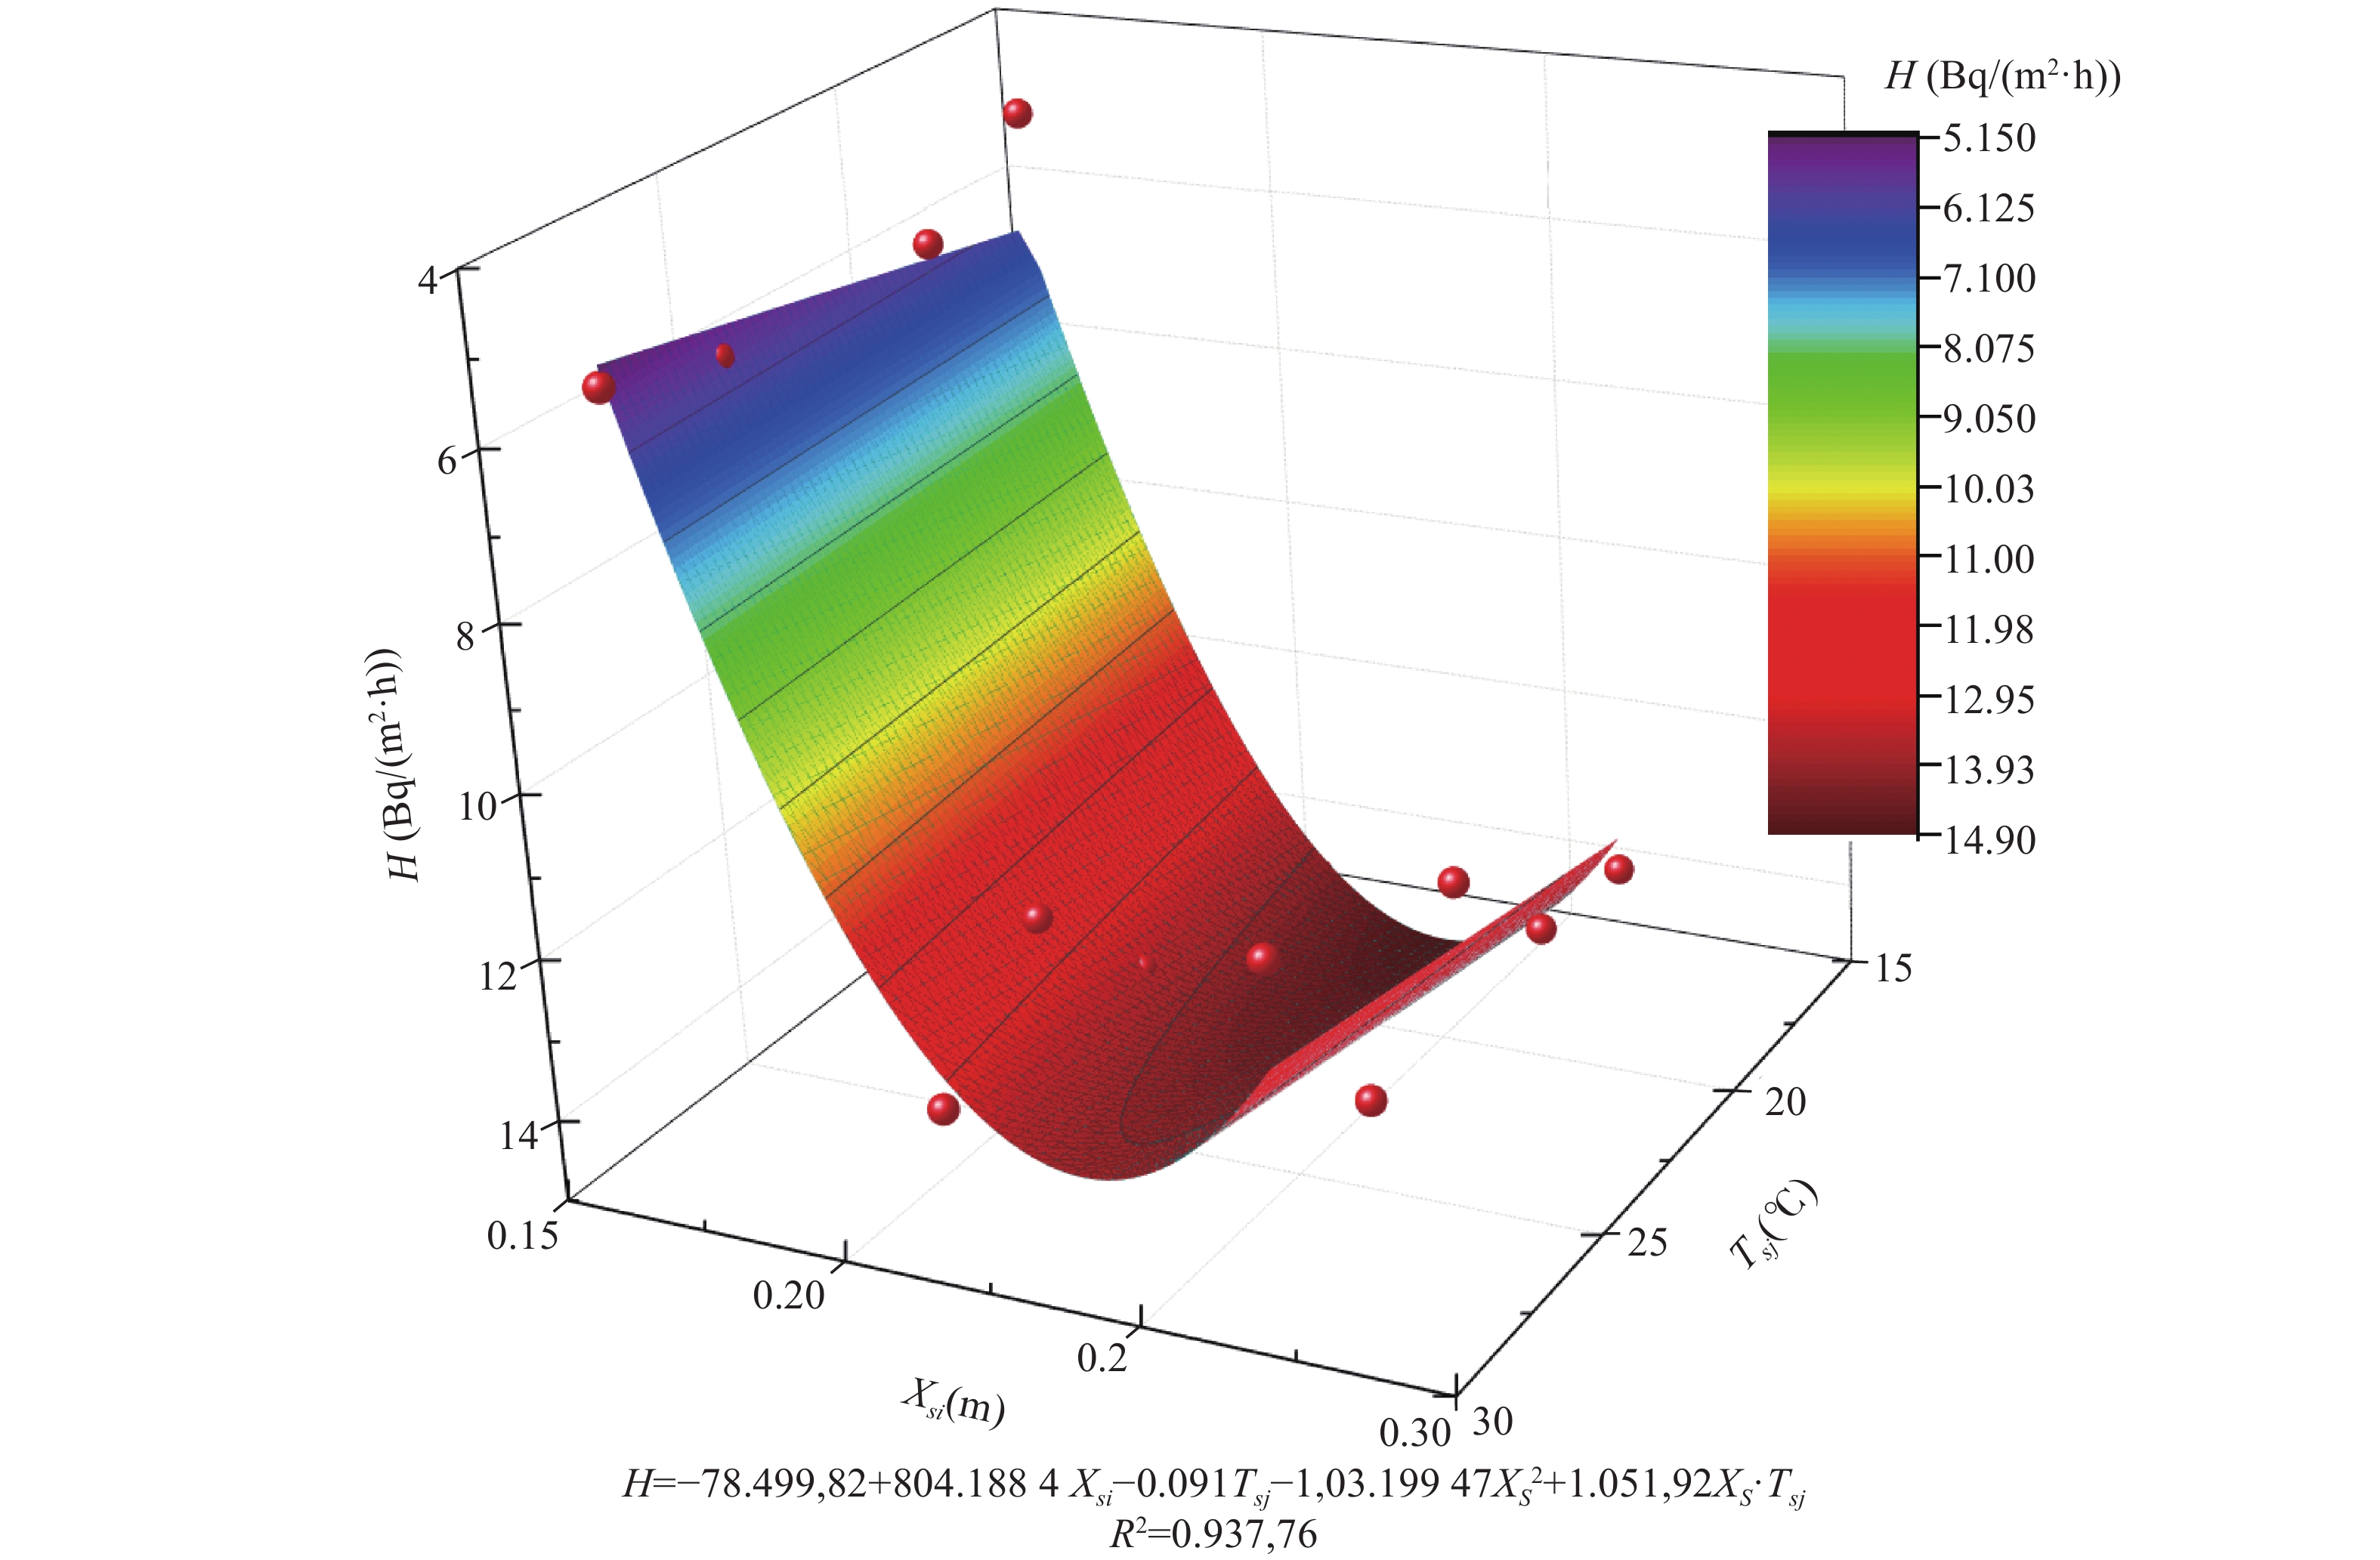 Figure 3.
The fitting model of surface radon exhalation rate of block walls with varying temperatures and thicknesses.
Notes: H is the radon exhalation; Xsi is the structural thickness; Tsj is the indoor temperature; R2 is the goodness of fit.$$ \begin{aligned} H({X_{si}},{T_{sj}}) = & - 78.49982 + 804.1884{X_{si}} - 0.091{T_{sj}} - \\ & 1703.19947{X_{si}}^2 + 1.05192{X_{si}} \cdot \\ & {T_{sj}} ({R^2} = 0.93376) \end{aligned} $$ (1) In Equation (1),
$ H({X_{si}},{T_{sj}}) $ represents the surface radon exhalation rate of the building envelope within the target room (Bq/(m2·h));$ {X_{si}} $ denotes the thickness of the building envelope (m); and$ {T_{sj}} $ indicates the indoor temperature (℃). -
The total radon exhalation rate in walls composed of multiple materials can be expressed as the superposition of individual radon exhalation rates from each constituent material.
$$ H(X_{si},T_{sj})=\frac{\sum_{k=1}^{k=z}H(X_{si},T_{sj})S_{sk}}{S} $$ (2) In Equation (2),
$ {S_{sk}} $ represents the actual exposed surface area (m2) of a specific material within the building envelopes; z represents kinds of materials;$ S $ denotes the total surface area of all building envelopes.Surface area calculations vary by the type of building envelopes. For regular rectangular walls, as follows:
$$ {S_{sk1}} = {\theta _h} \times {\theta _w}$$ (3) Where,
${S_{sk1}} $ is the actual exposed surface area of regular rectangular wall (m2);${\theta _h} $ represents the height of wall (m);${\theta _w} $ represents the width of wall (m).For building envelopes with curved interior surfaces, surface area calculations utilize geometric transformation relations, such as irregular arc walls, the structure is transformed into a cylindrical cavity, as follows:
$$ {S_{sk2}} = {\varepsilon _\varsigma }{h_\varsigma }$$ (4) Where,
$ \varepsilon_{\varsigma}=2\pi r_{\varsigma} $ ,${S_{sk2}} $ is the actual exposed surface area of irregular arc wall (m2);${\varepsilon _\varsigma }\ $ represents the length of each curve (m);$ h_{\varsigma} $ represents the height of wall (m). -
For rooms where indoor radon primarily originates from construction materials, the radon concentration under natural air exchange conditions can be expressed by the following equation:
$$ \begin{aligned}C(t)= & \frac{H(X_{si},T_{sj})S+\eta V_{eff}C_0}{\lambda_{eff}V_{eff}}+ \\ & (\frac{H(X_{si},T_{sj})S+\eta V_{eff}C_0}{\lambda_{eff}V_{eff}}-C_0)e^{-(\lambda+R+\eta)\text{t}}\end{aligned} $$ (5) In Equation (5),
$ C(t) $ represents the radon concentration (Bq/m3);$ {\lambda _{eff}} $ is the effective decay constant (1/s);$ {\lambda _{eff}} = {\lambda _{Rn}} + R + \eta $ , 1/s;$ {\lambda _{Rn}} $ denotes the radon decay constant,$ {\lambda _{Rn}} = 0.00756/{h} $ ;$ R $ represents the inverse diffusion coefficient, which characterizes the diffusion of indoor air radon into construction materials (1/s);$ \eta $ is the ventilation rate (1/h); and$ {V_{eff}} $ represents the effective room volume, defined as the total room volume minus the volume occupied by objects (m3); C0 is the background radon concentration ( Bq/m3 ).When sufficient time has elapsed for indoor radon accumulation to reach equilibrium, the concentration can be calculated using:
$$ C_{equ}=\frac{H(X_{si},T_{sj})S+\eta V_{eff}C_{\mathit{0\mathit{\mathit{\mathit{ }}}}}}{\lambda_{eff}V_{eff}} $$ (6) In Equation (6), Cequ represents the concentration when indoor radon accumulation to reach equilibrium (Bq/m3). In typical residential buildings, the indoor ventilation rate exceeds the radon decay rate by more than two orders of magnitude. Therefore, both the radon decay and indoor anti-diffusion effects can be neglected, yielding
$ {\lambda _{eff}} = {\lambda _{Rn}} + R + \eta \approx \eta $ . Under these conditions, Equation (6) simplifies to:$$ {C_{equ}} = \frac{{H({X_{si}},{T_{sj}})S}}{{\eta {V_{eff}}}} + {C_0} = {C_{H({X_{si}},{T_{sj}})}} + {C_0} $$ (7) In Equation (7),
$ {C_{H({X_{si}},{T_{sj}})}} $ is defined as the indoor radon concentration contributed by construction materials, which can be calculated using:$$ {C_{H({X_{si}},{T_{sj}})}} = \frac{{H({X_{si}},{T_{sj}})S}}{{\eta {V_{eff}}}} = \frac{{\sum {_{k = 1}^{k = z}H({X_{si}},{T_{sj}}){S_{sk}}} }}{{\eta {V_{eff}}}} $$ (8) The comprehensive expression for indoor radon concentration is:
$$ C = \frac{{\sum {_{k = 1}^{k = z}H({X_{si}},{T_{sj}}){S_{sk}}} }}{{\eta {V_{eff}}}} + {C_0} $$ (9) In Equation (9), C is defined as the indoor radon concentration (Bq/m3). For scenarios where the bottom layer consists of soil, the indoor radon concentration can be expressed as:
$$ \begin{aligned} \phi (t) = & \frac{{\sum {_{k = 1}^{k = z}H({X_{si}},{T_{sj}}){S_{sk}}} + \eta {V_{eff}}{C_d}}}{{{\lambda _{eff}}{\lambda _{eff}}}} +\\ & ({C_0} - \frac{{\sum {_{k = 1}^{k = z}H({X_{si}},{T_{sj}}){S_{sk}}} + \eta {V_{eff}}{C_d}}}{{{\lambda _{eff}}{\lambda _{eff}}}}){e^{ - {\lambda _{eff}}{\text{t}}}} \end{aligned} $$ (10) In Equation (10),
$ \phi (t) $ represents the total indoor radon concentration with a soil bottom layer in t time (Bq/m3), while$ {C_d} $ denotes the outdoor radon concentration generated by the soil layer (Bq/m3); t represents time (h).Given that
$ {\lambda _{eff}} = {\lambda _{Rn}} + R + \eta \approx \eta $ and$ {e^{ - (\lambda + R + \eta ){\text{t}}}} \approx 0 $ , Equation (10) can be simplified to:$$ \phi = \frac{{\sum {_{k = 1}^{k = z}H({X_{si}},{T_{sj}}){S_{sk}}} }}{{\eta {V_{eff}}}} + {C_d} $$ (11) In Equation (11),
$\phi $ represents the total indoor radon concentration with a soil bottom layer (Bq/m3). -
We applied the prediction model for indoor radon concentration from construction materials to a radon simulation chamber (container house). Five prefabricated block walls of varying thicknesses (0.155 m, 0.165 m, 0.172 m, 0.213 m, and 0.268 m) as the sole radon sources within the chamber. The interior dimensions of the chamber measured 2.80 × 5.80 × 2.50 m3, featuring one door (0.90 × 1.9 m2) and two windows (0.86 × 0.93 m2). The effective volume of the chamber was 38.78 m3, representing 96% of the total interior volume. Temperature control was maintained using an air conditioning system.
During the winter experiment, doors and windows remained closed, resulting in low ventilation rates (5–7), which were approximated at 0.10–0.12 /h.
We calculated the indoor radon concentration under different ventilation rates at 23 °C and compared these values with the measured equilibrium radon concentration at the same temperature. The background radon concentration was 6.50 Bq/m3. The results are presented in Table 2.
Ventilation rate (1/h) Theoretical value (Bq/m3) Measured value (Bq/m3) Deviation (%) 0.10 21.25 19.60 7.76 0.11 19.91 1.56 0.12 18.80 4.26 0.13 17.85 9.80 Table 1. Comparison of calculated and measured radon concentration when equilibrium.
Measurement of Radon Activity Concentration and Surface Radon Exhalation Rate Fitting Function


Expression for the Surface Radon Exhalation Rate from Walls with Multiple Materials


Expression of A Prediction Model for Indoor Radon Concentration


The Application of the Prediction Model for Indoor Radon Concentration
-
Indoor radon primarily originates from soil and building materials (8). Two critical factors influence indoor radon accumulation: surface radon exhalation rate and ventilation rate (9–11). We have established a prediction model for indoor radon concentration that incorporates the internal surface area and radon exhalation rate of the building envelope, indoor temperature, and natural air exchange rate, enabling accurate calculation of indoor radon concentration under the combined influence of multiple factors.
A key strength of this model lies in its integration of building structural geometric parameters and environmental factors affecting indoor radon concentration. We developed a correlational function that accounts for radon exhalation rates across multiple walls at varying temperatures and thicknesses. The relationship between construction materials and indoor radon concentration has been optimized through direct measurement of surface radon exhalation rates from prefabricated walls, significantly enhancing the accuracy and broader applicability of indoor radon concentration predictions. For building envelopes with curved interior surfaces, we employed geometric transformation relationships to calculate wall surface areas. Through comparative analysis and validation, we demonstrated that the model’s estimated indoor radon concentration from walls with thicknesses of 0.155–0.268 m at 23 ℃ aligns with measured values, with deviations less than 10%.
This refined model provides valuable guidance for preliminary building site selection, optimal door and window dimensioning, and scientifically informed selection of construction materials with respect to radon safety considerations.
While the model has limitations regarding daily and seasonal wall temperature fluctuations, as the fitting curve for exhalation rate calculations was derived from constant-temperature experiments, these constraints can be addressed by incorporating multiple fitting curves for various temperatures and wall thicknesses. Although there exists a discrepancy between modeled and real-world conditions, this deviation remains theoretically insignificant. Thus, the model maintains its practical utility and scientific validity within a controllable range.
-
This research involves no ethical concerns as it does not include human/animal subjects or sensitive data.
| Citation: |

|