
 Download:


-
Physical literacy (PL) has evolved from the concept of health literacy (HL). The fundamental components of HL comprise emotional dimensions (motivation and confidence), physical dimensions (physical capability), and cognitive dimensions (knowledge and understanding) (1). PL represents a comprehensive construct that encompasses motivation, self-confidence, physical competence, motor skill execution, and active engagement in physical activities (2–4). Recent researches has extensively documented the benefits of physical activities, particularly those of moderate to vigorous intensity, for children and adolescents, including improvements in cardiovascular health, visual acuity, and mental well-being (5–7).
Despite these recognized benefits, the current state of physical activity among primary school students in China remains concerning, characterized by insufficient understanding of physical exercise and declining physical fitness (8). PL enables primary school students to develop fundamental comprehension of exercise and health, thereby fostering health-promoting behaviors and competencies (9). Students with strong PL competencies consistently demonstrate superior performance in physical activities. Therefore, PL assessment serves as a crucial tool for monitoring and evaluating the effectiveness of physical education among primary school students, ultimately informing and enhancing national-level policies and interventions.
Current research and assessment tool development for PL in China have predominantly focused on adolescent populations, particularly middle and high school students. A significant gap exists in the availability of standardized measurement tools for assessing PL among primary school students in China. This study addresses this gap by developing a comprehensive questionnaire specifically designed to measure PL in primary school students, taking into account the developmental characteristics of students across different grade levels.
-
This study employed a multistage cluster sampling approach conducted from June 1 to July 31, 2022. Three provinces were strategically selected to represent the eastern, central, and western regions of China, with one city randomly chosen from each province. Additionally, a highly economically developed municipality in southern China was included to enhance regional representation. Within each selected city, we randomly selected one urban and one rural primary school. From each school, 1–2 classes were randomly sampled across three grade level groups (grades 1–2, 3–4, and 5–6). All students within the selected classes participated in the questionnaire survey, completing the instruments independently. The study yielded 3,275 valid questionnaires, distributed across educational stages as follows: 1,064 from grades 1–2, 1,069 from grades 3–4, and 1,142 from grades 5–6. Informed consent was obtained from all participants, and the study received ethical approval (Table 1).
Demographics Frequency Grade 1–2 n (%) Grade 3–4 n (%) Grade 5–6 n (%) Missing Gender 82 Boys 517 (49.6) 514 (49.2) 579 (52.3) Girls 525 (50.4) 530 (50.8) 528 (47.7) Grade 32 1/3/5 461 (43.9) 431 (40.8) 527 (46.4) 2/4/6 590 (56.1) 625 (59.2) 609 (53.6) Ethnicity 41 Han 898 (86.1) 953 (89.7) 1,009 (89.4) Minority 145 (13.9) 109 (10.3) 120 (10.6) Nearsightedness 189 Yes 87 (8.2) 266 (26.5) 387 (38.1) No 897 (84.3) 667 (66.4) 572 (56.2) Unawareness 80 (7.5) 72 (7.1) 58 (5.7) Total 1,064 (100) 1,069 (100) 1,142 (100) Table 1. Sociodemographic characteristics of the students (N=3,275).
-
This study developed three grade-specific versions of the scale to align with children’s cognitive development levels: PLS-Grade1–2 (physical literacy scale for elementary school students in grades 1–2), PLS-Grade 3–4 (physical literacy scale for elementary school students in grades 3–4), and PLS-Grade5–6 (physical literacy scale for elementary school students in grades 5–6). The scale’s framework was constructed based on four fundamental dimensions of children’s HL derived from existing Chinese policy documents and guidelines: knowledge, physical participation, physical competence, and physical motivation (Table 2).
Dimension PLS-Grade Items Answer Physical knowledge 1–2 B1–B10 Yes/No 3–4 B1–B10 5–6 B1–B15 Physical participation 1–2 D01C–D10C Likert four-level scale (Never/1 to 3 times/4 to 6 times /Everyday) 3–4 D01C–D12C 5–6 C01C–C14C C01D–C14D Likert five-level scale (Less than 0.5 hours/ 0.5 to 1 hour/1 to 2 hours/ more than 2 hours) Physical motivation 1–2 C1–C10 Yes/No 3–4 C1–C12 5–6 D1–D15 Likert five-level scale Physical competence 1–2 D01B–D10B Yes/No 3–4 D01B–D12B 5–6 C01B–C14B Abbreviation: PLS=physical literacy scales. Table 2. Summary structure and content classification of the three-vision scales.
Each version of the scale consists of two components: a Personal Information Questionnaire and a Physical Literacy Measurement Scale. The Personal Information Questionnaire comprises eight items collecting data on student demographics and behavioral characteristics: name, gender, age, grade, ethnicity, nearsightedness status, physical activity level, and internet usage patterns. The Physical Literacy Measurement Scale evaluates the four dimensions of children’s PL using a 100-point scoring system. Dimensional weights were predetermined through Delphi expert consultation to ensure appropriate score allocation across components.
Physical Knowledge: The item banks were customized according to students’ comprehension levels across different grades. For grades 1–4, 10 items were selected, while 15 items were chosen for grades 5–6. Each item consists of a true/false statement designed to assess children’s understanding of physical activity, sedentary behavior recommendations, health perspectives, and safety awareness during physical activities (Table 3).
Dimension Grades Item number Item Question type Physical knowledge 1–2 B1–B2 The concept of physical activity Yes/No B3 Benefits of physical activity B4–B5 Knowledge about physical activity safety B6 The concept of health B7 Whether air pollution should continue to exercise B8–B9 The dangers of sitting for a long time B10 Knowledge about the amount of exercise 3–4 B1–B2 The concept of physical activity Yes/No B3 Benefits of physical activity B4–B5 Knowledge about physical activity safety B6 The concept of health B7 Whether to exercise under air pollution B8–B9 The dangers of sitting for a long time B10 Knowledge about the amount of exercise 5–6 B1–B2 The concept of physical activity Yes/No B3 Benefits of physical activity B4, B6–B7 Knowledge about physical activity safety B5 Type of physical activity B8 Knowledge about the amount of exercise B9–B10 Whether to exercise under air pollution B11–B14 The dangers of sitting for a long time B15 The concept of health Physical motivation 1–2 C1 In order to strengthen physical fitness and get sick less Judgment question C2 To bring me joy C3 To learn new sport skills C4 Like to meet new challenges C5 To maintain good health C6 In order to complete the sports test in school C7 To meet new friends C8 To look better for my own appearance C9 Due to its inherent amusement C10 Because exercise is important for me 3–4 C1 In order to strengthen physical fitness, get sick less Judgment question C2 To bring me joy C3 To learn new sport skills C4 Like to meet new challenges C5 To maintain good health C6 In order to complete the sports test in school C7 My friend wants me to exercise more C8 To look better for my own appearance C9 Due to its inherent amusement C10 To meet new friends C11 In order to get good results in sports tests of school C12 Because exercise is important for me 5–6 D1 Because it is in line with life goals Likert five-level scale D2 To relieve stress D3 To control weight and improve body shape D4 To bring me joy D5 Because I enjoy of the process of exercise D6 To maintain health D7 To look better for my own appearance D8 To maintain relationships D9 To learn new sport skills D10 Because everyone thinks I should exercise D11 Because of the requirements of teachers and parents D12 In order to get good results in sports tests D13 Because of the deep love for sports D14 Due to its inherent amusement D15 Because of the importance of health Table 3. Items for the physical knowledge and physical motivation dimensions.
Physical Competence: The physical competence domain evaluates proficiency in various physical activities through capability-based questions (e.g., “Can you perform this activity?”). Following expert panel discussions, we developed grade-specific activity categories. For grades 1–2, we included 10 categories spanning leisure activities (e.g., shuttlecock kicking), moderate-intensity activities (cycling, gymnastics, roller skating, taekwondo), and high-intensity activities (dance, swimming, running, table tennis). The grades 3–4 questionnaire incorporated soccer and badminton as additional activities. For grades 5–6, we expanded the assessment to include sit-ups/pull-ups, mountain climbing, martial arts, and consolidated ball sports into two choice categories: one between basketball, soccer, or volleyball, and another between badminton, table tennis, or tennis. The final item counts were 10 for PLS-Grade1–2, 12 for PLS-Grade3–4, and 14 for PLS-Grade5–6.
-
The physical participation domain evaluates weekly exercise activities across varying intensities and durations. Students in grades 1–4 respond using a four-point Likert scale, while grades 5–6 students answer questions structured on a four-point Likert scale. The number of items corresponds to the physical competences listed in the questionnaire: PLS-Grade 1–2 contains 10 items, PLS-Grade3–4 comprises 12 items, and PLS-Grade5–6 includes 14 items.
-
The Children’s Self-Perception of Adequacy in and Predilection for Physical Activity (CSAPPA) Scale (10) was utilized to assess children’s perceived competence in physical activities and their inclination toward participation. All scale items were adapted into age-appropriate language to ensure comprehension by adolescent participants. The PLS-Grade1–2 and PLS-Grade3–4 utilize true/false questions, with 10 questions per grade level. The PLS-Grade5–6 employs a five-point Likert scale comprising 15 questions (Table 3).
-
To ensure data quality and independence, each class was assigned a dedicated investigator for the duration of the study. Students completed the questionnaires independently without teacher influence, while both the survey administrator and class teacher supervised the process to verify complete and accurate completion of all questionnaires.
The measurement methodology was primarily guided by item response theory (IRT). Analysis was conducted using Winsteps software (version 3.66.0; https://winsteps.com/index.htm) to evaluate both dichotomous and multi-classification items. Items that failed to meet Rasch model criteria were either adjusted or eliminated as necessary.
-
Analysis of participant ability difficulty scores revealed mean values of −1.65, −1.06, −1.26, and −0.27, indicating that the items presented considerable challenge to participants. The Rasch model evaluation, utilizing Infit MNSQ and Outfit MNSQ average values, demonstrated optimal overall fit with values consistently falling between 0.5 and 1.5. These results indicate strong alignment between the three questionnaires and the ideal model, confirming robust data consistency (Table 4).
Psychometric attribute PLS-Grade1–2 PLS-Grade3–4 PLS-Grade5–6 Number of item 40 46 72 Measure (Person) 1.68 1.14 0.40 Measure (Item) 0 0 0 Reliability Person reliability 0.81 0.81 0.89 Item reliability 1.00 1.00 1.00 Separation Person separation 2.04 2.09 2.86 Item separation 14.23 15.41 21.25 Item-fit statistics Infit MNSQ Mean square 1.00 1.01 1.11 Standard Deviation 0.10 0.09 0.46 ZSTD −0.1 0.0 0.4 Outfit MNSQ Mmean square 1.04 1.12 1.17 Standard Deviation 0.28 0.29 0.56 ZSTD 0.3 0.8 0.5 Abbreviation: PLS=physical literacy scales; MNSQ=mean square; ZSTD=Z-standardized mean. Table 4. Item summary statistics (N=3,275).
-
The variance explained by the measures across the three questionnaires was 53.1%, 50.3%, and 54.7%, respectively, all exceeding the 50% threshold. These results confirm unidimensionality, indicating that the items within each scale effectively measure a single, cohesive domain.
-
The distribution of item difficulty and participant ability levels varied across grade groups. For grades 1–2, item difficulty spanned from −3 to 3 logit units, while participant ability levels ranged from -3 to 5 logit units. In grades 3–4, item difficulty ranged from -4 to 3 logit units, with participant ability levels distributed between −2 and 5 logit units. For grades 5–6, item difficulty extended from −4 to 3 logit units, while participant ability levels ranged from −2 to 4 logit units (Figure 1A–C). Across all three questionnaires, the item difficulty distribution demonstrated optimal alignment with participant ability levels.
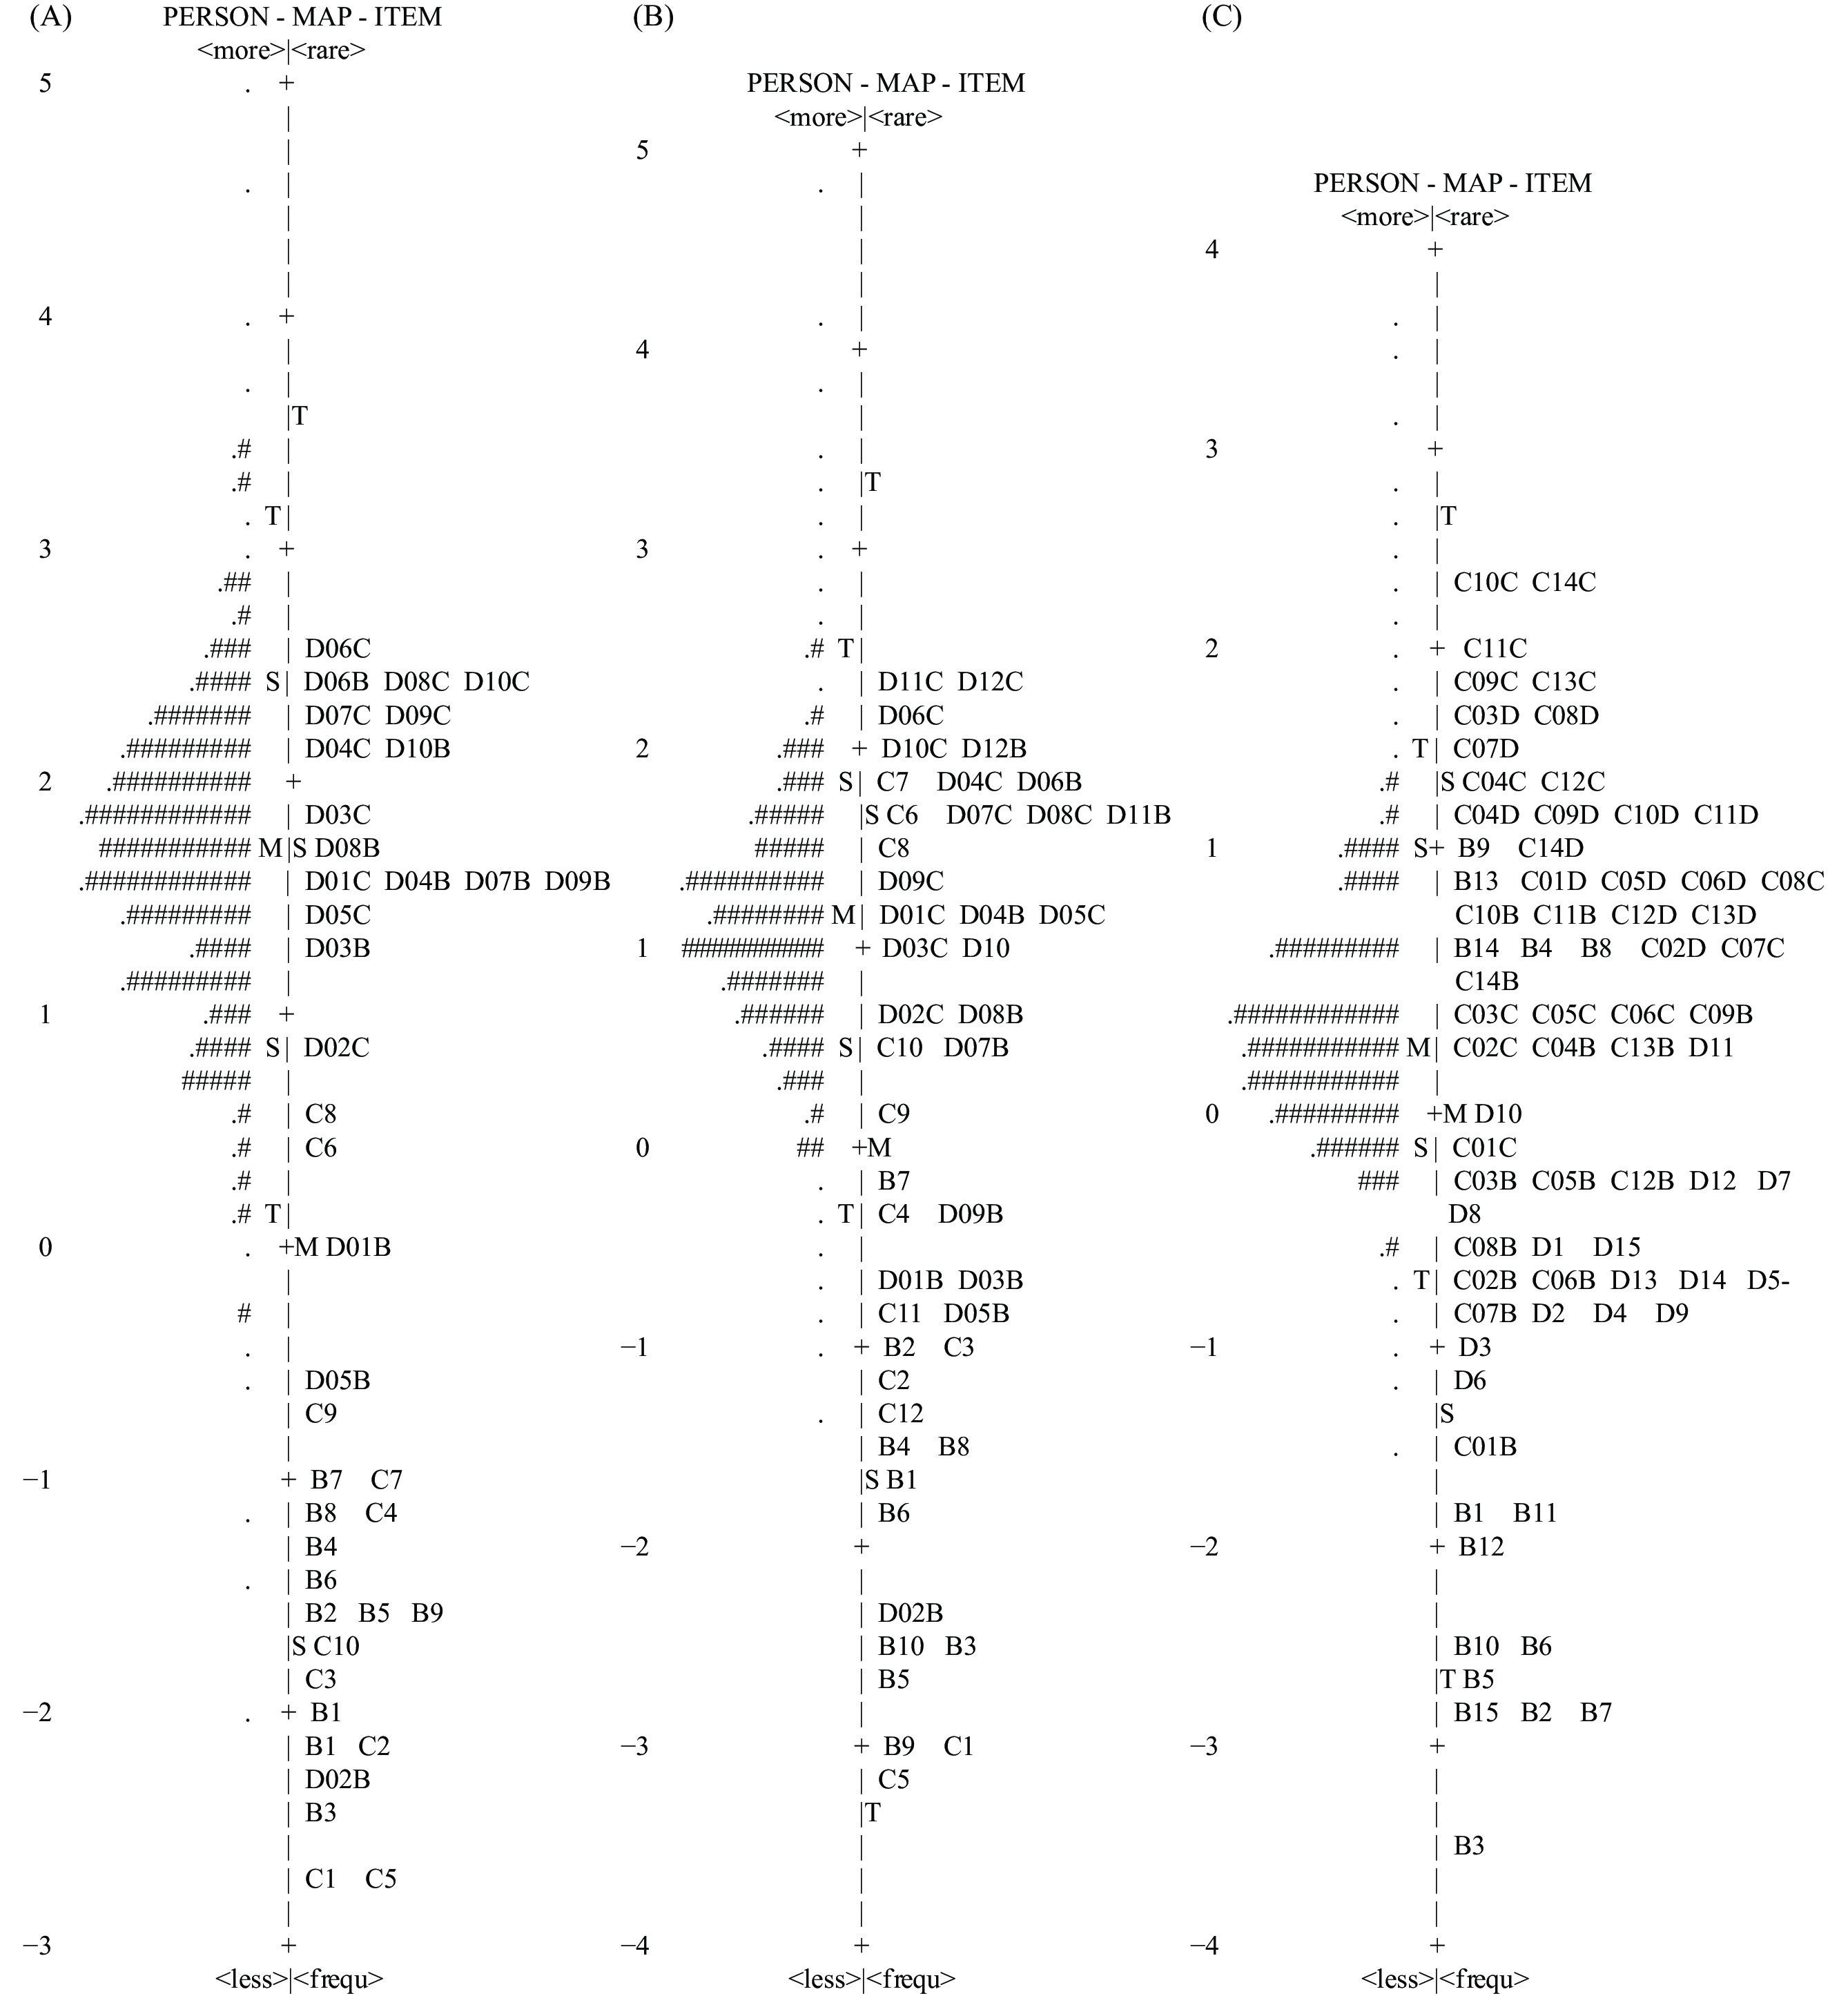 Figure 1.
The distribution map of item difficulty and participant ability levels of (A) PLS-Grade1–2; (B) PLS-Grade3–4; and (C) PLS-Grade5–6.
Note: The left side of the chart shows the participants' ability levels and the right side displays the item difficulty levels. Each "#" means 8. Each "." means 1 to 7.
Abbreviation: PLS=physical literacy scales.
-
Analysis of item fit statistics revealed robust measurement properties across all three scales. For PLS-Grade1–2, the Infit mean square statistics ranged from 0.82 to 1.31 with a mean of 1.00, while Outfit mean square values spanned from 0.62 to 1.78, averaging 1.04. PLS-Grade3–4 demonstrated Infit MNSQ values between 0.79 and 1.34 (mean=1.01) and Outfit MNSQ values from 0.81 to 2.16 (mean=1.12). For PLS-Grade5–6, Infit MNSQ values ranged from 0.32 to 2.18 (mean=1.11), with corresponding Outfit MNSQ values spanning 0.37 to 2.54 (mean=1.17) (
Supplementary Table S1 ). -
The validation of questionnaire quality yielded robust results. The item reliability coefficients across all four grade levels achieved a value of 1, with item separation values substantially exceeding 3. These findings demonstrate exceptional internal consistency within the questionnaire and validate the hierarchical structure of item difficulty levels. Furthermore, the questionnaire effectively discriminates among students with varying proficiency levels. The unidimensionality test revealed that all items across the three questionnaires met the necessary criteria, justifying subsequent Rasch model analysis. The item-person map demonstrates optimal alignment between the average item difficulty and respondents’ ability levels, with items of varying difficulty distributed evenly across the scale. This distribution effectively accommodates primary school students across the spectrum of health literacy levels. Statistical analyses of all three questionnaires indicated favorable overall fit, showing strong concordance with the ideal model.
From an implementation perspective, our approach effectively addresses the varying cognitive capacities among primary school students while enabling precise assessment of their PL development. The questionnaires were strategically designed with grade-appropriate item counts, incorporating more questions for higher-grade students to maintain engagement throughout the measurement process. To accommodate younger students’ developing comprehension abilities, their questionnaires featured simplified formats, such as true/false questions. Conversely, five-point Likert scale items were implemented for higher-grade students to comprehensively capture physical activity motivation factors. Additionally, the questionnaires employed grade-specific language to address variations in comprehension levels across age groups. This PL measurement scale, grounded in a thorough understanding of student characteristics, enhances both scientific rigor and practical utility through its hierarchical design and differentiated approach. These methodological insights offer valuable guidance for future PL measurement tool development.
Our study has several limitations. First, the reliance on primary school students’ voluntary responses may introduce inherent participant subjectivity biases (11). Future studies should consider diverse data collection methods, such as parental or teacher assistance in questionnaire interpretation, to mitigate potential cognitive limitations-related subjectivity. Second, our use of cluster sampling may have resulted in population underrepresentation (12). We recommend that future research enhance survey methodology to reduce bias, moderately decrease scale difficulty, and expand sample size.
-
We are grateful to all participants of primary school in Luzhou, Sichuan province; Cangzhou, Hebei province; Haidong, Hainan province; Shenzhen for their time and insights. We also want to express gratitude to the leaders and teachers in these schools and our postgraduate research assistants at Peking Union Medical College for their cooperation and assistance. Thanks to the staff of the regional Health Commission for their personnel and financial support.
-
This study was conducted according to the guidelines laid down in the Declaration of Helsinki and all procedures involving research study participants were reviewed and approved by the Institutional Review Board (IRB) of the Chinese Academy of Medical Sciences and Peking Union Medical College. Approval was granted with protocol number CAMS&PUMC-IEC-2022-026. Obtained written informed consent from all study participants. Obtained consent from parents or guardians.
HTML
Study Population
Operationalization of the PL Model and Assessment
Physical Participation
Physical Motivation
Statistical Analysis
Item Summary Statistics
Unidimensionality
Item Person Map
Item Fit Statistical Analysis
| Citation: |

|