
 Download:


-
Introduction: Cardiovascular disease (CVD) has emerged as a critical determinant of prognosis and quality of life among individuals living with human immunodeficiency virus (HIV). The primary objective of this study is to assess the CVD risk among HIV-infected individuals and determine the proportion of high-risk individuals using multiple evaluation methods.
Methods: A cross-sectional study was conducted among HIV-infected individuals aged 18 years and older who were receiving antiretroviral therapy between April 26, 2023, and December 16, 2023. Participants were categorized into low-risk, intermediate-risk, and high-risk groups for CVD based on six risk assessment tools.
Results: Our analysis revealed that the 5-year overall CVD risk estimates ranged from 2.37% to 2.50%, while the 10-year overall risk estimates spanned from 3.42% to 18.35%, with significant variations observed between subgroups. The proportion of high-risk individuals in the 10-year risk assessment, identified using five different tools, ranged from 7.85% to 31.94%, demonstrating moderate consistency across tools.
Conclusions: The findings underscore the importance of closely monitoring and managing CVD risk in HIV-infected individuals. Given the variability in risk stratification methods, it is imperative to develop an assessment model tailored to the specific characteristics of the Chinese population.
-
Cardiovascular disease (CVD) has emerged as a critical determinant of prognosis and quality of life among individuals living with human immunodeficiency virus (HIV). Consequently, the screening, prevention, and treatment of CVD have become integral components of comprehensive HIV care (1). While risk prediction models and assessment criteria serve as essential tools for CVD primary prevention, their application to HIV-infected individuals presents challenges due to inconsistent results and incomplete consideration of HIV-specific risk factors. We conducted a cross-sectional study of HIV-infected individuals aged 18 years and older who were receiving antiretroviral therapy (ART) at Department of Infection and Immunity of Shanghai Public Health Clinical Center between April 26, 2023, and December 16, 2023. Our analysis revealed 5-year CVD risk estimates ranging from 2.37% to 2.50%, and 10-year risk estimates spanning 3.42% to 18.35%, with significant variations observed between subgroups. This study aims to heighten clinician awareness regarding CVD risk in HIV-infected individuals and advocates for the development of tailored assessment tools for this population.
Study participants were screened according to the eligibility criteria of different prediction models, with cases of incomplete data being excluded (
Supplementary Figure S1 ). Demographic and clinical data were collected through questionnaires, including gender, age, region, ethnicity, smoking status, marital status, family history of CVD, antihypertensive medication use, and diabetes mellitus history. Anthropometric measurements were performed on site, including height, weight, waist circumference (measured horizontally at an umbilical level), body mass index (BMI), systolic blood pressure (SBP), and diastolic blood pressure (DBP). Laboratory parameters including total cholesterol, high-density lipoprotein (HDL) cholesterol, low-density lipoprotein (LDL) cholesterol, triglyceride (TG), and estimated glomerular filtration rate (eGFR) were obtained through standardized testing. Treatment-related data, including regimen details, initial and most recent CD4 counts, ART initiation date, duration of follow-up, and clinical outcomes, were extracted from the treatment database using patient age and treatment identification numbers.Baseline characteristics were summarized using percentages for categorical variables and medians with interquartile ranges (IQRs) for continuous variables. We applied multiple validated atherosclerotic cardiovascular disease (ASCVD) risk assessment tools: The American College of Cardiology/American Heart Association 2013 ASCVD risk score (ACC/AHA-ASCVD) (2), the Framingham 2008 ASCVD risk score (FHS-CVD) (3), European AIDS Clinical Society (EACS) guidelines (4), the Predicting the 10-Year risks of Atherosclerotic Cardiovascular Disease in Chinese Population (China-PAR) (5), Data-collection on Adverse Effects of Anti-HIV Drugs (D:A:D) study (6), and the Chinese guidelines for lipid management (2023 edition) (7). Detailed comparisons of cohort populations, endpoint definitions, and risk stratification criteria across models are provided in
Supplementary Table S1 . To ensure standardized comparison, we focused on 10-year risk assessment, excluding lifetime risk calculations. For EACS guidelines, we utilized Version 11.0 recommendations based on the Framingham equation or national guidance, rather than Version 12.0’s SCORE-2 model, given our focus on Shanghai’s HIV-infected population. Statistical analyses were performed using R (version 4.4.1; R Foundation for Statistical Computing, Vienna, Austria) and the R package ‘CVrisk’ version 1.1.1 (8). For D:A:D risk assessment, we implemented the reduced model and sex-specific adjusted Framingham model to calculate 5-year incidence risk. We conducted subgroup analysis by gender, age group, and diabetes status, computing mean values and 95% confidence intervals (CI) for each subgroup, with pairwise t-tests for between-group comparisons. Inter-rater reliability was assessed using Fleiss’ kappa, with values interpreted as: 0.00–0.20 (slight), 0.21–0.40 (fair), 0.41–0.60 (moderate), 0.61–0.80 (substantial), and 0.81–1.00 (almost perfect) agreement.The study comprised 3,815 individuals, with males constituting 93.69% of the cohort and a median age of 44 years (interquartile range: 33–55 years). Among participants, 27.79% (1,060/3,815) were smokers, with a median BMI of 23.04 (interquartile range: 20.83–24.77), and 33.94% (1,295/3,815) were overweight (BMI>24). Dyslipidemia was present in 61.57% (2,349/3,815) of participants, with 22.2% (848/3,815) exhibiting elevated low cholesterol levels. Hypertension affected 27.02% (1,031/3,815) of the cohort, with 42.78% (441/1,031) receiving antihypertensive medication. Treatment records indicated that 96.75% of individuals maintained stable and continuous treatment, while approximately 3% were lost to follow-up, transferred out, or deceased. The majority of participants (85.95%) presented with baseline viral loads below 100,000 copies/mL, and 63.94% maintained baseline CD4 levels exceeding 200 cells/μL, indicating the absence of severe immunosuppression. The most frequently prescribed antiretroviral medications were efavirenz (EFV), lamivudine (3TC), and tenofovir (TDF), with over half of the cohort receiving each of these agents (Table 1).
Variable Individuals Included in This Analysis Demographic characteristics Age in years [median (IQR)] 44.07 (33–55) Male sex (%) 3,536 (93.69) Southern/Northern region 3,814/1 Urban/Rural address 3,814/1 CVD-related risk factors BMI in kg/m2 [median (IQR)] 23.04 (20.83–24.77) ≥24 (%) 1,295 (33.94) SBP in mmHg [median (IQR)] 125.64 (116–134) DBP in mmHg [median (IQR)] 76.51 (70–83) Hypertension (%) 1,031 (27.02) Waist circumference in cm [median (IQR)] 81.32 (75–86) TC in mmol/L [median (IQR)] 4.56 (3.97–5.15) ≥5.2 (%) 909 (23.08) HDL-C in mmol/L [median (IQR)] 1.21 (0.99–1.37) <1 (%) 985 (25.82) LDL-C in mmol/L [median (IQR)] 2.82 (2.27–3.29) ≥3.4 (%) 848 (22.20) TG in mmol/L [median (IQR)] 2.58 (1.05–2.69) ≥1.7 (%) 1,880 (49.28) GFR in ml/(min·1.73m2) [median (IQR)] 94.96 (81–108) <60 (%) 123 (3.22) Dyslipidemia (%) 2,349 (61.57) Smoking (%) 1,060 (27.79) Family history of CVD (%) 396 (10.38) Diabetes status (%) Not diabetic 3,597 (94.29) Less than 10 years 132 (3.46) More than 10 years 86 (2.25) Use of antihypertensive drugs (%) 441 (11.56) HIV-related risk Factors Current status (%) Undergoing treatment 3,691 (96.75) Lost to follow-up 112 (2.94) Transferred out 4 (0.01) Death 8 (0.21) Baseline viral load in copies/mL (%) <100, 000 3,279 (85.95) 100,000–500,000 388 (10.17) >500,000 148 (3.88) Baseline CD4+T-Cell count in cells/μL (%) <200 1,376 (36.07) 200–350 1,360 (35.65) 351–800 1,036 (27.16) ≥801 43 (1.13) EFV-based ART 2,129 (55.81) TAF-based ART 912 (23.91) TDF-based ART 2,071 (54.29) INSTI-based ART 1,383 (36.25) PI-based ART 221 (5.80) ART duration in weeks 62 (22–105) Note: Hypertension is defined as blood pressure ≥140/90 mmHg, or in patients with hypertension taking antihypertensive medications.
Abbreviation: CVD=cardiovascular disease; BMI=body mass index; SBP=systolic blood pressure; DBP=diastolic blood pressure; TC=total cholesterol; HDL-C=high-density lipoprotein cholesterol; LDL-C=low-density lipoprotein; TG=triglyceride; GFR=glomerular filtration rate; EFV=efavirenz; TDF=tenofovir disoproxil fumarate; TAF=tenofovir alafenamide; INSTI=integrase strand transfer inhibitor; PI=protease inhibitor.Table 1. Demographic,cardiovascular, and HIV-related risk factors and clinical characteristics of the study population (n=3,815).
In the baseline population, 2,893 individuals aged 40-74 years met the age range requirements for all risk assessment tools. The five-year risk assessment revealed an overall population risk of 2.37% (95% CI: 2.26%, 2.48%) with the reduced D:A:D model, while the adjusted Framingham model estimated a risk of 2.50% (95% CI: 2.38%, 2.62%). The proportion of high-risk individuals for 5-year risk ranged from 2.45% (95% CI: 1.93%, 3.10%) to 3.39% (95% CI: 2.78%, 4.13%). 10-year risk assessment using five different tools demonstrated substantial variation in both mean risk values and high-risk population proportions. The China-PAR identified the smallest proportion of high-risk individuals at 7.85% (95% CI: 6.91%, 8.90%), while the FHS-CVD identified the highest at 31.94%. The Chinese guidelines for lipid management, ACC/AHA-ASCVD, and EACS criteria identified high-risk groups comprising 14.86% (95% CI: 13.60%, 16.22%), 20.26% (95% CI: 18.81%, 21.78%), and 26.58% (95% CI: 24.99%, 28.24%) of the population, respectively. The 10-year overall risk estimates spanned from 3.42% (95% CI: 3.28%, 3.56%) to 18.35% (95% CI: 17.70%, 19.00%). Subgroup analysis revealed statistically significant mean differences within each subgroup across all models (P<0.05). Risk assessment results are summarized in Table 2. Inter-rater reliability assessment of the grading outcomes yielded a Fleiss’ kappa coefficient of 0.51. A Wayne diagram (Figure 1A) revealed that 137 (4.7%) individuals were classified as high risk across all 10-year tools. Comprehensive grading analysis and mosaic visualization were performed using 10-year tools (Figure 1B).
Subgroup D:A:D study, mean (95% CI) FHS-CVD,
mean (95% CI)China-PAR,
mean (95% CI)ACC/AHA-ASCVD,
mean (95% CI)EACS,
mean (95% CI)Chinese guidelines for lipid management,
mean (95% CI)D:A:D reduced model 5-years Framingham model Overall 2.37
(2.26, 2.48)2.50
(2.38, 2.62)18.35
(17.70, 19.00)3.42
(3.28, 3.56)11.17
(10.67,
11.68)Gender Female 1.75
(1.54, 1.96)1.65
(1.42, 1.88)13.07
(11.58, 14.56)2.08
(1.83, 2.33)7.88
(6.65, 9.11)Male 2.42
(2.30, 2.54)2.58
(2.45, 2.70)18.82
(18.13, 19.52)3.54
(3.39, 3.70)11.47
(10.94, 12.00)Age, years ≤40 0.62
(0.59, 0.65)0.68
(0.65, 0.71)6.08
(5.85, 6.32)1.06
(0.96, 1.16)2.35
(2.20, 2.50)41–50 1.48
(1.40, 1.56)1.56
(1.48, 1.64)13.27
(12.69, 13.85)2.20
(2.05, 2.35)6.07
(5.68, 6.45)51–60 3.58
(3.35, 3.81)3.78
(3.53, 4.04)28.10
(26.72, 29.48)5.21
(4.91, 5.51)16.39
(15.46, 17.31)61–70 5.96
(5.56, 6.36)6.18
(5.77, 6.59)40.75
(39, 42.51)8.04
(7.68, 8.40)30.04
(28.77, 31.31)≥71 7.03
(6.12, 7.95)7.84
(6.76, 8.92)49.88
(45.58, 54.17)10.71
(9.67, 11.76)43.67
(40.51, 46.83)Diabetes Yes 8.08
(7.17, 9.00)8.29
(7.38, 9.20)48.09
(44.54, 51.63)9.28
(8.45, 10.11)35.02
(31.87, 38.17)No 1.98
(1.90, 2.06)2.11
(2.01, 2.20)16.33
(15.75, 16.91)3.03
(2.90, 3.15)9.55
(9.13, 9.98)High risk Proportion 2.94
(2.37, 3.64)3.39
(2.78, 4.13)31.94
(30.25, 33.68)7.85
(6.91, 8.90)20.26
(18.81, 21.78)26.58
(24.99, 28.24)14.86
(13.60, 16.22)Abbreviation: CVD=cardiovascular disease; D:A:D=data-collection on adverse effects of anti-HIV drugs study; 5-years Framingham model=the Framingham model calibrated to the D:A:D data; ASCVD=atherosclerotic cardiovascular disease; FHS-CVD=the Framingham 2008 ASCVD risk score; ACC/AHA-ASCVD=the American College of Cardiology/American Heart Association 2013 ASCVD risk score; China-PAR=the predicting the 10-year risks of atherosclerotic cardiovascular disease in the Chinese population; EACS=European AIDS Clinical Society guidelines. Table 2. Risk estimates and high-risk population proportions across assessment models (n=2,893) [mean (95% CI)].
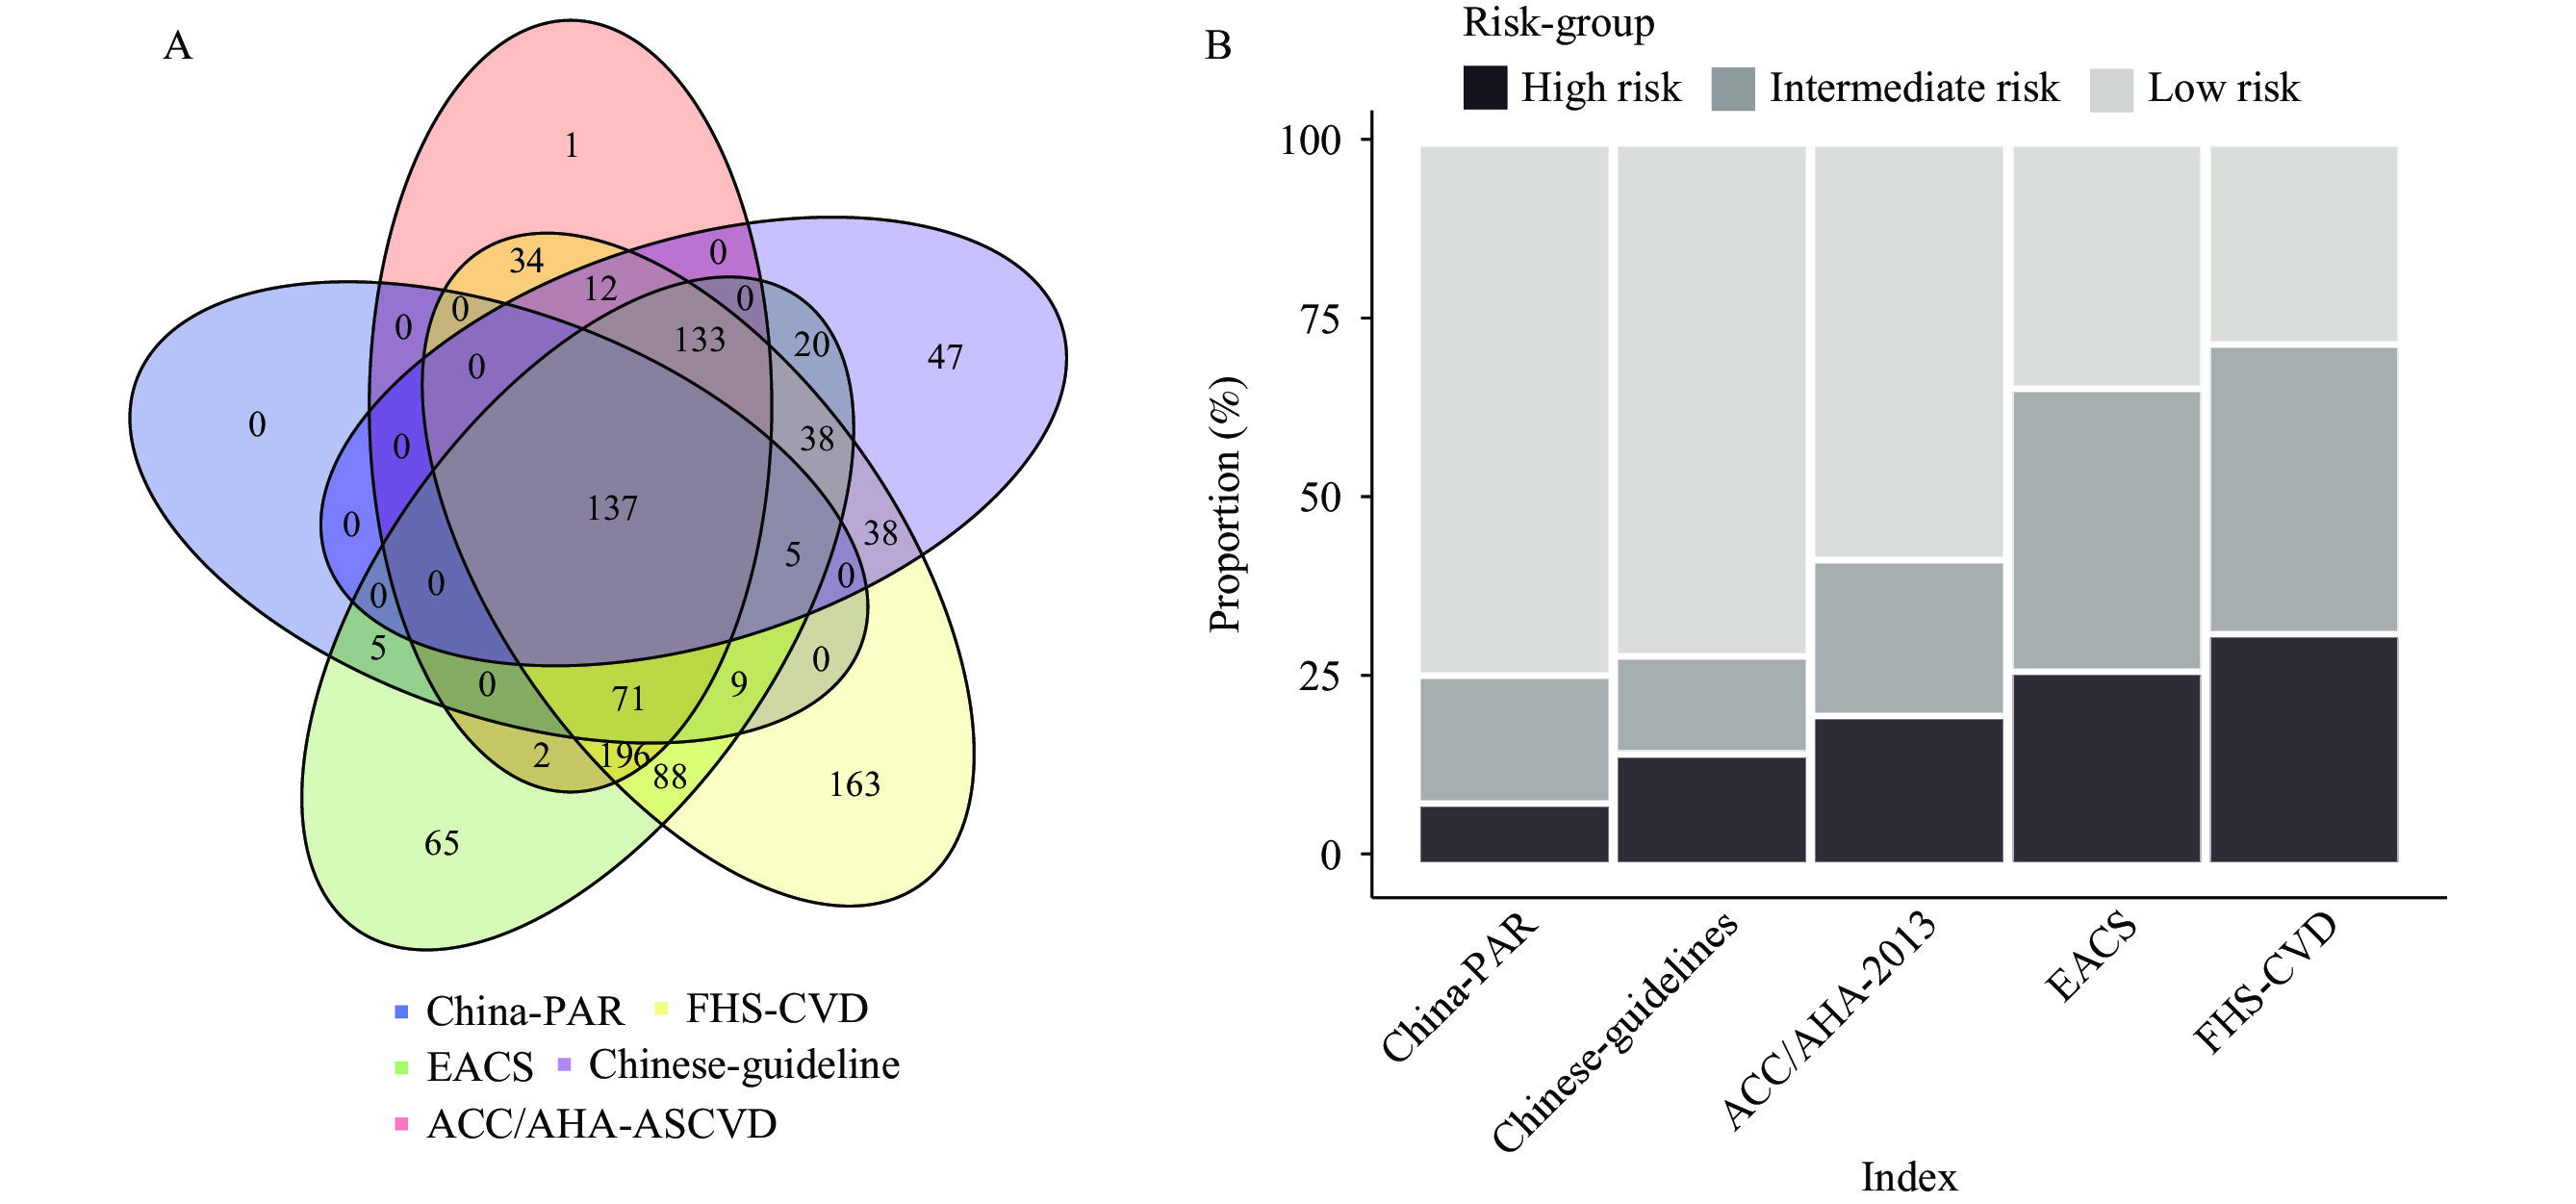 Figure 1.
Overlap and Distribution of High-Risk Classifications Across Five Assessment Tools: A) Venn diagram showing overlap of high-risk classifications across five assessment criteria; B) Mosaic plot illustrating risk classification distribution under different criteria.
Abbreviation: China-PAR=the predicting the 10-year risks of atherosclerotic cardiovascular disease in Chinese population; EACS=European AIDS Clinical Society guidelines; FHS-CVD=the Framingham 2008 ASCVD risk score; ACC/AHA-ASCVD=the American College of Cardiology/American Heart Association 2013 ASCVD risk score. -
Our 10-year risk assessment revealed that 7.85% to 31.94% of HIV-infected individuals are at high risk for CVD, highlighting a significant health concern that demands attention. While HIV-infected individuals typically exhibit more traditional risk factors, these alone cannot fully explain their elevated CVD risk (9). Therefore, systematic risk screening among the HIV population is crucial. The Chinese guidelines for diagnosis and treatment of HIV infection/AIDS (2024 edition) mandate regular CVD risk assessments, screenings, and preventive interventions for all HIV-infected individuals (2). For high-risk individuals, ART regimens should be modified accordingly, with active management of CVD risk factors, including smoking cessation, glycemic control, lipid management, obesity, and hypertension. Among antiviral medications, protease inhibitors and non-nucleoside reverse transcriptase inhibitors have a higher propensity to cause lipid metabolism disorders. Given the high usage rate of EFV observed in our study, individuals on these medications may require ART regimen modifications.
Based on our findings and current guideline recommendations, proactive CVD risk screening, and targeted interventions for the HIV population are imperative. However, our study revealed that fewer than half of hypertensive individuals received antihypertensive treatment, and effective interventions for risk factors such as smoking and dyslipidemia were inadequate. This underscores the need for enhanced primary prevention efforts, particularly in screening high-risk populations and implementing timely antihypertensive and lipid-lowering interventions to reduce CVD risk.
CVD risk screening should be integrated into routine clinical management of HIV, necessitating appropriate screening tools. However, current risk screening tools have significant limitations. General population prediction models show reduced accuracy in HIV-infected individuals due to factors such as drug toxicity and immune reconstitution (9). Our study demonstrated poor consistency among the five tools used for 10-year CVD risk assessment in the general population. This inconsistency partly stems from differences in outcome indicators. Most predictive model cohorts were established in the last century, and temporal changes in lifestyle and environmental factors may compromise their current accuracy. In clinical practice, this poor consistency results in different models identifying distinct patient groups for intervention, leading to varied preventive care decisions. Treating HIV-infected individuals as part of the general population for cardiovascular prevention fails to account for the increased CVD risk associated with HIV infection itself. While the D:A:D model was specifically designed for HIV-infected populations, it lacks external validation and excludes the Asian population data. In the absence of an accurate and reliable model, priority should be given to determining the most suitable predictive model for Asian HIV-infected populations and developing a new CVD risk assessment model for HIV-infected individuals. Previous studies have suggested that FHS-CVD is most useful for determining statin eligibility in primary prevention; however, its significant differences in outcome indicators make it generally incomparable with other models (10).
Our study has several limitations. First, reliance on voluntary participation in daily follow-up surveys may introduce volunteer bias. Second, identifying valid cases through patient-reported treatment numbers is susceptible to input errors and duplications. Despite manual screening and comparison of treatment records for baseline population data, some missing data persist. Finally, the cross-sectional nature of this baseline survey in an HIV-infected population without a control group precludes comparisons with the general population. Continued follow-up of the study population is necessary to validate these findings, particularly regarding observed outcome events.
In conclusion, our comprehensive evaluation using six risk assessment tools reveals a substantial CVD risk burden among Shanghai’s HIV population. The high prevalence of traditional CVD risk factors in this population, coupled with inadequate management, emphasizes the urgent need for systematic screening and intervention programs. Furthermore, our findings underscore the critical importance of developing HIV-specific CVD screening tools tailored to the Chinese population.
-
The authors express their gratitude to all investigators from the Shanghai Public Health Clinical Center and Shanghai Institute of Infectious Disease and Biosecurity.
-
Received ethics approval from the Shanghai Public Health Clinical Center Ethics Committee (2021-S051-01).
HTML
| Citation: |

|