
 Download:


-
Introduction: In China, the prevalence of abnormal spinal curvature in children and adolescents is high and the number of cases is increasing in recent years, which seriously threatens physical and mental health of children and adolescents. Public health surveillance of these abnormalities is crucial for developing targeted interventions.
Methods: This study evaluated detection rates and risk factors of spinal curvature abnormalities among children and adolescents in Jiangsu Province, China. This study analyzed data from the population-based “Surveillance for Common Disease and Health Risk Factors Among Students” project, implemented annually from September to November during 2021–2023. Abnormal spinal curvature was assessed using the national “Technical Guide for Prevention and Control of Abnormal Spinal Curvature in Children and Adolescents.” Detection rates were calculated, and associated factors were evaluated using multivariate logistic regression.
Results: Annual detection rates were 2.6%, 1.8%, and 2.3%, respectively, among children and adolescents aged 6–17 years. Detection rates increased with age and were significantly higher among females compared to males. Adequate physical activity, sufficient sleep, and correct reading and writing postures were protective factors against spinal curvature abnormalities, while low body weight was associated with increased risk.
Conclusion: The emerging burden of abnormal spinal curvature necessitates targeted public health interventions, particularly for high school students and females. Beyond implementing early lifestyle interventions such as sufficient outdoor activities, appropriate referrals to public health specialists and orthopedic surgeons may provide additional risk mitigation. Successful outcomes require multisectoral collaboration and parental engagement to achieve sustainable public health improvements.
-
Abnormal spinal curvature significantly impacts both the physical and mental well-being of children and adolescents. Adolescent idiopathic scoliosis (AIS) represents the most prevalent form of abnormal spinal curvature, affecting 1%–4% of adolescents with a notable predisposition toward females (1). In China, spinal curvature abnormalities have emerged as a major public health challenge, with detection rates among primary and secondary school students reaching 2.8% in 2019 (2). This study aimed to evaluate temporal trends in detection rates and identify risk factors associated with spinal curvature abnormalities among children and adolescents in Jiangsu Province, China. Systematic public health surveillance of spinal curvature abnormalities in this population is essential for developing targeted interventions.
This study utilized data from the “Surveillance for Common Disease and Health Risk Factors Among Students” program conducted across all 13 prefecture-level administrative regions in Jiangsu Province. The program methodology has been detailed elsewhere (3). The surveillance coverage expanded progressively: in 2021, a pilot study encompassed 26 districts and counties; in 2022, coverage increased to 88 districts; and by 2023, the program included all 98 districts and counties in Jiangsu. While a cohort design would have enabled incidence estimation, the current study employed cross-sectional sampling each year. Efforts to establish a longitudinal cohort for incidence rate calculations are ongoing and will be reported separately. This study implemented standardized training protocols for all field personnel and maintained rigorous quality control measures for data management. To validate temporal trends given the varying coverage, supplementary analyses were conducted using simple random sampling of two distinct districts per city annually. The questionnaire response rate achieved 97.7%.
Following the UN Convention on the Rights of the Child’s definition of children as those aged 18 years and under, and considering the impact of growth spurts on spinal curvature development, this study adopted the term “children and adolescents” for this study. All variables, except abnormal spinal curvature and body mass index (BMI), were self-reported by participants. Spinal curvature abnormality was defined as spinal curvature exceeding normal physiological ranges, encompassing both scoliosis and sagittal spinal abnormalities. Screening procedures adhered to the national “Technical Guide for Prevention and Control of Abnormal Spinal Curvature in Children and Adolescents”. BMI was calculated as weight in kilograms divided by height in meters squared, with measurements conducted by trained research associates using standardized equipment and protocols (height measured to 0.1 cm, weight to 0.1 kg). Detailed variable definitions are presented in corresponding table.
Statistical analyses were conducted using R Software (version 4.4.0; The R Foundation for Statistical Computing, Vienna, Austria). This study summarized categorical variables using frequencies and percentages, employing Chi-square tests to assess proportional differences. Risk factors associated with abnormal spinal curvature were evaluated using multivariate logistic regression, with variable selection informed by both lasso technique and existing literature. Statistical significance was set at P<0.05.
A total of 370,000 children and adolescents aged 6–17 years participated in the surveillance program during 2021–2023, comprising 47,310 participants in 2021, 150,387 in 2022, and 173,341 in 2023. The study population included 168,787 (45.5%) children aged 6–11 years and 202,251 (54.5%) adolescents aged 12–17 years, with a slight male predominance (193,518, 52.2% vs. 177,520, 47.8% females) and higher urban representation (197,654, 53.3% vs. 173,384, 46.7% rural). The annual detection rates of abnormal spinal curvature were 2.6%, 1.8%, and 2.3% for 2021, 2022, and 2023, respectively. Geographic variation in detection rates was observed across the 13 municipalities of Jiangsu Province (Table 1). Validation analyses confirmed that the temporal pattern of detection rates was consistent with the primary analysis (
Supplementary Table S1 ). Age-stratified analyses revealed that detection rates increased with age, with males showing a marked increase at age 11 while females demonstrated an earlier increase at age 9 (Figure 1). Higher detection rates were observed among females compared to males (3.1% vs. 2.4%), senior high school students compared to primary and junior high school students (4.1% vs. 1.3% and 3.3%, respectively), students experiencing growth spurts compared to those who were not (2.8% vs. 2.0%), and students with insufficient physical activities compared to those with sufficient activities (2.8% vs. 1.9%) (Supplementary Table S1 ).Prefecture-level administrative regions 2021 2022 2023 Total N n Rate
(95% CI)N n Rate
(95% CI)N n Rate
(95% CI)N n Rate
(95% CI)Nanjing 3,419 132 3.86
(3.21, 4.51)13,485 196 1.45
(1.25, 1.66)19,613 619 3.16
(2.91, 3.40)36,517 947 2.59
(2.43, 2.76)Wuxi 3,562 176 4.94
(4.23, 5.65)12,776 218 1.71
(1.48, 1.93)13,104 482 3.68
(3.36, 4.00)29,442 876 2.98
(2.78, 3.17)Xuzhou 3,684 54 1.47
(1.08, 1.85)17,427 154 0.88
(0.74, 1.02)17,862 152 0.85
(0.72, 0.99)38,973 360 0.92
(0.83, 1.02)Changzhou 3,669 122 3.33
(2.75, 3.91)9,504 128 1.35
(1.12, 1.58)12,293 311 2.53
(2.25, 2.81)25,466 561 2.20
(2.02, 2.38)Suzhou 3,613 66 1.83
(1.39, 2.26)16,438 625 3.80
(3.51, 4.09)18,880 736 3.90
(3.62, 4.17)38,931 1,427 3.67
(3.48, 3.85)Nantong 3,877 157 4.05
(3.43, 4.67)9,646 537 5.57
(5.11, 6.02)13,221 389 2.94
(2.65, 3.23)26,744 1,083 4.05
(3.81, 4.29)Lianyungang 3,657 67 1.83
(1.40, 2.27)10,544 215 2.04
(1.77, 2.31)10,884 332 3.05
(2.73, 3.37)25,085 614 2.45
(2.26, 2.64)Huai’an 3,702 10 0.27
(0.10, 0.44)12,317 159 1.29
(1.09, 1.49)12,435 382 3.07
(2.77, 3.38)28,454 551 1.94
(1.78, 2.10)Yancheng 3,612 23 0.64
(0.38, 0.90)16,154 251 1.55
(1.36, 1.74)15,393 126 0.82
(0.68, 0.96)35,159 400 1.14
(1.03, 1.25)Yangzhou 3,507 96 2.74
(2.20, 3.28)8,722 39 0.45
(0.31, 0.59)9,865 202 2.05
(1.77, 2.33)22,094 337 1.53
(1.36, 1.69)Zhenjiang 3,644 169 4.64
(3.95, 5.32)10,699 119 1.11
(0.91, 1.31)10,334 97 0.94
(0.75, 1.12)24,677 385 1.56
(1.41, 1.71)Taizhou 3,625 97 2.68
(2.15, 3.20)3,662 11 0.30
(0.12, 0.48)10,521 160 1.52
(1.29, 1.75)17,808 268 1.50
(1.33, 1.68)Suqian 3,739 55 1.47
(1.09, 1.86)9,013 27 0.30
(0.19, 0.41)8,936 79 0.88
(0.69, 1.08)21,688 161 0.74
(0.63, 0.86)Abbreviation: CI=confidence interval. Table 1. Detection rate of abnormal spinal curvature among children and adolescents across 13 municipalities in Jiangsu Province, 2021–2023.
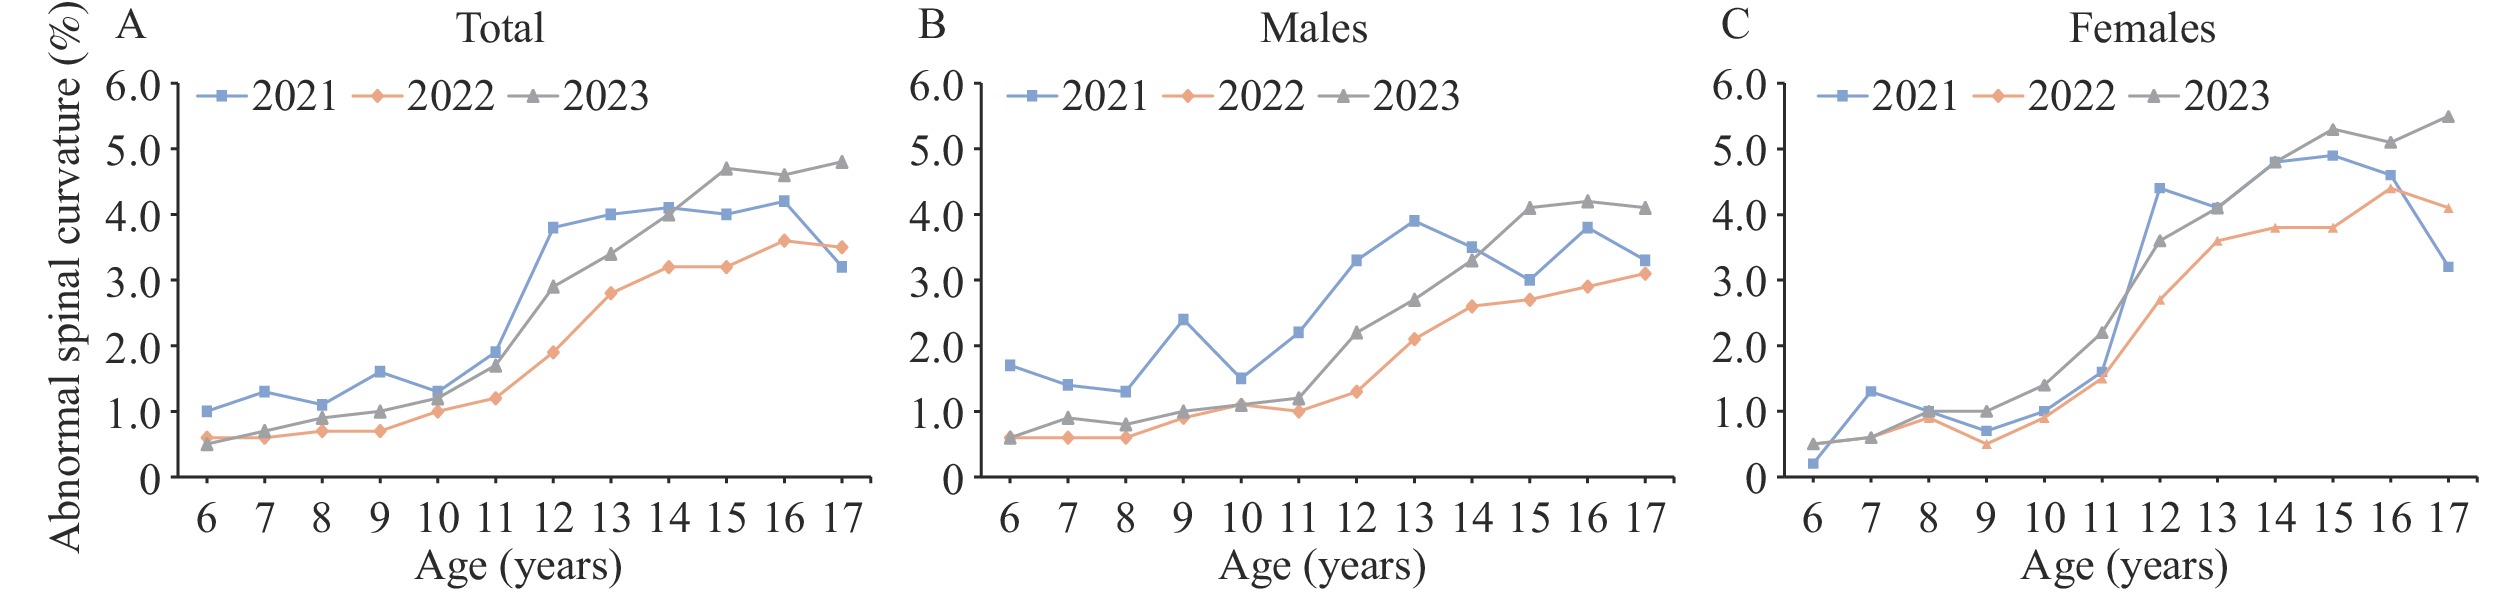 Figure 1.
Age-specific detection rates of abnormal spinal curvature among children and adolescents aged 6–17 years in Jiangsu Province, 2021–2023. (A) All children and adolescents; (B) Males; (C) Females.
Detection rates of abnormal spinal curvature among children and adolescents in Jiangsu Province from 2021 to 2023 showed significant differences (P<0.001) across multiple factors, including region, district, gender, grade, BMI, growth and development period, physical activities, sleep, reading and writing posture, schoolbag habits, schoolbag weight, mattress softness, and sitting and standing posture (Table 2).
Variables 2021 2022 2023 Total N n Rate
(95% CI)P N n Rate
(95% CI)P N n Rate
(95% CI)P N n Rate
(95% CI)P Region <0.001 <0.001 <0.001 <0.001 Southern Jiangsu 12,934 571 4.41
(4.06, 4.77)45,298 1,173 2.59
(2.44, 2.74)54,188 2,067 3.81
(3.65, 3.98)112,420 3,811 3.39
(3.28, 3.50)Central Jiangsu 7,940 328 4.13
(3.69, 4.57)15,686 535 3.41
(3.13, 3.69)24,216 680 2.81
(2.60, 3.02)47,842 1,543 3.23
(3.07, 3.38)Northern Jiangsu 13,273 176 1.33
(1.13, 1.52)46,401 692 1.49
(1.38, 1.60)46,959 962 2.05
(1.92, 2.18)106,633 1,830 1.72
(1.64, 1.79)District <0.001 <0.001 <0.001 <0.001 Urban 19,091 383 2.01
(1.81, 2.21)59,215 1,188 2.01
(1.89, 2.12)67,693 2,154 3.18
(3.05, 3.31)145,999 3,725 2.55
(2.47, 2.63)Rural 15,056 692 4.60
(4.26, 4.93)48,170 1,212 2.52
(2.38, 2.66)57,670 1,555 2.70
(2.56, 2.83)120,896 3,459 2.86
(2.77, 2.96)Gender 0.153 <0.001 <0.001 <0.001 Male 17,742 535 3.02
(2.76, 3.27)56,277 1,021 1.81
(1.70, 1.92)65,229 1,628 2.50
(2.38, 2.62)139,248 3,184 2.29
(2.21, 2.37)Female 16,405 540 3.29
(3.02, 3.56)51,108 1,379 2.70
(2.56, 2.84)60,134 2,081 3.46
(3.31, 3.61)127,647 4,000 3.13
(3.04, 3.23)Grade <0.001 <0.001 <0.001 <0.001 Primary school 13,161 218 1.66
(1.44, 1.87)42,971 450 1.05
(0.95, 1.14)47,568 649 1.36
(1.26, 1.47)103,700 1,317 1.27
(1.20, 1.34)Junior High School 12,651 534 4.22
(3.87, 4.57)40,432 1,131 2.80
(2.64, 2.96)47,397 1,650 3.48
(3.32, 3.65)100,480 3,315 3.30
(3.19, 3.41)Senior High School 8,335 323 3.88
(3.46, 4.29)23,982 819 3.42
(3.19, 3.64)30,398 1,410 4.64
(4.40, 4.87)62,715 2,552 4.07
(3.91, 4.22)BMI* <0.001 <0.001 <0.001 <0.001 Normal 19,946 715 3.58
(3.33, 3.84)63,169 1,746 2.76
(2.64, 2.89)72,390 2,691 3.72
(3.58, 3.86)155,505 5,152 3.31
(3.22, 3.40)Underweight 1,220 48 3.93
(2.84, 5.03)3,656 113 3.09
(2.53, 3.65)5,935 296 4.99
(4.43, 5.54)10,811 457 4.23
(3.85, 4.61)Overweight 6,521 172 2.64
(2.25, 3.03)20,234 322 1.59
(1.42, 1.76)22,558 417 1.85
(1.67, 2.02)49,313 911 1.85
(1.73, 1.97)Obesity 6,460 140 2.17
(1.81, 2.52)20,326 219 1.08
(0.94, 1.22)24,480 305 1.25
(1.11, 1.38)51,266 664 1.30
(1.20, 1.39)Growth and development period <0.001 <0.001 <0.001 <0.001 No 17,777 415 2.33
(2.11, 2.56)56,992 729 1.28
(1.19, 1.37)100,871 2,851 0.62
(0.57, 0.67)175,640 3,995 1.95
(1.86, 2.04)Yes 16,370 660 4.03
(3.73, 4.33)50,393 1,671 3.32
(3.16, 3.47)24,492 858 3.50
(3.27, 3.73)91,255 3,189 3.49
(3.38, 3.61)MVPA† <0.001 <0.001 <0.001 <0.001 Insufficient 29,127 959 3.30
(3.09, 3.50)91,005 2,166 2.38
(2.28, 2.48)106,971 3,297 3.08
(2.98, 3.19)227,103 6,422 2.83
(2.76, 2.90)Sufficient 5,020 116 2.31
(1.90, 2.73)16,380 234 1.43
(1.25, 1.61)18,392 412 2.24
(2.03, 2.45)39,792 762 1.91
(1.78, 2.05)Sleep§ <0.001 <0.001 <0.001 <0.001 Insufficient 26,378 872 3.31
(3.09, 3.53)82,306 1,991 2.42
(2.31, 2.52)97,783 3,028 3.10
(2.99, 3.21)206,467 5,891 2.85
(2.78, 2.93)Sufficient 7,769 203 2.61
(2.26, 2.97)25,079 409 1.63
(1.47, 1.79)27,580 681 2.47
(2.29, 2.65)60,428 1,293 2.14
(2.02, 2.26)Reading and writing posture 0.055 <0.001 <0.001 <0.001 Incorrect 23,124 757 3.28
(3.05, 3.51)75,489 1,846 2.45
(2.34, 2.56)90,572 2,826 3.12
(3.01, 3.23)189,185 5,429 2.87
(2.79, 2.94)Correct 11,023 318 2.88
(2.57, 3.20)31,896 554 1.74
(1.59, 1.88)34,791 883 2.54
(2.37, 2.70)77,710 1,755 2.26
(2.15, 2.36)Schoolbag habits 0.002 0.004 <0.001 <0.001 On the chest 2,269 45 1.98
(1.41, 2.56)6,763 112 1.66
(1.35, 1.96)9,215 197 2.14
(1.84, 2.43)18,247 354 1.94
(1.74, 2.14)On the back 26,466 844 3.19
(2.98, 3.40)83,457 1,878 2.25
(2.15, 2.35)96,696 2,901 3.00
(2.89, 3.11)206,619 5,623 2.72
(2.65, 2.79)On one side 2,721 108 3.97
(3.24, 4.70)8,617 220 2.55
(2.22, 2.89)9,866 347 3.52
(3.15, 3.88)21,204 675 3.19
(2.95, 3.42)Shoulder bag 2,248 65 2.89
(2.20, 3.58)7,252 166 2.29
(1.94, 2.63)8,158 232 2.84
(2.48, 3.20)17,658 463 2.62
(2.39, 2.86)Schoolbag with wheels 443 13 2.93
(1.36, 4.51)1,296 24 1.85
(1.12, 2.59)1,428 32 2.24
(1.47, 3.01)3,167 69 2.18
(1.67, 2.69)Schoolbag Weight 0.028 <0.001 <0.001 <0.001 Very light 3,165 72 2.27
(1.76, 2.79)9,561 165 1.73
(1.46, 1.99)14,234 391 2.75
(2.48, 3.02)26,960 628 2.33
(2.15, 2.51)Relatively light 5,572 184 3.30
(2.83, 3.77)17,617 417 2.37
(2.14, 2.59)21,342 721 3.38
(3.14, 3.62)44,531 1,322 2.97
(2.81, 3.13)Medium 17,368 584 3.36
(3.09, 3.63)55,637 1,298 2.33
(2.21, 2.46)60,984 1,857 3.05
(2.91, 3.18)133,989 3,739 2.79
(2.70, 2.88)Relatively heavy 5,435 157 2.89
(2.44, 3.33)17,026 389 2.28
(2.06, 2.51)19,154 497 2.59
(2.37, 2.82)41,615 1,043 2.51
(2.36, 2.66)Very heavy 1,879 57 3.03
(2.26, 3.81)5,562 97 1.74
(1.40, 2.09)6,861 174 2.54
(2.16, 2.91)14,302 328 2.29
(2.05, 2.54)Unknown 728 21 2.88
(1.67, 4.10)1,982 34 1.72
(1.14, 2.29)2,788 69 2.47
(1.90, 3.05)5,498 124 2.26
(1.86, 2.65)Regular seat changes 0.067 0.214 0.114 0.077 No 13,052 382 2.93
(2.64, 3.22)39,218 847 2.16
(2.02, 2.30)52,736 1,513 2.87
(2.73, 3.01)105,006 2,742 2.61
(2.51, 2.71)Yes 21,095 693 3.29
(3.04, 3.53)68,167 1,553 2.28
(2.17, 2.39)72,627 2,196 3.02
(2.90, 3.15)161,889 4,442 2.74
(2.66, 2.82)Softness of mattress 0.125 <0.001 0.002 <0.001 Soft 4,683 125 2.67
(2.21, 3.13)17,250 305 1.77
(1.57, 1.96)20,322 525 2.58
(2.37, 2.80)42,255 955 2.26
(2.12, 2.40)Medium 26,767 864 3.23
(3.02, 3.44)82,861 1,927 2.33
(2.22, 2.43)94,097 2,839 3.02
(2.91, 3.13)203,725 5,630 2.76
(2.69, 2.84)Hard 2,697 86 3.19
(2.53, 3.85)7,274 168 2.31
(1.96, 2.65)10,944 345 3.15
(2.83, 3.48)20,915 599 2.86
(2.64, 3.09)Sole wear patterns
(left/right)0.057 0.676 0.699 0.615 No difference 32,187 1,031 3.20
(3.01, 3.40)100,740 2,256 2.24
(2.15, 2.33)116,961 3,457 2.96
(2.86, 3.05)249,888 6,744 2.70
(2.64, 2.76)Left 867 18 2.08
(1.13, 3.03)2,964 69 2.33
(1.79, 2.87)3,677 104 2.83
(2.29, 3.36)7,508 191 2.54
(2.19, 2.90)Right 1,093 26 2.38
(1.48, 3.28)3,681 75 2.04
(1.58, 2.49)4,725 148 3.13
(2.64, 3.63)9,499 249 2.62
(2.30, 2.94)Sole wear patterns
(inside/outside)0.922 0.839 0.1 0.266 No difference 30,596 962 3.14
(2.95, 3.34)94,874 2,112 2.23
(2.13, 2.32)111,363 3,276 2.94
(2.84, 3.04)236,833 6,350 2.68
(2.62, 2.75)Inside 1,259 42 3.34
(2.34, 4.33)4,384 99 2.26
(1.82, 2.70)5,256 181 3.44
(2.95, 3.94)10,899 322 2.95
(2.64, 3.27)Outside 2,292 71 3.10
(2.39, 3.81)8,127 189 2.33
(2.00, 2.65)8,744 252 2.88
(2.53, 3.23)19,163 512 2.67
(2.44, 2.90)Sitting and standing posture <0.001 <0.001 <0.001 <0.001 Just be comfortable 6,697 229 3.42
(2.98, 3.85)24,439 566 2.32
(2.13, 2.50)34,354 1,077 3.14
(2.95, 3.32)65,490 1,872 2.86
(2.73, 2.99)Sometimes monitor myself 12,857 459 3.59
(3.25, 3.89)40,268 1,068 2.65
(2.50, 2.81)48,056 1,581 3.29
(3.13, 3.45)101,181 3,108 3.07
(2.97, 3.18)Keep reminding myself 6,825 204 2.99
(2.59, 3.39)20,539 405 1.97
(1.78, 2.16)21,472 608 2.83
(2.61, 3.05)48,836 1,217 2.49
(2.35, 2.63)Maintain good posture at all time 7,768 183 2.36
(2.02, 2.69)22,139 361 1.63
(1.46, 1.80)21,481 443 2.06
(1.87, 2.25)51,388 987 1.92
(1.80, 2.04)Abbreviation: CI=confidence interval; BMI=body mass index; MVPA=Moderate to vigorous physical activity.
* BMI categorization was based on the “Screening standard for malnutrition of school-age children and adolescents” and the “Screening for overweight and obesity among school-age children and adolescents,” using age-specific values.
†MVPA was categorized as sufficient or insufficient based on whether an individual achieved more than 60 minutes of MVPA per day.
§ According to the ‘Notice on Further Strengthening the Management of Sleep for Primary and Secondary School Students’ issued by the Ministry of Education of China, insufficient sleep was defined as self-reported sleep of less than 10 hours per day for primary school students, less than 9 hours for junior high school students, and less than 8 hours for senior high school students.Table 2. Detection rates of abnormal spinal curvature among children and adolescents in Jiangsu Province, 2021–2023.
Multivariate analysis revealed protective effects associated with sufficient physical activities, adequate sleep, and correct reading and writing posture, each corresponding to lower odds of abnormal spinal curvature. Conversely, higher academic grades, female gender, and being underweight were associated with increased odds of abnormal spinal curvature (Figure 2).
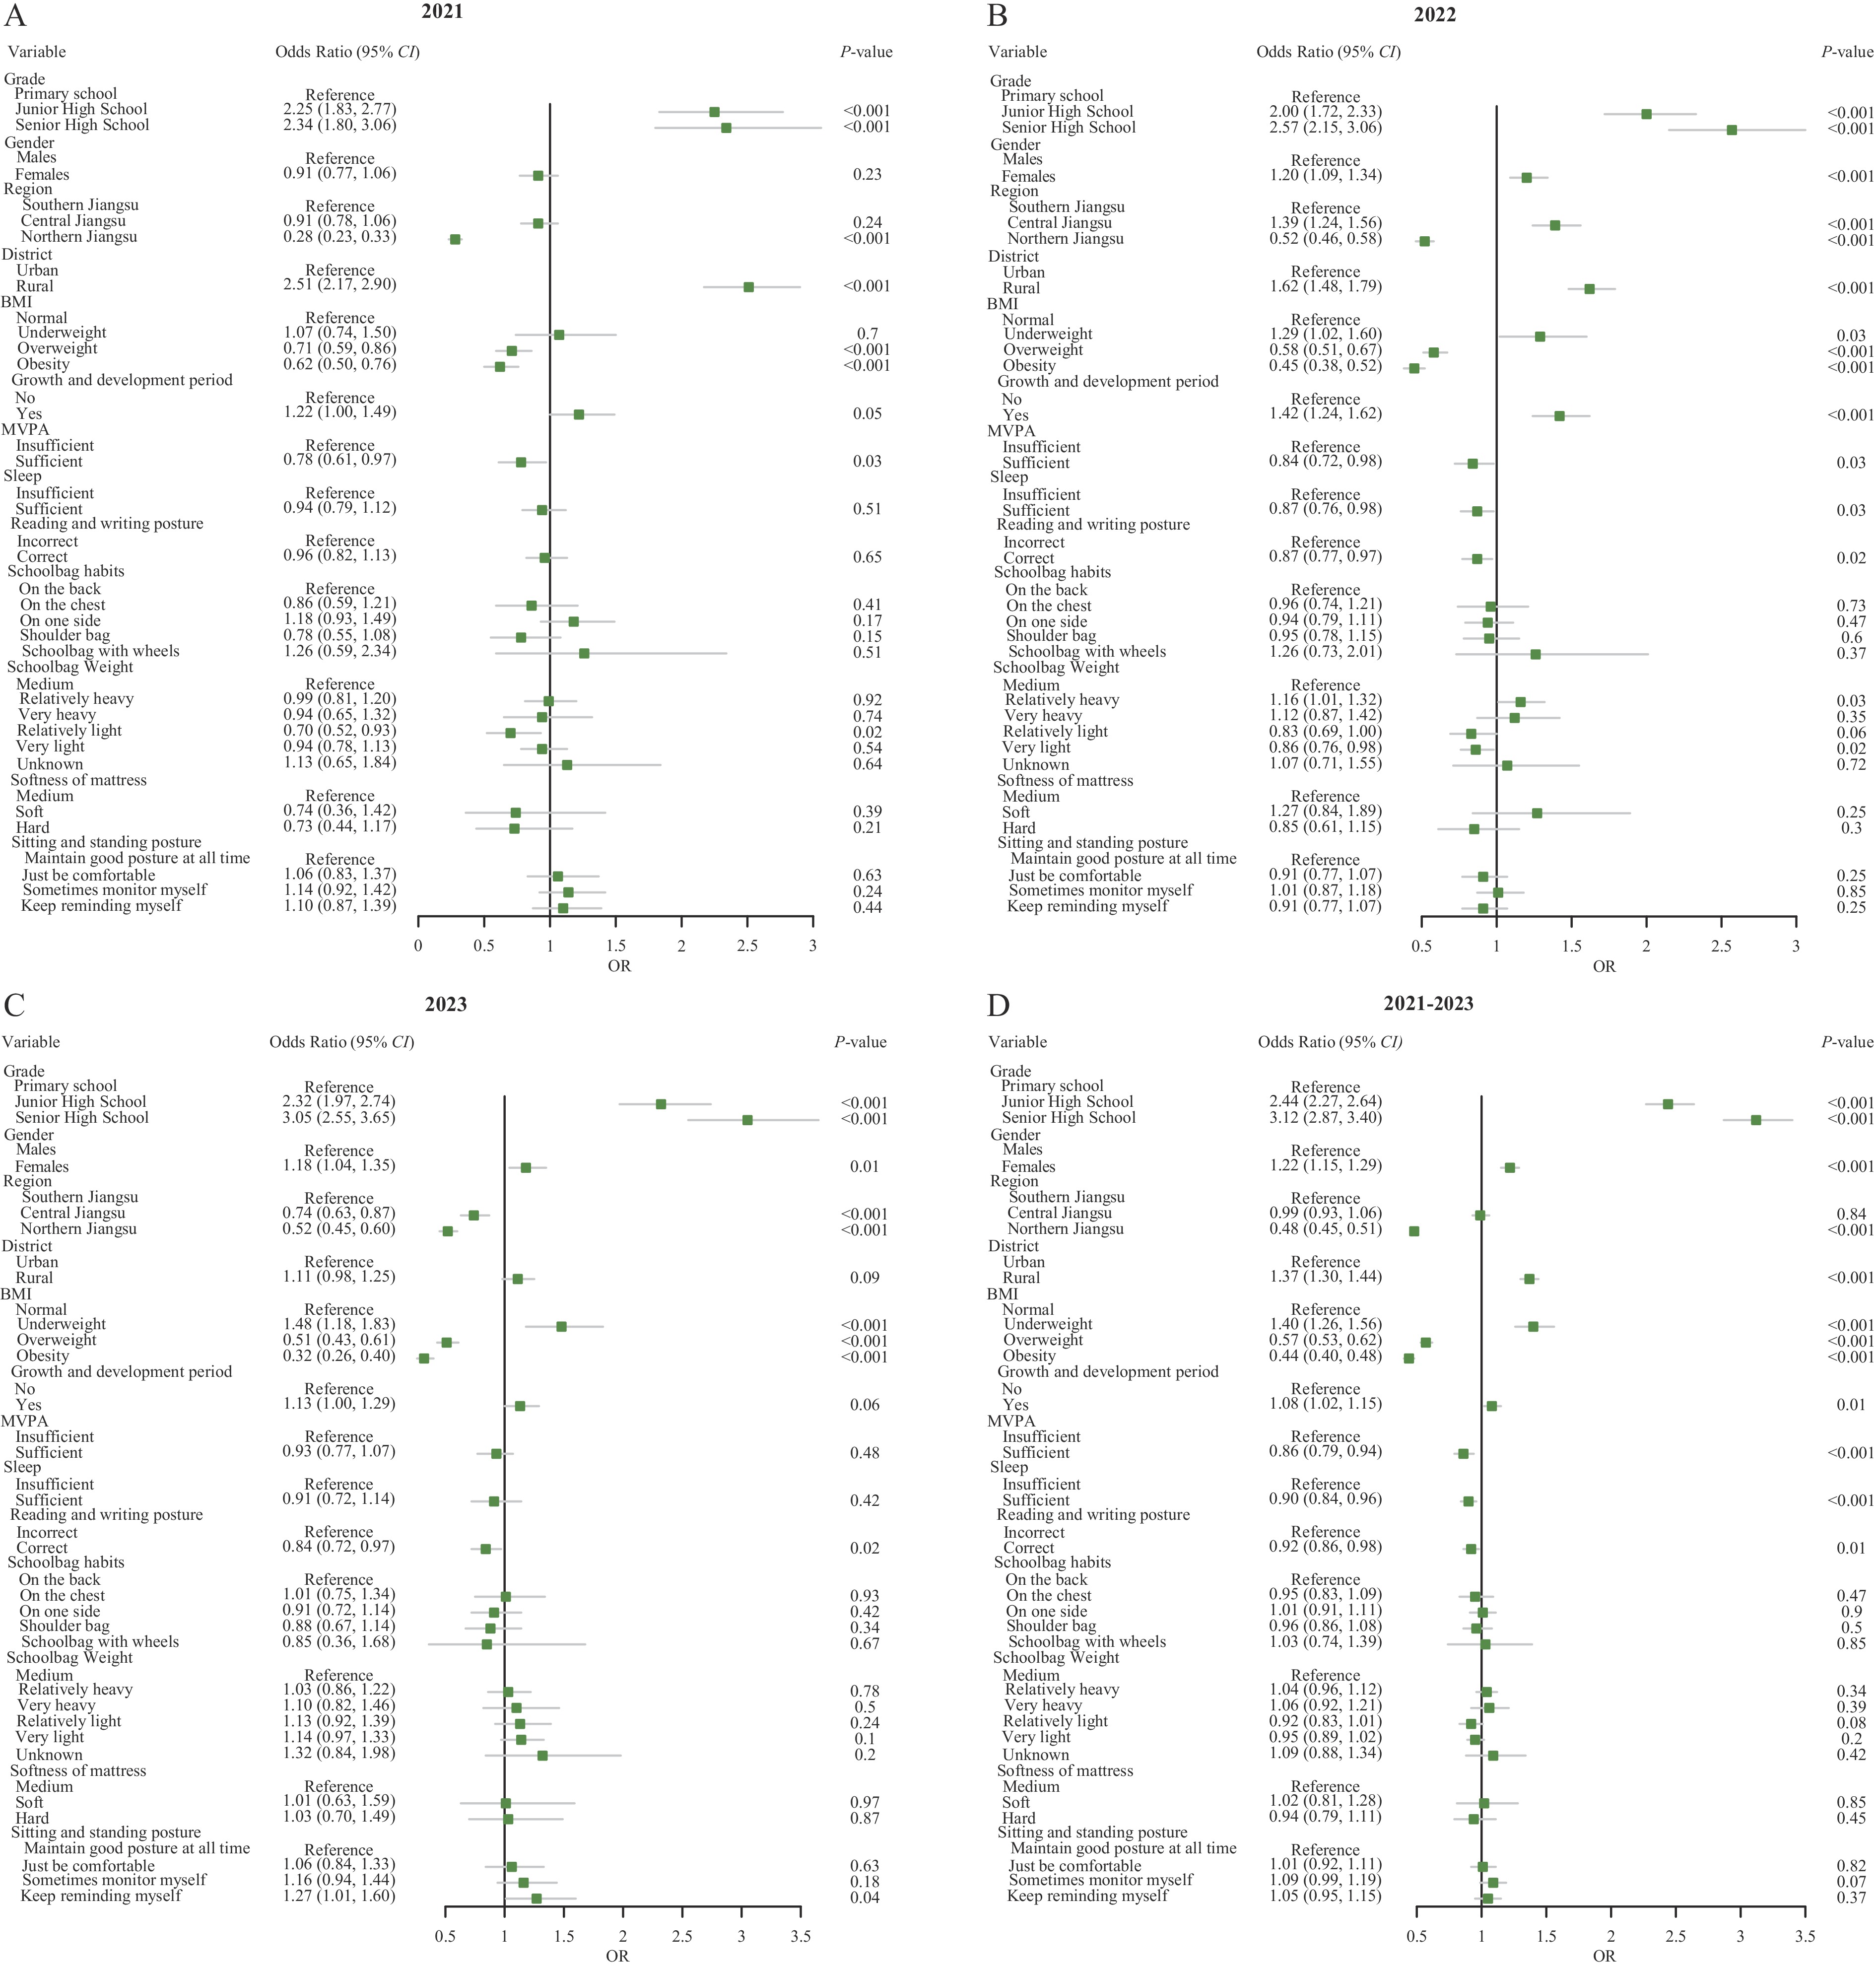 Figure 2.
Factors associated with abnormal spinal curvature in children and adolescents in Jiangsu Province. (A) Period: 2021; (B) Period: 2022; (C) Period: 2023; (D) Period: 2021–2023.
Abbreviation: CI=confidence interval; BMI=body mass index; MVPA=Moderate to vigorous physical activity. -
The 3-year detection rate of spinal curvature abnormalities among children and adolescents aged 6–17 years in Jiangsu Province (2.1%) was lower than rates reported in Sichuan Province (3.4%) (4) and Inner Mongolia Autonomous Region (3.6%) (5). This regional variation may be attributed to differences in economic development levels and study sample sizes.
This study’s observation of elevated detection rates of abnormal spinal curvature in higher academic grades aligns with previous findings that scoliosis prevalence in China increases with grade level (6). Adolescence represents a critical period for skeletal muscle development, during which persistent incorrect posture may lead to abnormal spinal curvature and scoliosis. Students in higher grades typically face increased academic workloads, potentially promoting sedentary behaviors that may contribute to spinal abnormalities.
Consistent with previous research (7), this study found higher detection rates of spinal curvature abnormalities in females compared to males. This gender disparity may be attributed to multiple factors, including sex-based variations in genetic heredity and the interaction between leptin production and the nervous system in females, which may trigger scoliosis development (8). Additionally, the differential progression of spinal curves between genders could be explained by imbalanced paraspinal muscle strength along the concave and convex sides of the spine, particularly if females engage in less moderate to vigorous physical activity than males.
Similar to previous findings demonstrating a positive correlation between low BMI and scoliosis occurrence (9), this study revealed that children and adolescents with low BMI exhibited a higher risk for abnormal spinal curvature. This association likely stems from biomechanical factors, where predisposed individuals lack sufficient paravertebral muscle force necessary to counteract the establishment and progression of scoliotic curves (10).
In alignment with existing literature (11–13), this study’s identification of multiple risk factors — including underweight status, improper reading and writing postures, insufficient sleep, and inadequate moderate to vigorous physical activity — underscores the necessity for targeted interventions. The well-documented relationship between sufficient physical activity and bone health in children and adolescents (14) suggests that future strategies should address the combined effects of multiple risk factors on spinal curvature abnormalities. Moreover, individuals with abnormal screening results require prompt medical evaluation and, where indicated, surgical intervention. Enhanced collaboration among families, schools, public health institutions, and hospitals is essential to protect the spinal health of children and adolescents.
Several limitations warrant consideration in this study. First, these findings from Jiangsu Province may not be generalizable to the broader Chinese population. Second, variations in detection rates between years may reflect differences in study population coverage due to the coronavirus disease 2019 (COVID-19) pandemic. Third, the cross-sectional design precludes causal inference. Finally, the reliance on self-reported questionnaires introduces potential recall bias, necessitating cautious interpretation of results. Future longitudinal studies are needed to evaluate the incidence rates of abnormal spinal curvature in this population.
In conclusion, abnormal spinal curvature emerged as a prevalent condition among children and adolescents aged 6–17 years in Jiangsu Province during 2021–2023, highlighting the urgent need for multisectoral investment in prevention and control. The Scoliosis Study Group’s recommendation for annual scoliosis examinations in children aged 10–14 years (15) reinforces the importance of maintaining surveillance programs to facilitate service planning and ensure timely referral to public health specialists and orthopedic surgeons.
-
Received ethics approval from the Institutional Ethics Committee for Clinical Research of Zhongda Hospital Affiliated with Southeast University (No. 2023ZDSYLL456-P01).
HTML
| Citation: |

|