
 Download:


-
Introduction: Physical inactivity among older adults represents a growing global concern. Understanding the characteristics and determinants of physical activity patterns (PAPs) is crucial for developing targeted physical activity (PA) promotion strategies for diverse subgroups.
Methods: This study analyzed data from 39,957 adults aged 60–79 years recruited from 31 Provincial-level administrative divisions (PLADs) through the 2020 Chinese National Survey on Adults’ Fitness. Participants completed comprehensive questionnaires and underwent physical fitness assessments. The self-administered questionnaire captured demographic characteristics, living environment conditions, life satisfaction, and stress levels. PA was evaluated under normal conditions using a domain-specific questionnaire that measured weekly activity across leisure, occupational, transport, and home domains, along with sedentary behavior. Physical fitness measurements encompassed anthropometric parameters (height, weight, body fat percentage), cardiorespiratory fitness (lung capacity, 2-minute step test), muscular strength (grip strength), flexibility (sit and reach test), functional capacity (30-second chair stand test), balance (one-leg standing with eyes-closed test), and neuromuscular function (reaction time test). K-means clustering analysis is used for identifying PAPs.
Results: K-means clustering analysis identified three distinct PAPs among Chinese older adults: low activity (LA) cluster (n=21,291, 53.3%), active leisure (AL) cluster (n=12,543, 31.4%), and active home (AH) cluster (n=6,123, 15.3%). The AL cluster demonstrated superior psychological status, physical fitness, and built environment conditions compared to both AH and LA clusters, while the AH cluster exhibited better physical fitness and built environment characteristics than the LA cluster.
Conclusions: These findings reveal distinct PA profiles across various life domains among older adults. The observed inter-cluster differences suggest that targeted intervention strategies and policies may benefit different elderly subgroups, particularly through enhanced sociopsychological and built environment support, coupled with precise guidance for promoting physical health.
-
Maintaining good physical activity (PA) behavior among older adults ensures their quality of life and confers long-term health benefits. PA occurs in at least four life domains: leisure, job, transport, and home. Research on PA among older adults primarily focuses on moderate-to-vigorous physical activity (MVPA) duration in different life domains or the proportion of individuals with insufficient PA and those meeting recommended PA guidelines, as well as their relationships with diseases (1). However, research on physical activity patterns (PAPs) among older adults remains limited despite the potential for identifying PAP across multiple life domains to inform the design of interventions and policies (2). Our data originate from the 2020 Chinese National Survey on Adults’ Fitness, the largest nationally representative survey of civilians in China. Cluster analysis was conducted with older adults aged 60–79 years to identify different PAPs based on self-reported MVPA across four life domains: leisure, job, transport, and home. Three PAP clusters were identified: low activity (LA) cluster (LA, n=21,291, 53.3%), active leisure (AL) cluster (AL, n=12,543, 31.4%), and active home (AH) cluster (AH, n=6,123, 15.3%). The AH cluster was more likely to comprise younger males, while the AL cluster was more likely to comprise individuals with higher education and professional occupations who were living with a partner. Psychological status, physical fitness, and the built environment were significantly better in the AL cluster than in the AH and LA clusters. Improvements in the physical fitness and built environment were greater in the AH cluster than in the LA cluster. Tailored interventions and policies targeting psychosocial factors, the built environment, and physical fitness for different subgroups should be implemented to increase PA levels among older adults.
This study employed a complex, stratified, multistage probability cluster sampling design approved by the National Bureau of Statistics in China, covering 31 provincial-level administrative divisions (PLADs) and achieving national representativeness, as previously described (3). In 2020, 39,957 participants aged 60–79 years completed comprehensive questionnaires and physical fitness assessments. A self-administered questionnaire collected data on demographic characteristics (sex, age, region, education, occupation, marital status), living environment, life satisfaction, and stress levels. PA was assessed using a self-administered questionnaire that measured weekly activity across leisure, job, transport, and home domains, along with sedentary time, under normal conditions. Physical fitness measurements included height, weight, body fat percentage, lung capacity, 2-minute step test count, 30-second chair stand test count, one-legged stance time with eyes closed, and reaction time. The study protocol received approval from the General Administration of Sport of China, with all participants providing written informed consent.
PAPs were identified using the K-means clustering algorithm, with cluster variables standardized to Z-scores to ensure equal contribution to the analysis. Statistical significance was established at a two-sided P value of less than 0.05. For continuous variables, results were expressed as mean and standard deviation (SD), while categorical variables were reported as proportions with 95% CIs. All analyses were conducted using SAS JMP 17.2 (SAS Institute Inc, Cary, NC, USA).
Among the 39,957 study participants, 19,783 (49.5%) were men and 20,174 (50.5%) were women. In 2020, younger male participants demonstrated significantly higher total minutes spent in transport, home, job, and leisure activities (P<0.05) (Table 1).
Items Transport (min)
M (SD)Home (min)
M (SD)Job (min)
M (SD)Leisure (min)
M (SD)Sedentary (min)
M (SD)Overall (n=39,957) 345.6 (298.3) 450.8 (437.6) 131.4 (495.7) 42 (56.9) 692.7 (593.3) Age group,years 60–69 (n=20,515) 364.9 (312.7)* 490.9 (461.1)* 190.7 (606.0)* 46.8 (60.5)* 701.9 (595.1)* 70–79 (n=19,442) 325.3 (280.9) 408.5 (407.2) 68.9 (331.4) 37.0 (52.4) 683.1 (591.4) Sex Male (n=19,783) 351.0 (305.4)† 367.3 (392.0)† 163.9 (564.9)† 42.0 (58.1) 718.9 (606.7)† Female (n=20,174) 340.3 (291.1) 532.7 (463.8) 99.6 (414.3) 42.0 (55.8) 667.1 (578.9) Urban-rural Urban (n=19,985) 375.3 (314.9)§ 482.0 (450.2)§ 81.4 (390.6)§ 56.7 (63.3)§ 770.2 (631.6)§ Rural (n=19,972) 315.9 (277.5) 419.6 (422.4) 181.4 (577.8) 27.3 (45.2) 615.3 (541.5) Abbreviation: M=mean; SD=standard deviation.
* P<0.05 vs. 70–79 age group;
† P<0.05 vs. female group;
§ P<0.05 vs. rural group.Table 1. Total weekly minutes for transport, home, job, leisure, and sedentary activities among Chinese older adults aged 60–79 years in 2020.
K-means cluster analysis revealed three distinct clusters (Silhouette Score=0.6) characterized by their weekly MVPA patterns across four life domains. These clusters were designated as LA, AL, and AH. Figure 1 illustrates the Z-score profiles of each cluster across life domains. The LA cluster exhibited activity levels ranging from −0.1 to −0.4 SDs below the sample mean across all domains, with participants averaging 38.3 minutes of daily MVPA. While classified as “moderate” according to the International Physical Activity Questionnaire Scoring Protocol (IPAQ-SP), this cluster demonstrated the lowest relative activity levels. The AL cluster showed leisure PA levels 0.8 SDs above the sample mean, with near-average levels in transport, home, and occupational domains. AL participants averaged 51.7 minutes of daily MVPA, approaching the IPAQ-SP “high” activity threshold. The AH cluster demonstrated home PA levels 1.8 SDs above the sample mean, with average levels in other domains. AH participants averaged 44.3 minutes of daily MVPA, exceeding the IPAQ-SP “moderate” threshold primarily through household activities.
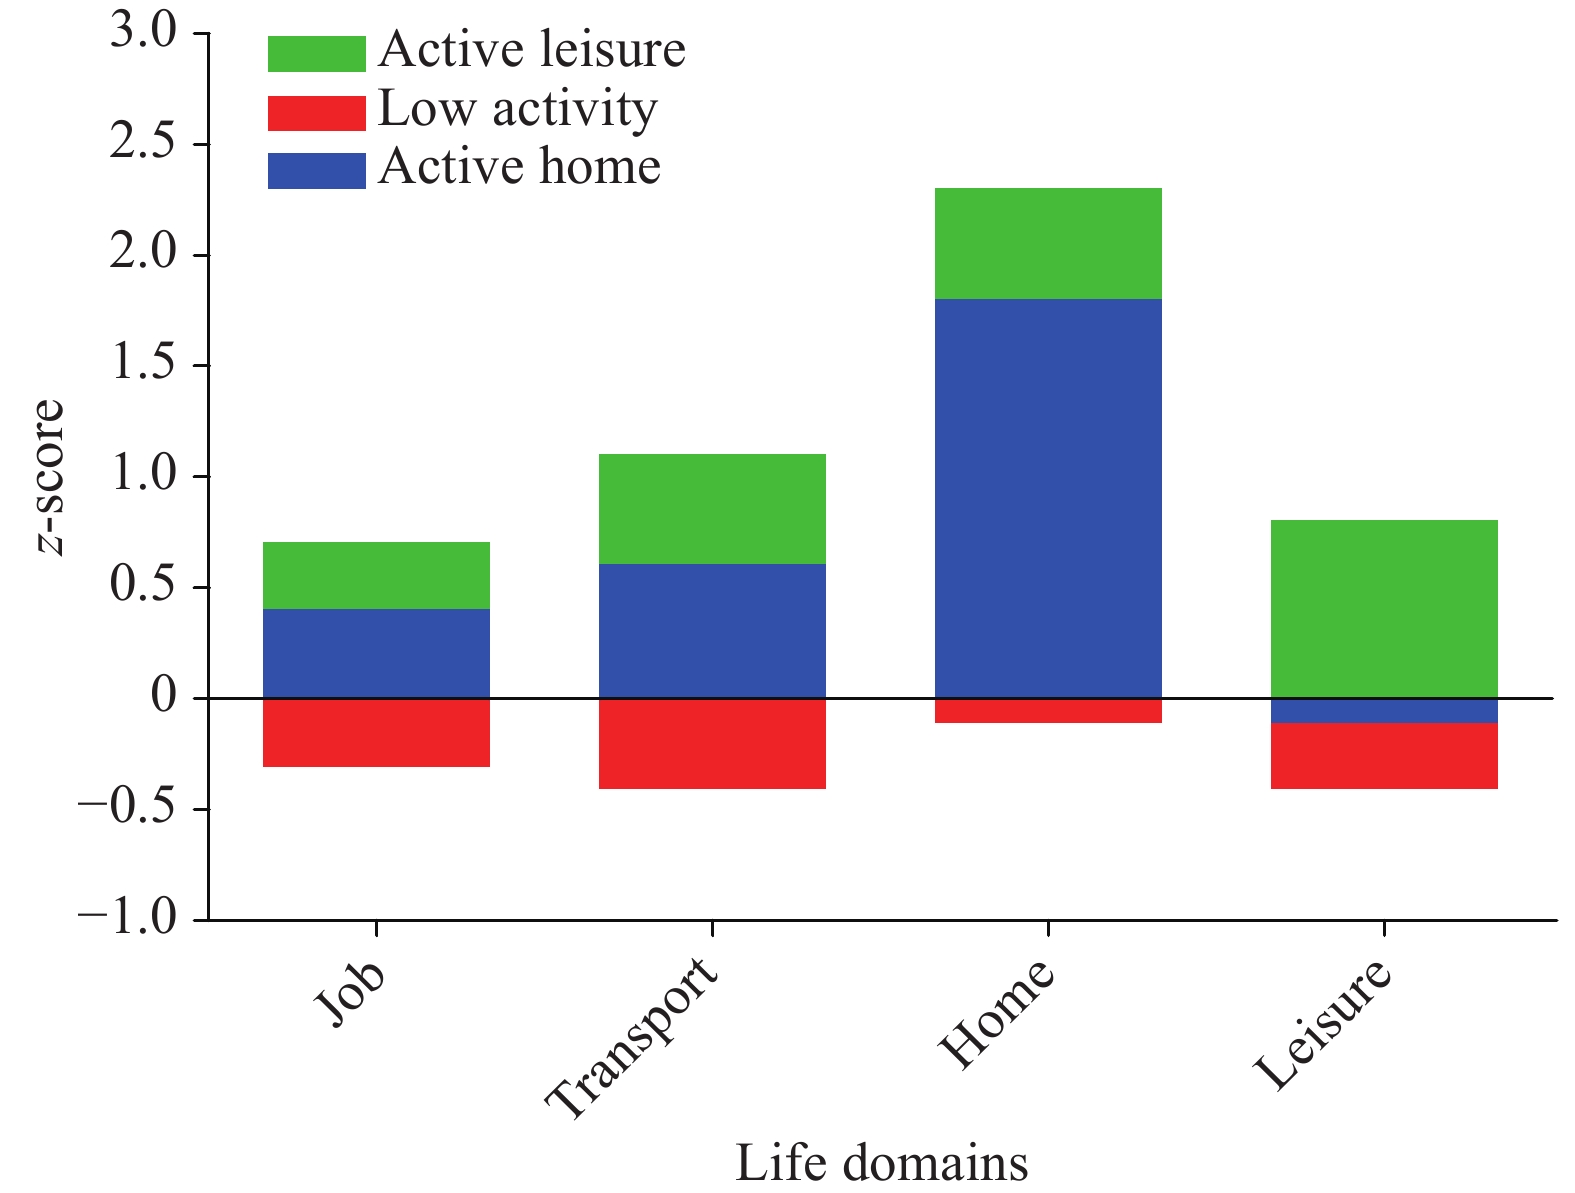 Figure 1.
The profiles of LA, AL, and AH clusters expressed in Z-scores across life domains for each cluster sample.
Abbreviation: LA=low activity; AL=active leisure; AH=active home.Demographic analysis revealed distinct characteristics among clusters. The AH cluster predominantly comprised younger male participants with lower educational attainment and fewer professional occupations compared to AL and LA clusters. However, AH participants demonstrated superior physical fitness metrics compared to the LA cluster, including lower body fat percentages and enhanced cardiopulmonary endurance, maximum lung ventilation, upper limb strength, flexibility, and balance. The AL cluster was characterized by higher educational attainment, professional occupations, partnership status, and superior environmental factors, including residence within 15-minute exercise circles and economically developed cities. AL participants also reported higher life satisfaction and lower perceived stress and demonstrated superior physical fitness across all measured parameters compared to both AH and LA clusters (Table 2).
Characteristics AL (n=6,123) LA (n=21,291) AH (n=12,543) Demographic characteristics Age (year)* 67.1 (5) 69.3 (7)** 69.1 (5)§¶ Male proportion (%) † 65.9 (53.5, 71.4) 52.3 (49.1, 55.3)** 43.2 (39.2, 45.3)§¶ Urban proportion (%)† 42.9 (39.1, 44.3) 56.7 (55.4, 58.3)** 54.1 (52.9, 57.9)§¶ Highest education category (%)† 3.3 (2.9, 3.8) 7.4 (5.8, 9.1)** 15.3 (13.2, 18.1)§¶ Having a good profession (%)† 18.6 (14.3, 22.2) 23.3 (20.6, 25.5)** 44.6 (42.9, 46.3)§¶ Married proportion (%)† 98.2 (97.2, 99.4) 98.3 (97.5, 99.8) 98.0 (97.1, 99.6) Living with spouse or partner (%)† 59.3 (54.7, 62.4) 57.1 (56.3, 58.4)** 62.4 (58.8, 65.4)§¶ Psychosocial Having a good Life satisfaction self-reported (%)† 77.2 (75.8, 78.5) 91.1 (89.8, 93.0)** 93.4 (90.1, 95.4)§¶ Having a good Stress self-reported (%)† 69.2 (64.2, 75.3) 73.9 (68.9, 76.3)** 83.0 (79.9, 86.4)§¶ Built environment Living with 15 minutes exercise circle (%)† 78.5 (77.2, 79.6) 75.2 (74.0, 76.6)** 87.9 (86.6, 88.8)§¶ Live in high economic development city (%)† 59.4 (58.3, 60.6) 54.3 (53.8, 55.0)** 59.8 (58.4, 61.2)¶ PA level MPA (min/week)* 300.8 (38.7) 263.2 (26.1)** 338.2 (48.3)§¶ VPA (min/week)* 19.1 (8.2) 14.6 (7.7)** 33.6 (9.7)§¶ MVPA (min/week)* 310.1 (46.4) 268.5 (25.5)** 362.5 (46.5)§¶ Sedentary (min/week)* 587.8 (444.6) 680.7 (478.8)** 720.3 (567.4)§¶ Physical fitness Body mass index (kg/m2)* 24.7 (3.21) 24.8 (3.44) 24.5 (3.15)¶ Body fat percentage (%)* 28.8 (7.1) 27.7 (7.7)** 25.9 (7.9)§¶ Lung capacity (mmHg)* 1,976 (744) 1,917 (655)** 2,124 (687)§¶ 2-minute step test (number)* 94 (44) 86 (31)** 101 (44)§¶ Grip (kg)* 29.7 (8.7) 27.8 (8.7)** 30.6 (9.0)§ Sit and reach test (cm)* 4.6 (9.4) 3.1 (8.7) 4.8 (9.1)§¶ 30-second chair stand test (number)* 11 (4) 11 (4) 12 (3)§¶ Standing on one foot with eyes closed (minute)* 10.5 (8.9) 9.5 (7.7)** 10.1 (8.5)¶ Reaction (minutes)* 0.80 (0.25) 0.79 (0.22)** 0.76 (0.20)§¶ Note: Highest education category, proportion of college graduates and above; Good profession, proportion of first four categories (1=staff of government agencies and public institutions, 9=no occupation); Good life satisfaction self-reported, proportion of last two categories (1=very dissatisfied, 5=very satisfied); good stress self-reported, proportion of last two categories (1=always, 5=never); high economic development city, proportion of first category (1=economically developed city, 3=economically underdeveloped city).
Abbreviation: LA=low activity; AL=active leisure; AH=active home; MPA=moderate-intensity physical activity; VPA=vigorous-intensity physical activity; MVPA=moderate-to-vigorous physical activity; PA=physical activity.
* Geometric means and 95% confidence intervals (in parentheses) reported;
† Means and standard deviations (in parentheses) reported;
§ P<0.05 vs. AH group;
¶ P<0.05 vs. LA group;
** P<0.05 AH group vs. LA group.Table 2. Characteristics of LA, AL, and AH clusters among Chinese older adults aged 60–79 years in 2020.
-
Analysis of recent nationally representative data revealed three distinct PAPs across life domains among Chinese adults aged 60–79 years in 2020: an AL cluster, an AH cluster, and a LA cluster characterized by below-average activity levels. The AL cluster demonstrated significantly superior physical fitness, psychosocial status, and built environment conditions compared to both the AH and LA clusters. Additionally, the AH cluster showed greater PA engagement and physical fitness improvements relative to the LA cluster.
The PA clustering patterns identified in this study diverged from previous research findings. A study of 1,690 American adults (2) identified three distinct patterns through cluster analysis: active leisure, low activity, and active job (AJ) clusters. Our analysis revealed an AH cluster rather than an AJ cluster, likely reflecting cultural differences in activity patterns among older Chinese adults, who tend to engage more in leisure and home-based activities. Moreover, our study population consisted entirely of retirees, naturally limiting transport and occupational PA. Another study (4) employed a different approach, categorizing patterns based on frequency and duration combinations, yielding five distinct patterns: low frequency & short duration, low frequency & long duration, daily frequency & short duration, daily frequency & long duration, and high frequency & average duration. This methodology enabled the examination of various activity mode effects. These findings demonstrate the versatility of data-driven approaches in identifying PAPs aligned with specific research objectives. While some research has dichotomized patterns into weekend warriors and regular exercise participants (5) based on exercise habits, our study provides a comprehensive analysis of patterns across multiple life domains. These insights can inform the development of targeted public health policies and health management strategies for distinct pattern subgroups.
The three PA pattern subgroups demonstrated significant differences in activity levels. Weekly MVPA durations were 338.2±48.3 minutes for the active leisure cluster, 300.8±38.7 minutes for the active home cluster, and 263.2±26.1 minutes for the low activity cluster (Table 2). All clusters exhibited minimal VPA and prolonged sedentary behavior. Although self-reported weekly MVPA in each cluster exceeded WHO guidelines — potentially due to self-reporting bias — daily VPA averaged only 3–6 minutes. Strengthening social and built environment supports for vigorous activity is crucial. Targeted interventions should expand both the range of vigorous activities (e.g., running, aerobic exercise) and available settings (e.g., fitness clubs, group classes) to increase participation opportunities (6). Notably, both active leisure and active home clusters maintained high sedentary time, indicating that increased PA did not necessarily reduce sedentary behavior — a key consideration for future intervention policies (7).
The three clusters exhibited distinct characteristics in demographics, psychological factors, built environment access, and physical fitness metrics. The active leisure cluster showed higher educational attainment and occupational status, with more participants living with partners, suggesting better access to lifestyle education and natural exercise partners (8). These social factors likely contributed to their active leisure classification (9). Furthermore, compared to the low activity cluster, both active clusters demonstrated superior built environment access, better social and psychological states, lower body fat percentages, and enhanced physical fitness measures. These findings align with ecological models suggesting that supportive social and architectural environments can increase PA through environmental engineering (10). Experimental evidence supports this conclusion, indicating that communities with comprehensive PA support facilities, positive aesthetics, and competitive opportunities can effectively benefit adults with low activity levels (11).
A key strength of this study lies in its utilization of contemporary data from all 31 PLADs in China, which enhances the representativeness and robustness of the PA pattern cluster analysis. The interpretation of the results from this study should take into account several limitations. The first limitation is the reliance on self-reported questionnaire data for PA classification rather than objective measurements, future investigations should incorporate objective PA measurements (12) and comprehensive health status assessment. Second, PA results were based on cross-sectional survey research and did not consider possible fluctuations over time. Third, this study primarily included Chinese older adults, which could restrict the applicability of these findings to other racial demographics and representative population samples.
In conclusion, this study provides a comprehensive evaluation of PAPs and their associated group characteristics among China’s elderly population at the national level as of 2020. Future research directions should focus on investigating how different types and combinations of built environment features effectively support PA enhancement.
HTML
| Citation: |

|