
 Download:


-
Brucellosis is a globally significant zoonotic disease that causes substantial economic losses and poses serious occupational health risks (1-2). Since 1995, brucellosis has reemerged in China, reaching a historic peak in 2014, with the affected areas expanding from northern to southern regions (3). Notably, in 2021, 69,767 cases were reported across 2,083 counties in China, representing a 47.7% increase from 2020 (47,425) (4). However, epidemiological evolution characteristics of human brucellosis from 2019 to 2023 remain unclear. Therefore, this study aims to analyze disease evolution patterns and to identify high-risk areas for human brucellosis in China from 2019 to 2023.
The case and incidence rates were obtained from the National Notifiable Disease Reporting System (NNDRS) for the period January 1, 2019 to December 31, 2023. The average annual growth rate was calculated according to previously reported methods (5). Average annual incidence growth rates (%) were calculated using power functions in Microsoft Excel 2021 (Microsoft Corporation, Redmond, Washington, United States).
The Qinling-Huaihe line served as the geographical boundary between northern and southern China. The northern region comprised 16 provincial-level administrative divisions (PLADs) [Heilongjiang, Jilin, Liaoning, Beijing, Tianjin, Inner Mongolia, Shaanxi, Hebei, Henan, Ningxia, Shanxi, Shandong, Gansu, Qinghai, Xinjiang (Xinjiang Production and Construction Corps, XPCC) and Xizang], while the southern region included 15 PLADs (Jiangsu, Shanghai, Zhejiang, Anhui, Hunan, Hubei, Sichuan, Chongqing, Guizhou, Yunnan, Guangxi, Guangdong, Hainan, Fujian and Jiangxi). Hong Kong Special Administrative Region (SAR); Macau SAR; and Taiwan, China were excluded due to data unavailability.
Joinpoint regression analyses were performed using Joinpoint Regression Program version 5.2.0 (https://surveillance.cancer.gov/joinpoint/) (National Cancer Institute, Bethesda, Maryland, USA) based on Poisson regression to estimate joinpoint positions and regression coefficients (6). Annual percentage changes (APCs) were calculated to quantify the year-over-year rate changes between successive joinpoints as percentages.
A retrospective space-time scan analysis using the discrete Poisson model was conducted using SaTScan v10.1.3 (National Cancer Institute, Bethesda, Maryland, USA) to identify spatiotemporal clusters of human brucellosis. Statistical significance was assessed through 999 Monte Carlo simulations. The log likelihood ratio (LLR) test statistic was constructed by comparing observed and expected case counts inside and outside the scanning window. Clusters were defined by scanning windows with statistically significant LLR values (P<0.05).
From 2019 to 2023, human brucellosis cases and incidence rates demonstrated a fluctuating upward trend across 31 PLADs in China, with 304,668 total reported cases and an average annual incidence of 4.33/10,000 population (Figure 1).
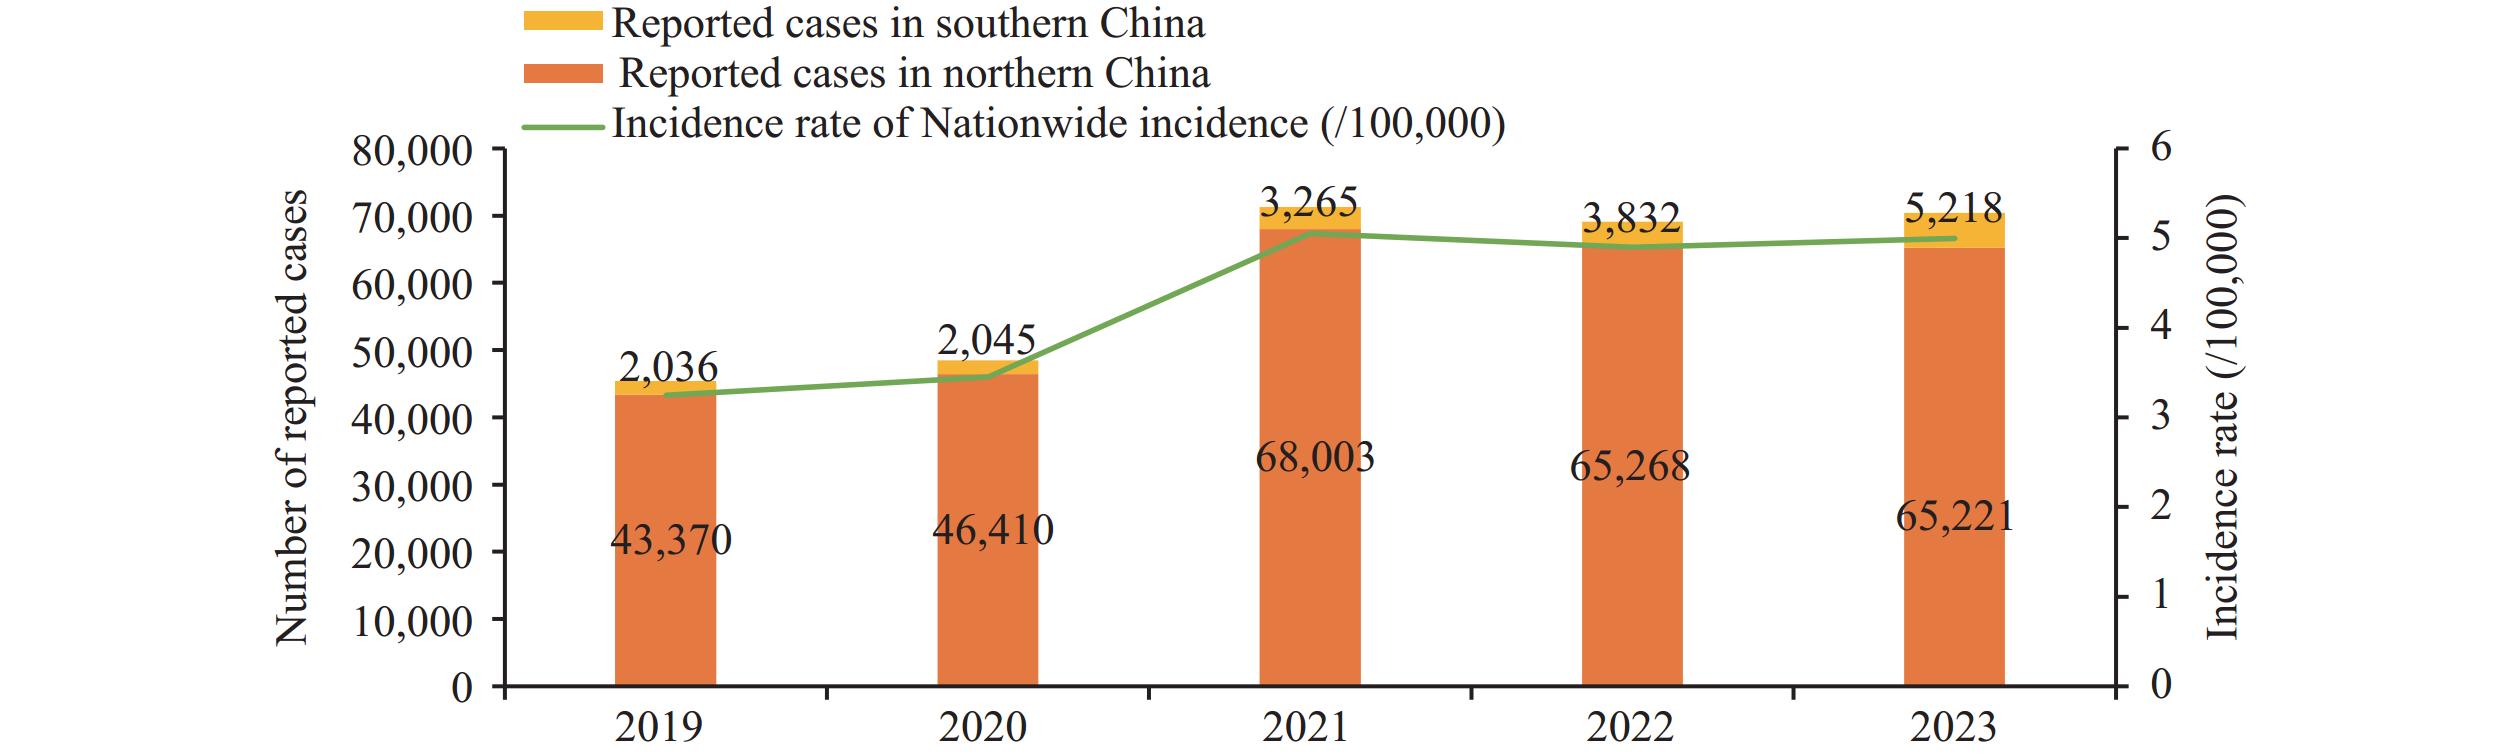 Figure 1.
Evolution trend of human brucellosis in northern and southern China, from 2019 to 2023.
The annual reported cases increased from 45,046 (3.25/100,000) in 2019 to 48,455 (3.45/100,000) in 2020, reaching a peak of 71,628 (5.06/100,000) in 2021. Subsequently, cases slightly decreased to 69,100 (4.89/10,000) in 2022 before rising again to 70,439 (4.99/10,000) in 2023 (Figure 1). Further, 87.78% (267,446/304,668) of cases occurred in northern PLADs, while 12.22% (37,222/304,668) were reported from southern PLADs. Notably, southern PLADs experienced a substantial increase in reported cases, from 4,310 in 2019 to 10,363 in 2023 (Figure 1 and Table 1).
Areas PLADs Number of reported cases, 2019-2023 Total
cases2019 2020 2021 2022 2023 Northern Inner Mongolia 14,148 16,406 21,910 19,088 16,409 87,961 Xinjiang 4,135 3,079 4,828 6,469 9,334 27,845 Shanxi 3,465 3,498 4,962 4,876 5,131 21,932 Ningxia 2,242 2,988 5,049 6,295 4,505 21,079 Henan 2,274 3,121 5,032 5,254 5,145 20,826 Gansu 1,787 3,003 4,601 5,229 5,569 20,189 Hebei 3,407 3,158 4,777 3,970 4,196 19,508 Liaoning 2,298 3,000 5,483 3,916 3,162 17,859 Heilongjiang 4,326 2,956 4,119 2,849 3,387 17,637 Shandong 2,534 2,427 3,370 3,218 3,311 14,860 Shaanxi 1,138 1,116 1,419 1,705 1,543 6,921 Jilin 1,191 1,151 1,311 847 1,093 5,593 Qinghai 148 259 772 1,159 2,074 4,412 Tianjin 136 136 238 258 209 977 Beijing 86 54 83 115 131 469 Xizang 55 58 49 20 22 204 Southern Yunnan 321 383 701 1,039 1,519 3,963 Guangdong 456 361 479 490 612 2,398 Anhui 142 229 353 347 414 1,485 Hunan 212 167 239 248 349 1,215 Jiangsu 142 165 284 284 299 1,174 Sichuan 114 130 206 267 417 1,134 Guangxi 153 125 229 248 367 1,122 Fujian 151 111 195 207 238 902 Zhejiang 108 127 181 209 195 820 Hubei 80 73 107 175 254 689 Guizhou 33 54 92 140 207 526 Jiangxi 58 53 103 80 177 471 Chongqing 49 54 72 49 94 318 Hainan 15 9 21 41 71 157 Shanghai 2 4 3 8 5 22 Nationwide 45,406 48,455 71,268 69,100 70,439 304,668 Abbreviation: PLAD=provincial-level administrative division. Table 1. Number of reported cases in 31 PLADs in China from 2019 to 2023.
From 2019 to 2023, Inner Mongolia accounted for the largest proportion (87,961 cases; 28.87% of all reports) with an average annual incidence of 71.88/100,000 (Table 1). Shanghai reported the lowest number of cases (22), followed by Hainan (257), with average annual incidence rates of 0.018/100,000 and 0.31/100,000, respectively. With the exception of Yunnan, all southern PLADs reported incidence rates below 1.0/100,000 (Table 1).
The average annual growth rate of incidence in China from 2019 to 2023 was 8.97% (Table 2). Notably, 13 southern PLADs and 5 northern PLADs reported average annual growth rates exceeding 10% (Table 2). Qinghai showed a marked upward trend, with annual incidence increasing from 2.45/100,000 in 2019 to 34.86/100,000 in 2023. Although most southern PLADs maintained incidence rates below 1.0/100,000, they showed consistent increases over time (Table 2).
Areas PLADs 2019−2023, incidence (/100,000) Average annual
incidence (/100,000)Average annual
growth rate (%)2019 2020 2021 2022 2023 Northern Qinghai 2.45 4.26 13.03 19.51 34.86 14.82 70.02 Gansu 6.78 11.34 18.39 21.00 22.34 15.97 26.95 Henan 2.37 3.24 5.06 5.32 5.21 4.24 17.10 Xinjiang 16.63 12.20 18.68 24.99 36.08 21.71 16.76 Ningxia 32.59 43.01 70.10 86.83 61.85 58.88 13.67 Tianjin 0.87 0.87 1.72 1.88 1.53 1.37 11.96 Shanxi 9.32 9.38 14.21 14.01 14.74 12.33 9.61 Beijing 0.40 0.25 0.38 0.53 0.60 0.43 8.48 Liaoning 5.27 6.89 12.87 9.26 7.53 8.37 7.40 Shaanxi 2.94 2.88 3.59 4.31 3.90 3.53 5.78 Shandong 2.52 2.41 3.32 3.16 3.26 2.93 5.25 Hebei 4.51 4.16 6.40 5.33 5.66 5.21 4.63 Inner Mongolia 55.83 64.60 91.11 79.53 68.34 71.88 4.12 Jilin 4.40 4.28 5.45 3.57 4.66 4.47 1.12 Heilongjiang 11.47 7.88 12.93 9.12 10.93 10.46 −0.95 Xizang 1.60 1.65 1.34 0.55 0.60 1.15 −17.69 Southern Guizhou 0.09 0.15 0.24 0.36 0.54 0.28 42.39 Yunnan 0.66 0.79 1.48 2.22 3.24 1.68 37.25 Hainan 0.16 0.10 0.21 0.40 0.69 0.31 33.93 Sichuan 0.14 0.16 0.25 0.32 0.50 0.27 29.51 Hubei 0.14 0.12 0.19 0.30 0.43 0.24 26.31 Jiangxi 0.12 0.11 0.23 0.18 0.39 0.21 25.65 Anhui 0.22 0.36 0.58 0.57 0.68 0.48 24.64 Shanghai 0.01 0.02 0.01 0.03 0.02 0.02 19.47 Guangxi 0.31 0.25 0.46 0.49 0.73 0.45 18.54 Jiangsu 0.18 0.20 0.34 0.33 0.35 0.28 14.76 Chongqing 0.16 0.17 0.22 0.15 0.29 0.20 13.11 Hunan 0.31 0.24 0.36 0.37 0.53 0.36 11.45 Zhejiang 0.19 0.22 0.28 0.32 0.30 0.26 9.51 Fujian 0.38 0.28 0.47 0.49 0.57 0.44 8.20 Guangdong 0.40 0.31 0.38 0.39 0.48 0.39 3.77 Nationwide 3.25 3.45 5.06 4.90 5.00 4.33 8.97 Abbreviation: PLAD=provincial-level administrative division. Table 2. Average annual growth rate (%) of incidence (/100,000) in 31 PLADs from 2019 to 2023.
Joinpoint regression analysis revealed APCs ranging from −0.70 to 97.97, with 29 PLADs demonstrating significant upward trends in incidence rates, except for Jilin and Xizang (Table 3). Notably, six PLADs — Qinghai, Guizhou, Yunnan, Sichuan, Jiangxi, and Guangxi (Table 3) — exhibited particularly significant increases, with five of these PLADs located in southern China.
Areas PLADs Period APC 95% CI P Northern Qinghai 2019–2023 97.97 69.82, 129.00 <0.001 Gansu 2019–2023 35.02 −0.79, 82.97 0.063 Xinjiang 2019–2023 25.44 −1.55, 58.41 0.070 Henan 2019–2023 23.05 1.99, 47.46 0.024 Ningxia 2019–2023 21.95 −20.49, 86.16 0.320 Tianjin 2019–2023 20.91 −14.88, 71.26 0.266 Beijing 2019–2023 16.81 −6.27, 44.65 0.188 Shanxi 2019–2023 14.09 1.60, 27.52 0.020 Liaoning 2019–2023 10.62 −19.40, 49.80 0.472 Shaanxi 2019–2023 10.14 −5.45, 27.97 0.206 Shandong 2019–2023 8.16 −0.29, 16.88 0.061 Hebei 2019–2023 7.26 −3.07, 18.19 0.180 Inner Mongolia 2019–2023 6.31 −9.43, 24.12 0.419 Heilongjiang 2019–2023 0.50 −24.41, 32.65 0.971 Jilin 2019–2023 −0.70 −14.26, 14.34 0.891 Xizang 2019–2023 −26.32 −45.07, −1.92 0.035 Southern Guizhou 2019–2023 55.67 48.68, 62.84 <0.001 Hainan 2019–2023 54.66 9.50, 115.38 0.008 Yunnan 2019–2023 52.19 41.92, 62.91 <0.001 Sichuan 2019–2023 39.18 23.83, 56.00 <0.001 Hubei 2019–2023 38.07 6.19, 78.88 0.011 Jiangxi 2019–2023 31.36 8.88, 57.77 <0.001 Anhui 2019–2023 30.46 9.96, 53.80 0.001 Shanghai 2019–2023 27.69 −3.12, 66.00 0.080 Guangxi 2019–2023 26.76 10.13, 45.20 <0.001 Jiangsu 2019–2023 20.53 6.08, 36.22 0.003 Hunan 2019–2023 16.45 −2.44, 38.56 0.103 Fujian 2019–2023 14.56 −0.73, 31.89 0.068 Zhejiang 2019–2023 13.82 −1.66, 31.38 0.088 Chongqing 2019–2023 11.71 −9.84, 37.80 0.334 Guangdong 2019–2023 5.96 −15.45, 32.30 0.499 Nationwide 2019–2023 12.86 1.33, 25.09 0.028 Abbreviation: PLAD=provincial-level administrative division; CI=confidence interval; APC=annual percent change. Table 3. Joinpoint regression analysis of human brucellosis in 31 PLADs from 2019 to 2023.
Retrospective space-time analysis scanning for clusters with high rates using the discrete Poisson model identified 14 distinct zones of human brucellosis clusters. The largest cluster occurred between January 1, 2022, and December 31, 2023, encompassing 419 counties (Figure 2 and Table 3). This primary cluster demonstrated a relative risk of 8.95 with a LLR of 79,182.30 (P<0.001) (Figure 2 and Table 4).
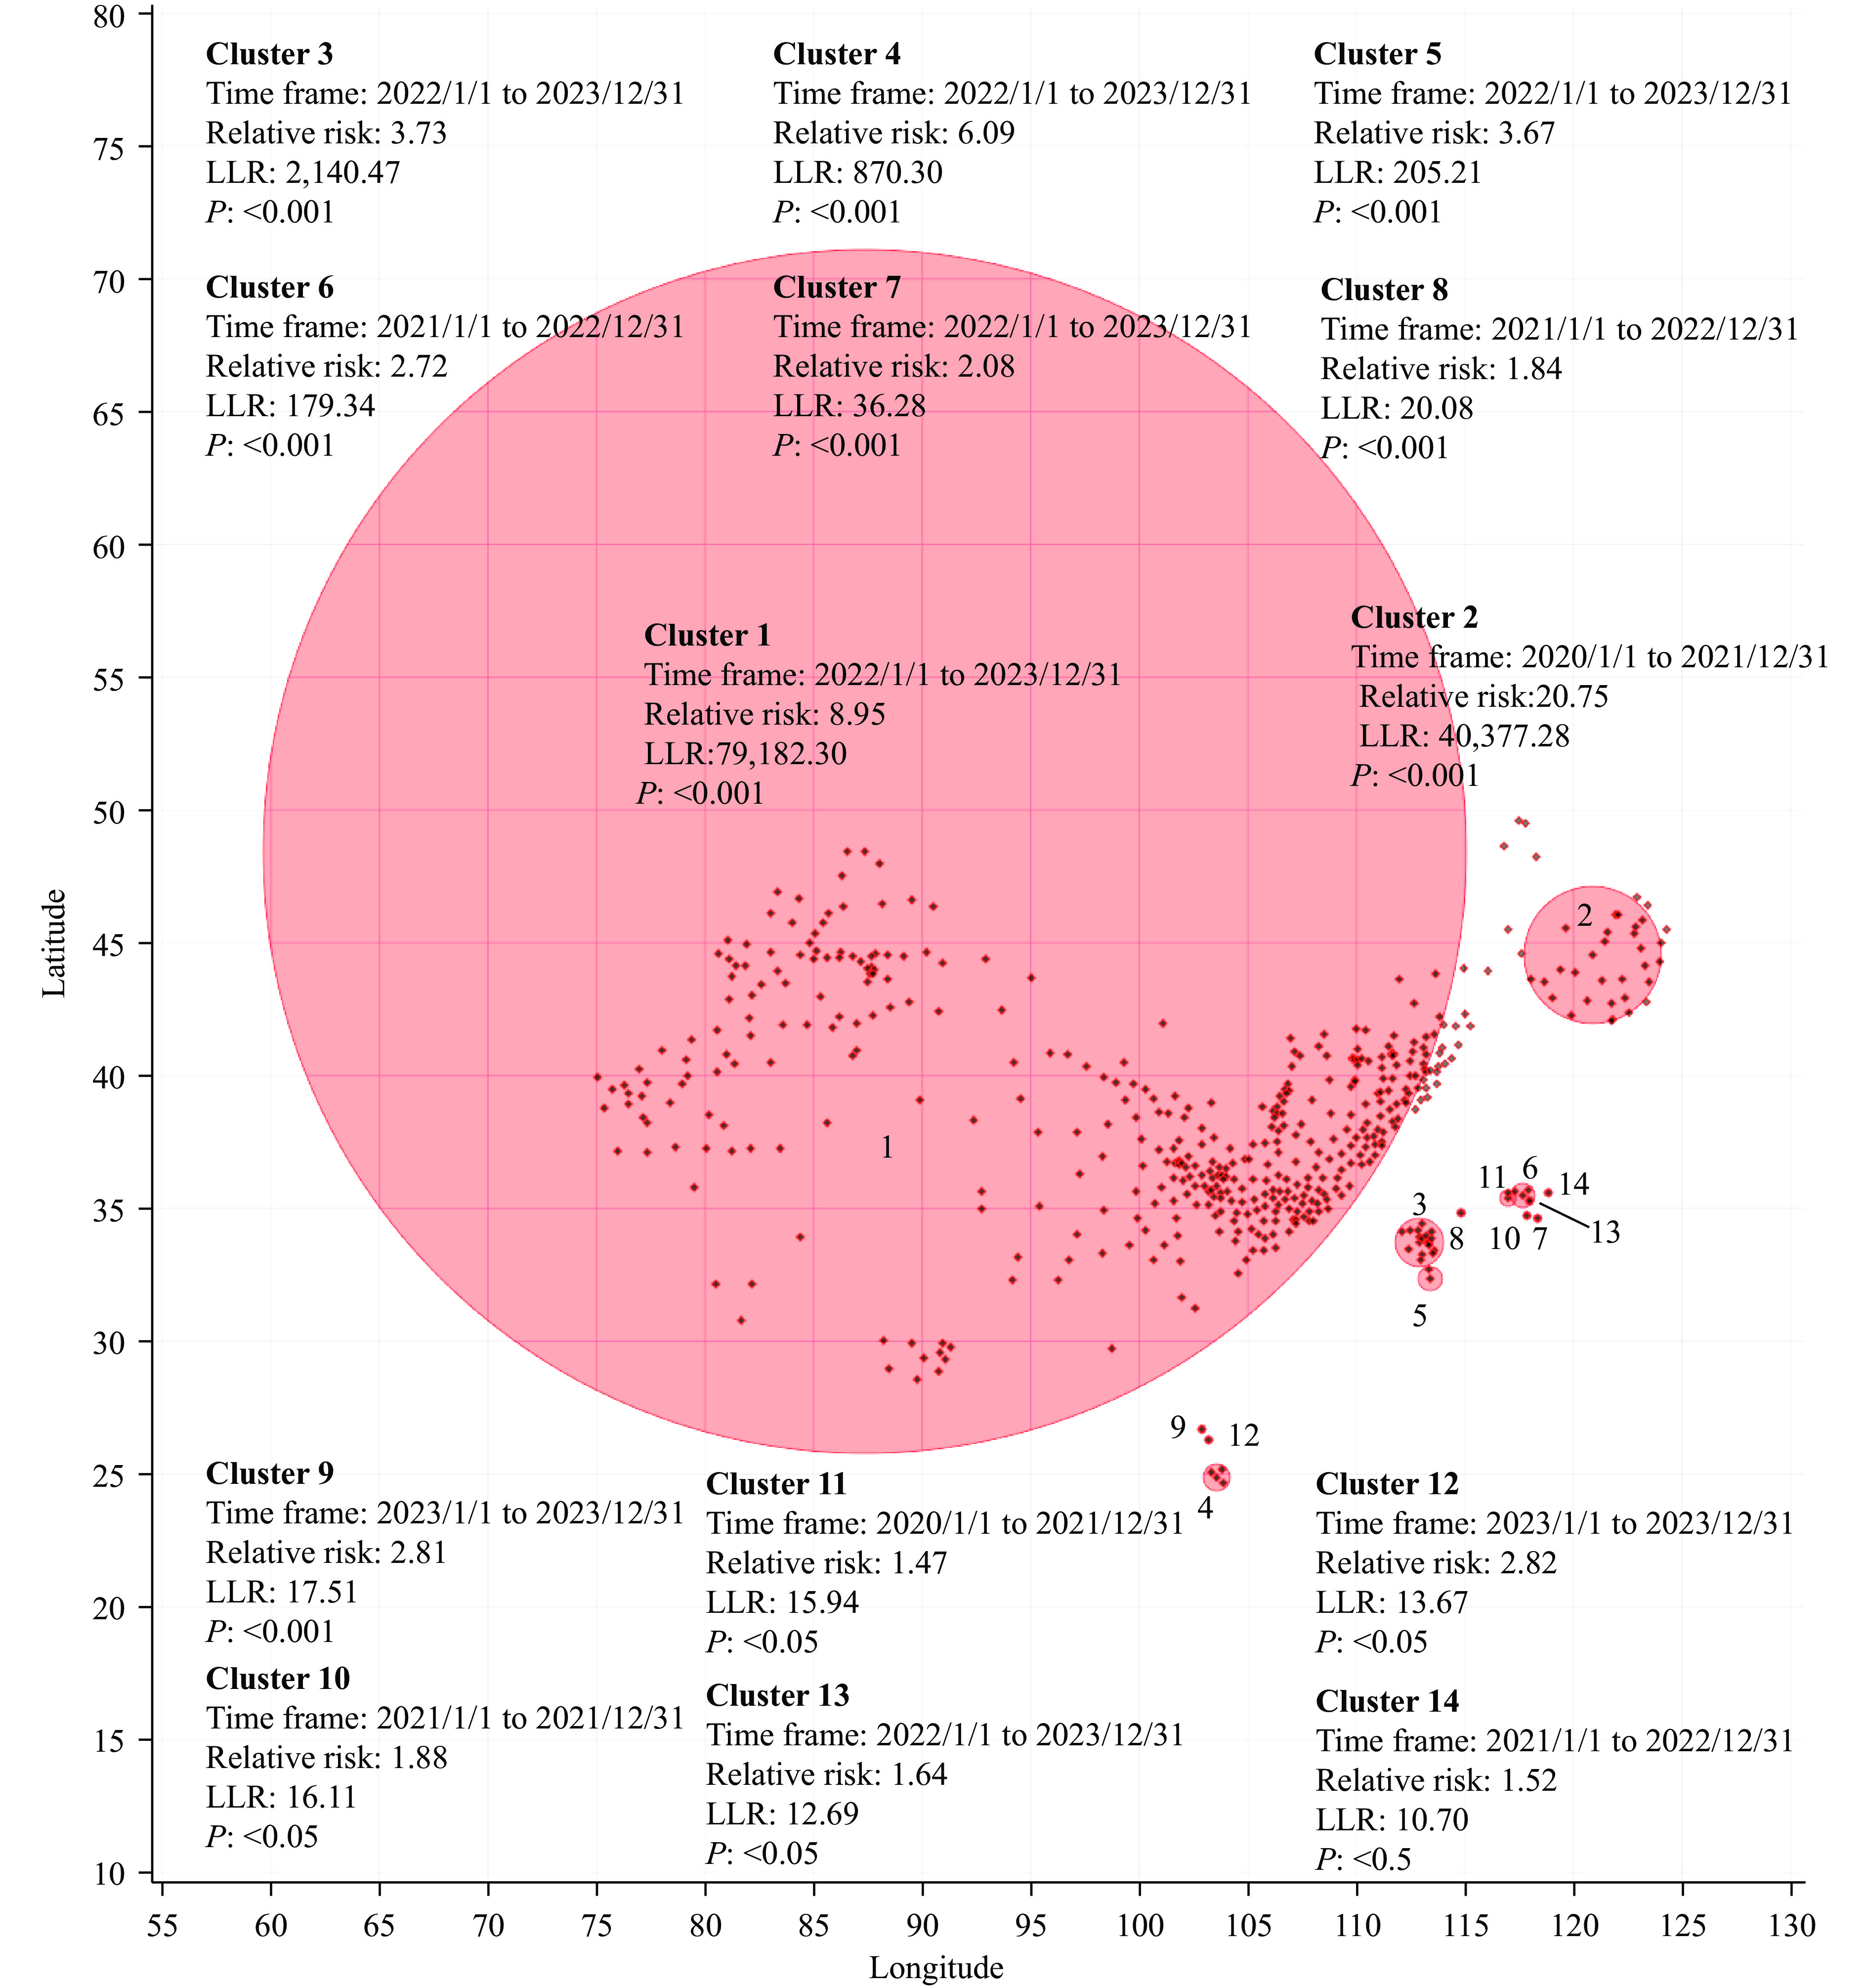 Figure 2.
Spatial-temporal feature of human brucellosis in China, from 2019 to 2023.
Note: Retrospective space-time analysis scanning for clusters with high rates using the Discrete Poisson model; numbers (1–14) in figures indicates location of 14 clusters zones.
Abbreviation: LLR=log likelihood ratio.
Clusters Time frame Relative risk LLR Number of counties PLADs 1 2022/1/1 to 2023/12/31 8.95 79182.30 419 Xinjiang, Inner Mongolia, Gansu, Qinghai, Ningxia, Xizang, Sichuan, Shanxi, Shaanxi, Hebei 2 2020/1/1 to 2021/12/31 20.75 40377.28 33 Inner Mongolia, Jilin, Liaoning, Heilongjiang 3 2022/1/1 to 2023/12/31 3.73 2140.47 19 Henan 4 2022/1/1 to 2023/12/31 6.09 870.29 4 Yunnan 5 2022/1/1 to 2023/12/31 3.67 205.21 2 Henan 6 2021/1/1 to 2022/12/31 2.72 179.34 3 Shandong 7 2022/1/1 to 2023/12/31 2.08 36.28 1 Shandong 8 2021/1/1 to 2022/12/31 1.84 20.08 1 Henan 9 2023/1/1 to 2023/12/31 2.81 17.51 1 Sichuan 10 2021/1/1 to 2021/12/31 1.88 16.11 1 Shandong 11 2020/1/1 to 2021/12/31 1.47 15.94 2 Shandong 12 2023/1/1 to 2023/12/31 2.82 13.67 1 Yunnan 13 2022/1/1 to 2023/12/31 1.64 12.69 1 Shandong 14 2021/1/1 to 2022/12/31 1.52 10.70 1 Shandong Note: Number of counties: total of counties involved in the high-risk clusters zone.
Abbreviation: LLR=log likelihood ratio; PLAD=provincial-level administrative division.Table 4. Distribution profile of high-high clusters of human brucellosis from 2019 to 2023.
The second largest cluster, comprising 33 counties across Inner Mongolia, Jilin, and Liaoning, was identified between January 1, 2020, and December 31, 2021, with a relative risk of 20.75 and LLR of 40,377.28 (P<0.001) (Figure 2). The third largest cluster included 19 counties in Henan Province during January 1, 2022, to December 31, 2023, exhibiting a relative risk of 3.73 and LLR of 2,140.47 (P<0.001). The remaining 11 clusters each contained 1 to 3 counties, distributed across Henan, Shandong, Yunnan, and Sichuan (Figure 2 and Table 4).
-
Our analysis reveals that human brucellosis continued to spread and expand, the majority of cases remain concentrated in northern China, with PLADs in the northwestern and northeastern region. Inner Mongolia’s cases, accounting for 28.87% of the national total, indicate ineffective control measures and inadequate containment of animal brucellosis (7). In agricultural and livestock farming regions facilitate Brucella strain transmission through close human-animal interaction, where livestock farming represents the sole livelihood, complicated by nomadic lifestyles and low socioeconomic conditions.
In southern China, reported cases have increased markedly from 2.0% of national cases in 2019 to 5.38% in 2023, with total cases rising from 4,310 to 10,363. All 15 southern PLADs show upward trends in both case numbers and incidence rates. Molecular epidemiological investigation of Brucella in Guizhou from 2009 to 2021 confirms strain importation from northern areas such as Inner Mongolia and Xinjiang (8).
The high-risk clusters were predominantly concentrated in the northwestern and northeastern regions, with additional clusters in two southern PLADs, Yunnan and Sichuan. This distribution differs from the 2004–2019 pattern, where significant spatial correlations of high incidence were primarily confined to northern China, particularly Inner Mongolia, Shanxi, and Heilongjiang (9). In Jiangsu, the disease progression from 2006 to 2021 showed gradual expansion from northern and southern regions toward central areas. This situation necessitates urgent enhancement of local outbreak response capabilities in high-incidence regions.
The control of human brucellosis is fundamentally dependent on effective animal brucellosis surveillance and control measures. However, the ongoing development of animal husbandry presents significant challenges to animal brucellosis prevention and control (10). Strict enforcement of regulations prohibiting the movement of infected animals from northern to southern areas is crucial, including systematic screening and isolation of diseased animals from herds, and continued vaccination programs. Remarkably, resource and financial investment in brucellosis control must be continuously increased to curb its spread, even after achieving initial control (11).
This study has several limitations. Brucellosis is frequently underreported due to its nonspecific clinical presentation, and our analysis relies on surveillance system data that may be influenced by regional variations in physician awareness of the disease.
Our analysis demonstrates that the disease has not only persisted in northern China but has also established significant presence in southern PLADs. The proportion of total reported cases in southern regions has increased markedly from 2.0% before 2019 to 5.38% after 2019. These findings underscore the urgent need to implement more stringent control strategies to prevent further deterioration of the situation.
-
We acknowledge the dedication of healthcare staff at provincial, prefecture, and county-level CDCs across the 31 PLADs and XPCC in China for their contributions to brucellosis surveillance and control efforts.
HTML
| Citation: |

|