
 Download:


-
Physical inactivity and prolonged sedentary behavior are well-established risk factors for numerous chronic diseases, imposing substantial human and economic costs (1). The global prevalence of insufficient physical activity (PA) among adults has shown a concerning upward trend in recent years (2). In China, the prevalence of insufficient PA among adults has gradually increased, reaching 22.3% by 2018 (3). Sedentary behavior is similarly prevalent throughout China. In response, the Chinese government has implemented various measures to reduce insufficient PA levels and sedentary behavior while improving nationwide fitness. However, current data on PA and sedentary behavior patterns in China are limited despite their critical importance for informing research and public health policy. To address this knowledge gap, we analyzed data from the twelfth wave of the China Health and Nutrition Survey (CHNS), conducted between 2022 and 2023. Our analysis included 10,103 participants aged 18 years and above. Results showed that 85.7% and 70.9% of adults in ten provincial-level administrative divisions (PLADs) adhered to the physical activity guidelines (PAGs) of 150 minutes and 300 minutes, respectively. While occupational PA remained the primary domain, domestic PA and leisure time physical activity (LTPA) followed at 16.9% and 14.2% respectively, with minimal difference between these latter two categories. Screen-based activities emerged as the predominant form of sedentary behavior, with approximately 25% of Chinese adults spending more than 6 hours daily in sedentary activities. Given that social change and rapid urbanization will inevitably continue, increasing LTPA represents the most viable strategy for reducing physical inactivity rates. Further interventions are particularly needed to reduce sedentary time while promoting LTPA participation, especially among young residents and urban populations.
The twelfth round of the CHNS provided an opportunity to investigate the current status of physical activity and sedentary behavior in China. During the 2022–2023 wave, a multistage, stratified sampling design was implemented across ten PLADs: Guangxi, Guizhou, Hunan, Hubei, Shanxi, Shandong, Henan, Jiangsu, Heilongjiang, and Liaoning. Detailed information about the CHNS methodology has been published elsewhere (4). Physical activity and sedentary behavior data were collected through face-to-face interviews using a tablet device (ThinkPad Tablet2, Lenovo, Beijing, China), following previously reported calculation methods. The analysis included 10,103 participants aged 18 years and above with complete physical activity and sedentary behavior data. The study protocols were approved by the institutional review committees of the National Institute for Nutrition and Health, Chinese Center for Disease Control and Prevention (2022–2024), with all participants providing written informed consent. Investigators underwent systematic training and qualification assessment before conducting surveys. Quality control was maintained through a hierarchical supervision system, with designated personnel performing daily spot checks on the electronic survey system and implementing timely corrections.
The metabolic equivalent of task (MET) hours per week was calculated for occupational, domestic, travel, and leisure domains, along with sedentary hours per day. Two adherence proportions were assessed based on the PAGs 2021: first, participation in at least 150 minutes per week of moderate-intensity physical activity or 75 minutes per week of vigorous-intensity physical activity; second, participation in at least 300 minutes per week of moderate-intensity physical activity or 150 minutes per week of vigorous-intensity physical activity. Following established protocols, daily total sedentary time was categorized into two groups (<6 h/d and ≥6 h/d). Categorical variables were expressed as numbers (percentages), with Chi-square tests used for group comparisons. All statistical analyses were performed using SAS (version 9.4, SAS Inc., Cary, NC, USA), with statistical significance set at a two-tailed P<0.05.
Analysis revealed that 85.7% and 70.9% of the study population adhered to the PAG recommendations of 150 minutes and 300 minutes, respectively (Table 1). Additionally, 71.2% of the population reported total sedentary time below 6 hours daily. Notably, males, individuals aged 18–44 years, and urban residents demonstrated significantly higher proportions of extended sedentary time (≥6 h/d) compared to their demographic counterparts.
Characteristics
NAdherence proportion to the PAGs (N, %) Total sedentary time (N, %) ≥150 mins/w ≥300 mins/w <6 h/d ≥6 h/d Total 10,103 8,658 (85.7) 7,163 (70.9) 7,193 (71.2) 2,910 (28.8) Gender Male 4,675 4,193 (89.7) 3,698 (79.1) 3,235 (69.2) 1,440 (30.8) Female 5,428 4,494 (82.8) 3,517 (64.8) 3,957 (72.9) 1,471 (27.1) P <0.001 <0.001 <0.001 <0.001 Age group (years) 18–44 2,399 1,960 (81.7) 1,487 (62.0) 1,188 (49.5) 1,211 (50.5) 45–59 3,463 3,027 (87.4) 2,576 (74.4) 2,393 (69.1) 1,070 (30.9) ≥60 4,241 3,660 (86.3) 3,066 (72.3) 3,584 (84.5) 657 (15.5) P <0.001 <0.001 <0.001 <0.001 Area Urban 3,280 2,627 (80.1) 1,955 (59.6) 2,116 (64.5) 1,164 (35.5) Rural 6,823 5,991 (87.8) 5,165 (75.7) 5,069 (74.3) 1,754 (25.7) P <0.001 <0.001 <0.001 <0.001 Abbreviation: PAGs=physical activity guidelines; PLADs=provincial-level administrative divisions. Table 1. Adherence proportion to the PAGs and sedentary behavior among Chinese adults in ten PLADs, 2022–2023.
Figure 1 illustrates the distribution of physical activity across four domains. Occupational PA emerged as the predominant contributor to total PA across all demographic subgroups. Domestic PA and LTPA ranked second and third, contributing 16.9% and 14.2% respectively, with a minimal differential between these domains. Figure 2 demonstrates that screen-based sedentary time exceeded 50% across all population subgroups. The 18–44 age group and urban residents exhibited the highest proportions of sedentary time, with screen-based activities accounting for 53.6% and 52.7% of total sedentary time, respectively.
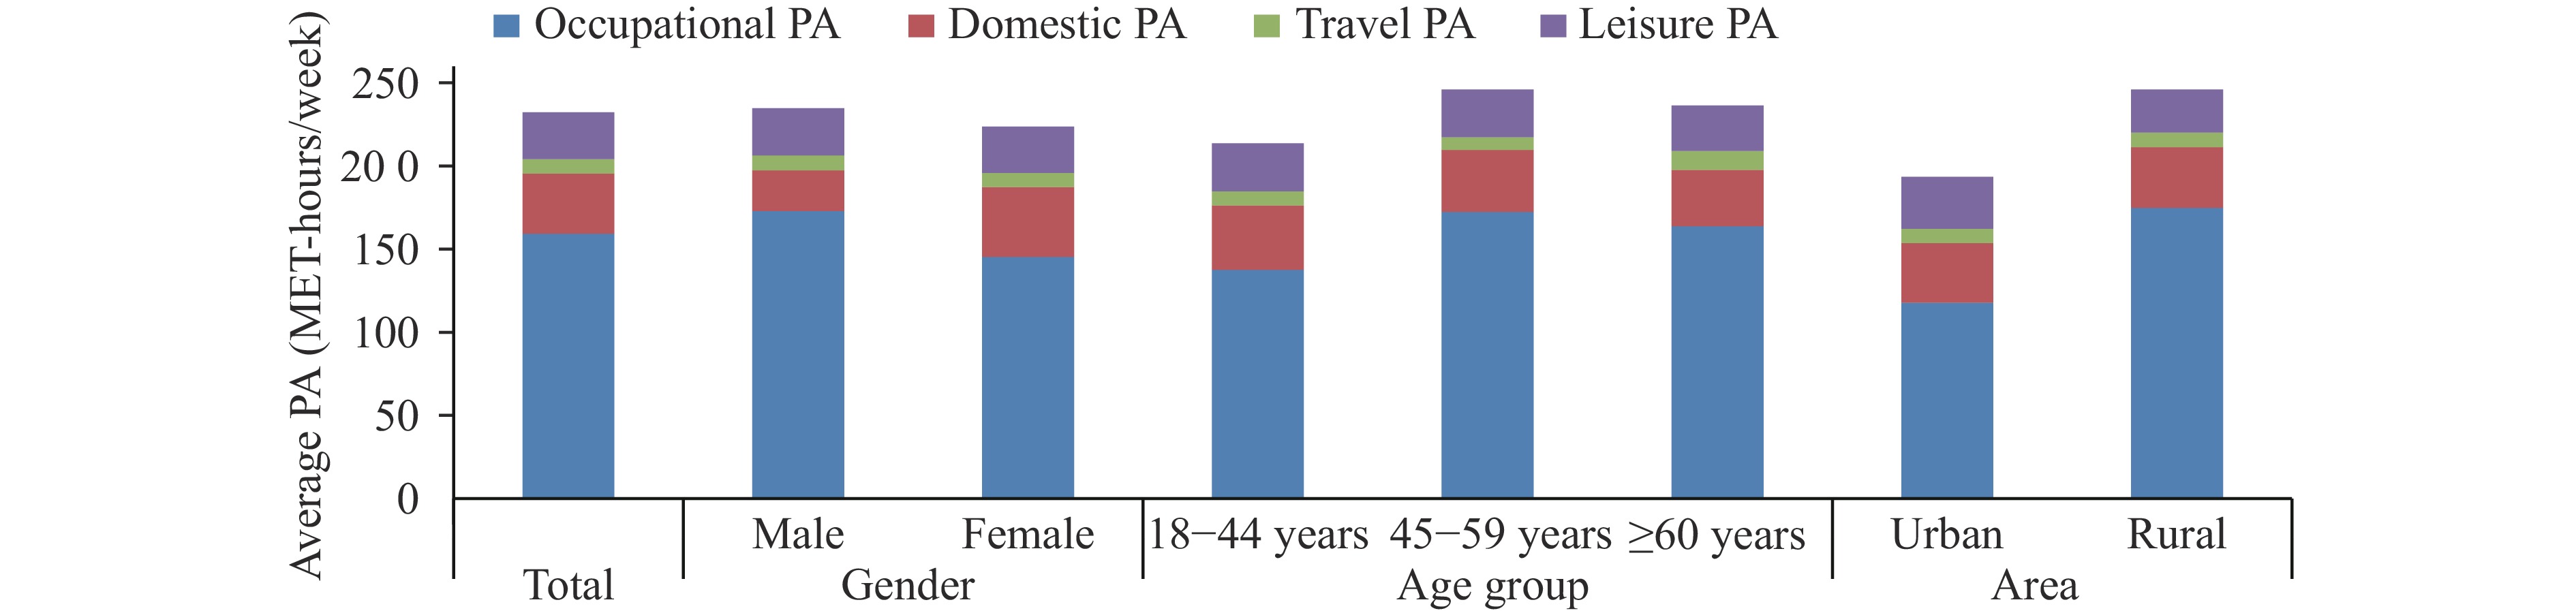 Figure 1.
Composition of four different domains of physical activity among Chinese adults in ten PLADs, 2022–2023.
Abbreviation: PA=physical activity; MET-hour/week=metabolic equivalent of task hours per week;PLADs=provincial-level administrative divisions.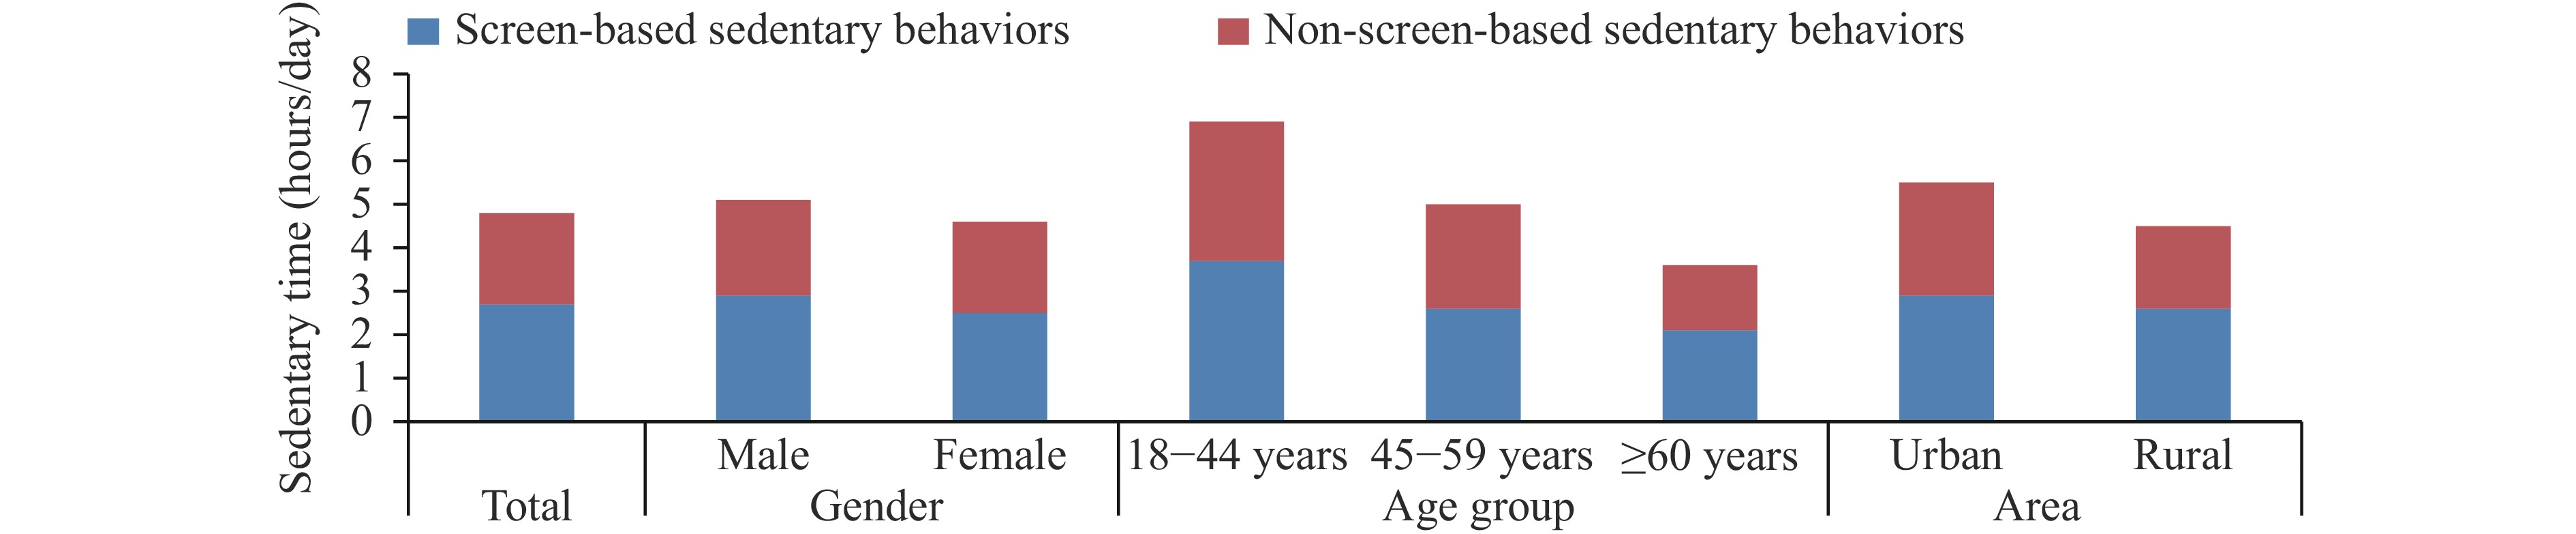 Figure 2.
Composition of different types of sedentary behaviors among Chinese adults in ten PLADs, 2022–2023.
Abbreviation: PLADs=provincial-level administrative divisions. -
Our analysis revealed that 85.7% and 70.9% of adults in ten PLADs of China met the PAG recommendations for 150 minutes and 300 minutes of physical activity, respectively. This improvement in adherence rates can be attributed to recent government initiatives promoting physical fitness. The implementation of the Healthy China strategy and National Fitness Program has catalyzed a significant increase in public engagement with fitness activities. Infrastructure developments have been substantial, with government-built public sports venues and park locations increasing by 8.5 and 3.6 percentage points compared to 2014. Consequently, 80.7% of adults now have access to sports and fitness facilities within a 15-minute walking distance (5). Recent studies indicate an upward trend in both LTPA participation and regular LTPA engagement (6). While Western populations predominantly engage in LTPA, Asian countries such as China (7) and Iran (8) have historically emphasized occupational and domestic PA. Our current findings indicate that while occupational PA remains the primary form of physical activity, its proportion has decreased to 68.6% of total PA. This shift reflects the impact of technological advancement, including smart office systems, household automation, and vehicular transportation, which have reduced PA across occupational, domestic, and travel domains. Notably, LTPA now comprises 14.2% of total PA, approaching the 16.9% contribution from domestic PA. Given the inevitable reduction in work-related, household, and transportation-related PA due to technological progress and artificial intelligence, LTPA represents the most viable pathway for maintaining adequate PA levels. While the government has made strides in creating environments conducive to recreational physical activities, significant disparities persist in the distribution and accessibility of sports facilities between urban and rural areas. Rural regions require additional infrastructure development, while urban areas need to improve public access to existing facilities. These challenges must be addressed within the context of ongoing social transformation and urbanization.
Furthermore, the World Health Organization guidelines emphasize limiting sedentary time to mitigate its detrimental health effects. Our findings align with previous research indicating that approximately 25% of individuals engage in sedentary behavior for more than 6 hours daily, comparable to the United States, where nearly half of adults report sitting for more than 6 hours per day, with higher rates among elderly populations (9). Screen-based activities emerged as the predominant form of sedentary behavior, accounting for 55.6% of total sedentary time across the population. This prevalence can be attributed to the widespread adoption of television, portable electronic devices, and mobile phones. China's ongoing rapid urbanization inevitably continues to transform lifestyle patterns, leading to decreased physical activity and increased sedentary time. While previous studies have documented a declining trend in daily dietary energy intake among Chinese adults over recent decades, the prevalence of overweight and obesity continues to rise (7,10). This paradox may be explained by the reduction in energy expenditure — driven by decreased physical activity and increased sedentary time — outpacing the reduction in dietary energy intake. To address these challenges, we recommend continuing the installation of fitness equipment in rural community spaces to increase per capita sports facility access, while simultaneously improving the utilization of existing urban sports facilities through enhanced public accessibility.
This study has several limitations that warrant consideration. First, the reliance on self-reported physical activity and sedentary behavior data may introduce recall bias. However, we attempted to minimize this bias by separately investigating four distinct types of physical activities and differentiating between weekday and weekend patterns. Second, as our findings are based on data from ten PLADs in China, they may not be fully generalizable to the entire nation. In conclusion, this study provides an up-to-date assessment of physical activity and sedentary behavior patterns among residents in ten PLADs of China. Future public health policies should focus on two key areas: first, promoting LTPA by addressing the urban-rural imbalance in sports facility resources and improving venue accessibility; And second, enhancing public awareness about reducing screen-based sedentary time, particularly among young people and urban residents.
HTML
| Citation: |

|