
 Download:


-
Calcium, magnesium, sodium, and potassium are essential macroelements for human health. While China has implemented comprehensive policies to enhance nutritional and health status, understanding current macroelement intake patterns among Chinese adults remains crucial. This study analyzed adults participating in the China Development and Nutrition Health Impact Cohort Survey (2022–2023), which continues the China Health and Nutrition Survey (CHNS). Using consecutive 3-day 24-hour dietary recall combined with household weighing methods, we calculated intake levels of calcium, magnesium, sodium, and potassium. Results revealed median daily intakes of 288.3, 228.9, 4,182.4, and 1,397.6 mg/d for these macroelements, respectively, with a median Na/K ratio of 3.0. Analysis showed that 96.1% of adults had calcium intake below the estimated average requirement (EAR), 64.4% had magnesium intake below the EAR, 81.9% had potassium intake below the adequate intake (AI), and 89.4% exceeded the Prevention of non-communicable diseases intake level (PI-NCD) for sodium. Urban areas consistently demonstrated better macroelement intake patterns compared to rural areas. These findings indicate the need for a comprehensive approach encompassing enhanced nutrition education, promotion of healthy eating habits, strengthened food supply chains, and improved access to nutritious foods to elevate overall nutrition status and reduce urban-rural disparities.
This study utilizes data from the China Development and Nutrition Health Impact Cohort Survey (2022–2023), which builds upon the CHNS, an ongoing large-scale, longitudinal cohort study initiated in 1989 (1). The study population comprises Chinese adults from 10 provincial-level administrative divisions (PLADs, including Heilongjiang, Liaoning, Jiangsu, Shandong, Henan, Hubei, Hunan, Guizhou, and Shaanxi provinces; and Guangxi Zhuang Autonomous Region). Exclusion criteria included individuals with implausible energy intake (<600 or >4,000 kcal/d for females, <800 or >5,000 kcal/d for males), implausible macroelements intake (<1% or >99%), and pregnant or lactating women. The study protocol was approved by the institutional review board of the National Institute for Nutrition and Health, China CDC (ethics approval code 2022-024), with all participants providing written informed consent prior to participation.
Dietary intake data were collected through consecutive 3-day 24-hour dietary recalls (2 workdays and 1 weekend day) using face-to-face interviews at participants’ homes. Household weighing methods were employed to measure the consumption of cooking oils and condiments during the corresponding 3-day period. Macroelement intake calculations were based on the China Food Component Table. According to the Dietary Reference Intakes for China 2023 (DRIs 2023) (2), population-level nutrient inadequacy was assessed by calculating the proportion of individuals with daily calcium or magnesium intake below the EAR or daily potassium intake below the AI. For sodium, the proportion of individuals exceeding the proposed intakes for preventing non -communicable chronic diseases (PI-NCD) was calculated to assess chronic disease risk. Age-specific EAR, AI, and PI-NCD values are presented in
Supplementary Table S1 .Given the non-normal distribution of macroelement intake, statistical analyses employed the Kruskal-Wallis test to evaluate differences in median intake across age groups, while the Wilcoxon rank sum test compared median intake between genders and urban-rural areas. Mean±standard deviation values were reported to facilitate comparison with other studies. The chi-square test was used to compare proportions between different groups. All statistical tests were two-tailed, with significance set at P<0.05. Analyses were conducted using R (version 4.4.0, R Foundation for Statistical Computing, Vienna, Austria), and figures were generated using both R and Microsoft Office Excel 2019 MSO (version 2406, Microsoft Corporation, Santa Rosa, California, USA).
This study included 8,912 participants with a mean age of 55.9 years. Table 1 demonstrates that Chinese adults in 2022–2023 had median daily intakes of 288.3 mg calcium, 228.9 mg magnesium, 4,182.4 mg sodium, and 1,397.6 mg potassium, with a median Na/K ratio of 3.0. Urban residents exhibited significantly higher intakes of calcium (311.4 mg/d), magnesium (234.3 mg/d), and potassium (1,467.6 mg/d) compared to rural residents (278.0, 226.2, and 1,359.9 mg/d, respectively). Additionally, urban residents maintained a significantly lower Na/K ratio than their rural counterparts (2.8 vs. 3.1).
Characteristics n (%) Ca Mg Na K Na/K ratio Median (IQR) Mean±SD Median (IQR) Mean±SD Median (IQR) Mean±SD Median (IQR) Mean±SD Median (IQR) Mean±SD Age, years 18–44 2,032 (22.8) 283.7 (198.8) 313.5±155.8 222.3 (122.3) 243.4±102.4 4,010.8 (3,461.1) 5,039.4±3,906.9 1,422.1 (748.6) 1,512.4±612.8 2.9 (2.5) 3.7±3.5 45–59 3,092 (34.7) 296.3 (192.7) 321.6±153.4 238.8 (126.5) 258.2±102.9 4,399.7 (3,390.4) 5,407.5±4,015.9 1,443 (793.2) 1,551.7±611.5 3.1 (2.6) 3.9±3.3 60–79 3,430 (38.5) 285.3 (204.3) 319.5±158.2 227.5 (125.7) 249.1±104.1 4,119.9 (3,212.6) 5,048±3,689.9 1,354.4 (760) 1,460.1±598.5 3 (2.6) 3.9±3.3 ≥80 358 (4.0) 273.7 (223.8) 316.5±174.8 197.3 (117.9) 219.2±99 3,671.3 (3,138.5) 4,814±4,430.6 1,153.4 (717.7) 1,288.9±570.6 3.1 (2.6) 4.3±4.9 P − 0.019 − <0.001 − <0.001 − <0.001 − <0.001 − Gender Male 4,104 (46.1) 303.1 (203.0) 330.7±157.1 245.8 (129.1) 265.2±106.2 4,540.1 (3,489.1) 5,497.7±3,914.9 1,478.7 (800.8) 1,576.6±622.5 3.1 (2.6) 3.9±3.2 Female 4,808 (53.9) 276.7 (194.8) 308.5±155.7 216.0 (118) 236.6±99.1 3,878.8 (3,095.7) 4,874.4±3,846.1 1,327.7 (730.2) 1,428.9±586.7 2.9 (2.5) 3.9±3.6 P − <0.001 − <0.001 − <0.001 − <0.001 − 0.002 − Area type Urban 2,899 (32.5) 311.4 (216.1) 338.8±163.4 234.3 (125.8) 254.3±104.2 4,094.7 (3,372.6) 5,121.7±4,045.6 1,467.6 (784.6) 1,565±616 2.8 (2.5) 3.7±3.2 Rural 6,013 (67.5) 278 (191.0) 309.1±152.5 226.2 (125.3) 247.6±103.0 4,244.8 (3,350.8) 5,180.5±3,813.1 1,359.9 (748.7) 1,464.1±601.3 3.1 (2.6) 4.0±3.5 P − <0.001 − <0.001 − 0.122 − <0.001 − <0.001 − Total 8,912 (100.0) 288.3 (199.2) 318.7±156.7 228.9 (125.5) 249.8±103.4 4,182.4 (3,355) 5,161.4±3,890.1 1,397.6 (770.7) 1,496.9±607.9 3.0 (2.6) 3.9±3.4 Note: Statistical analyses were performed using Wilcoxon rank sum test for two-group comparisons and Kruskal-Wallis test for multiple group comparisons.
-: Not applicable.
Abbreviation: IQR=interquartile range; SD=standard deviation.Table 1. Daily intake of calcium, magnesium, sodium, potassium (mg/d) and sodium/potassium ratio.
As shown in Figure 1, the prevalence of inadequate intake was widespread among adults: 96.1% fell below the EAR for calcium, 64.4% below the EAR for magnesium, and 81.9% below the AI for potassium. Furthermore, 89.4% exceeded the PI-NCD for sodium intake. Urban areas consistently demonstrated better nutritional status, with significantly lower proportions of inadequate intake across all macroelements compared to rural areas (P<0.001 for calcium, sodium, and potassium; P=0.027 for magnesium).
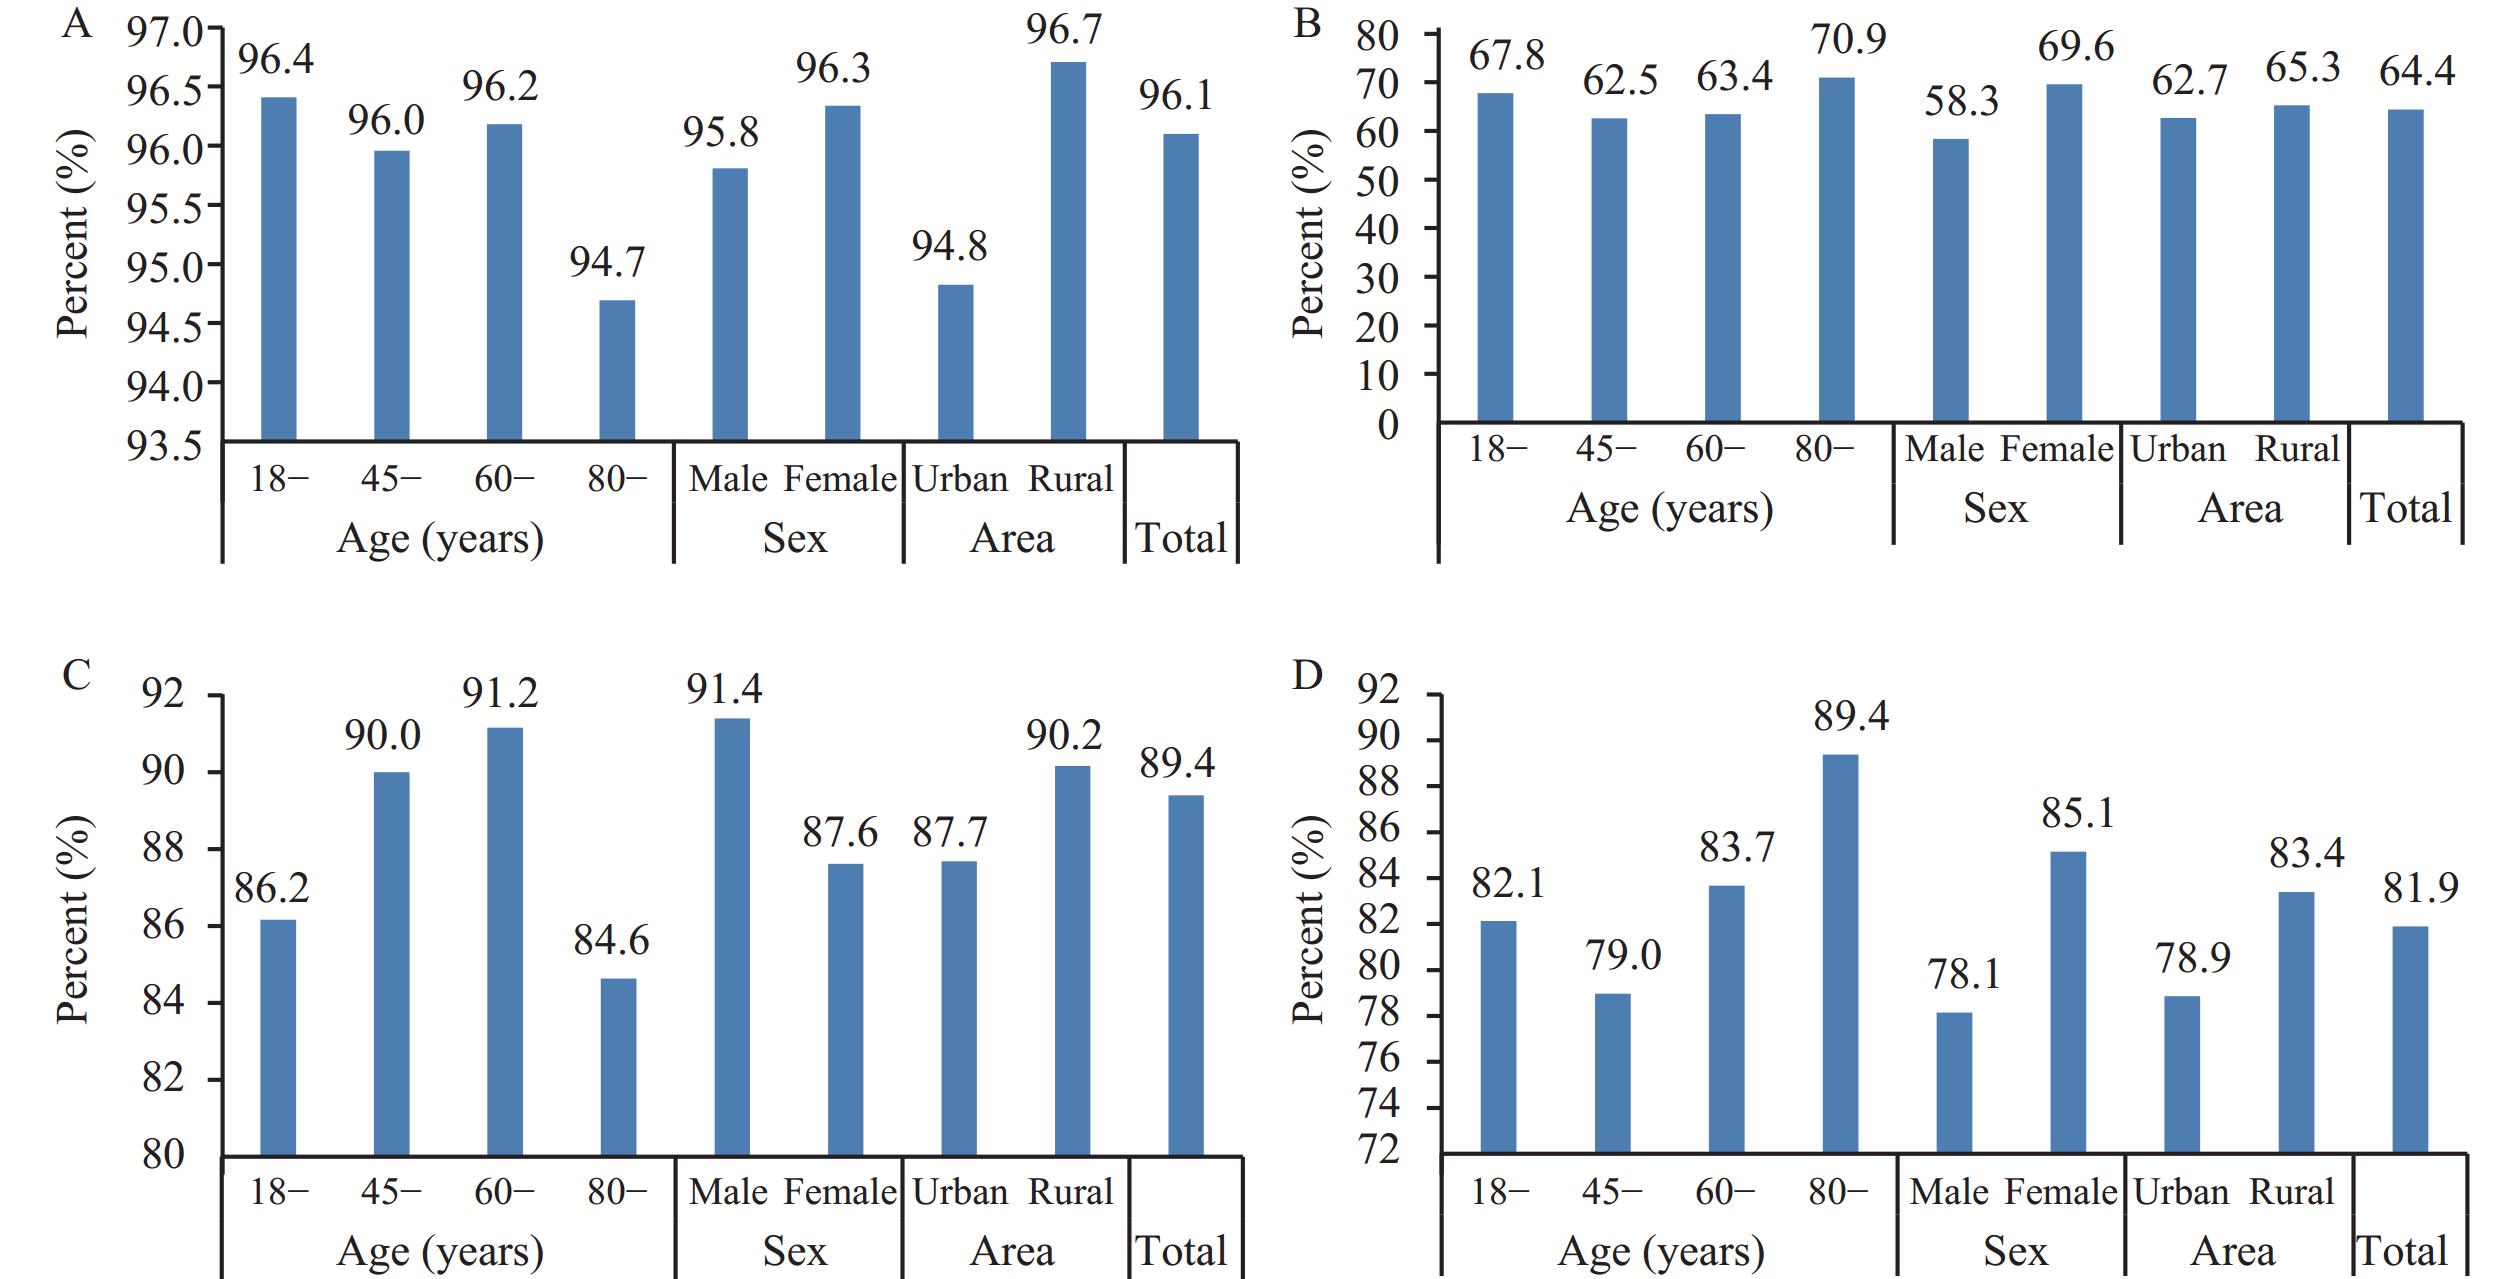 Figure 1.
Proportions of insufficient intake of calcium, magnesium, and potassium, and excessive intake of sodium. (A) Calcium; (B) Magnesium; (C) Sodium; (D) Potassium.
As shown in Figure 2, analysis of Na/K ratios revealed that only 5.7% of Chinese adults maintained the optimal ratio of ≤1, while 49.8% exhibited ratios >3. Urban-rural disparities were evident, with urban areas showing a significantly higher proportion of adults achieving the optimal Na/K ratio ≤1 (7.8% vs. 4.7% in rural areas) and a lower proportion with ratios >3 (45.4% vs. 51.9% in rural areas) (P<0.001).
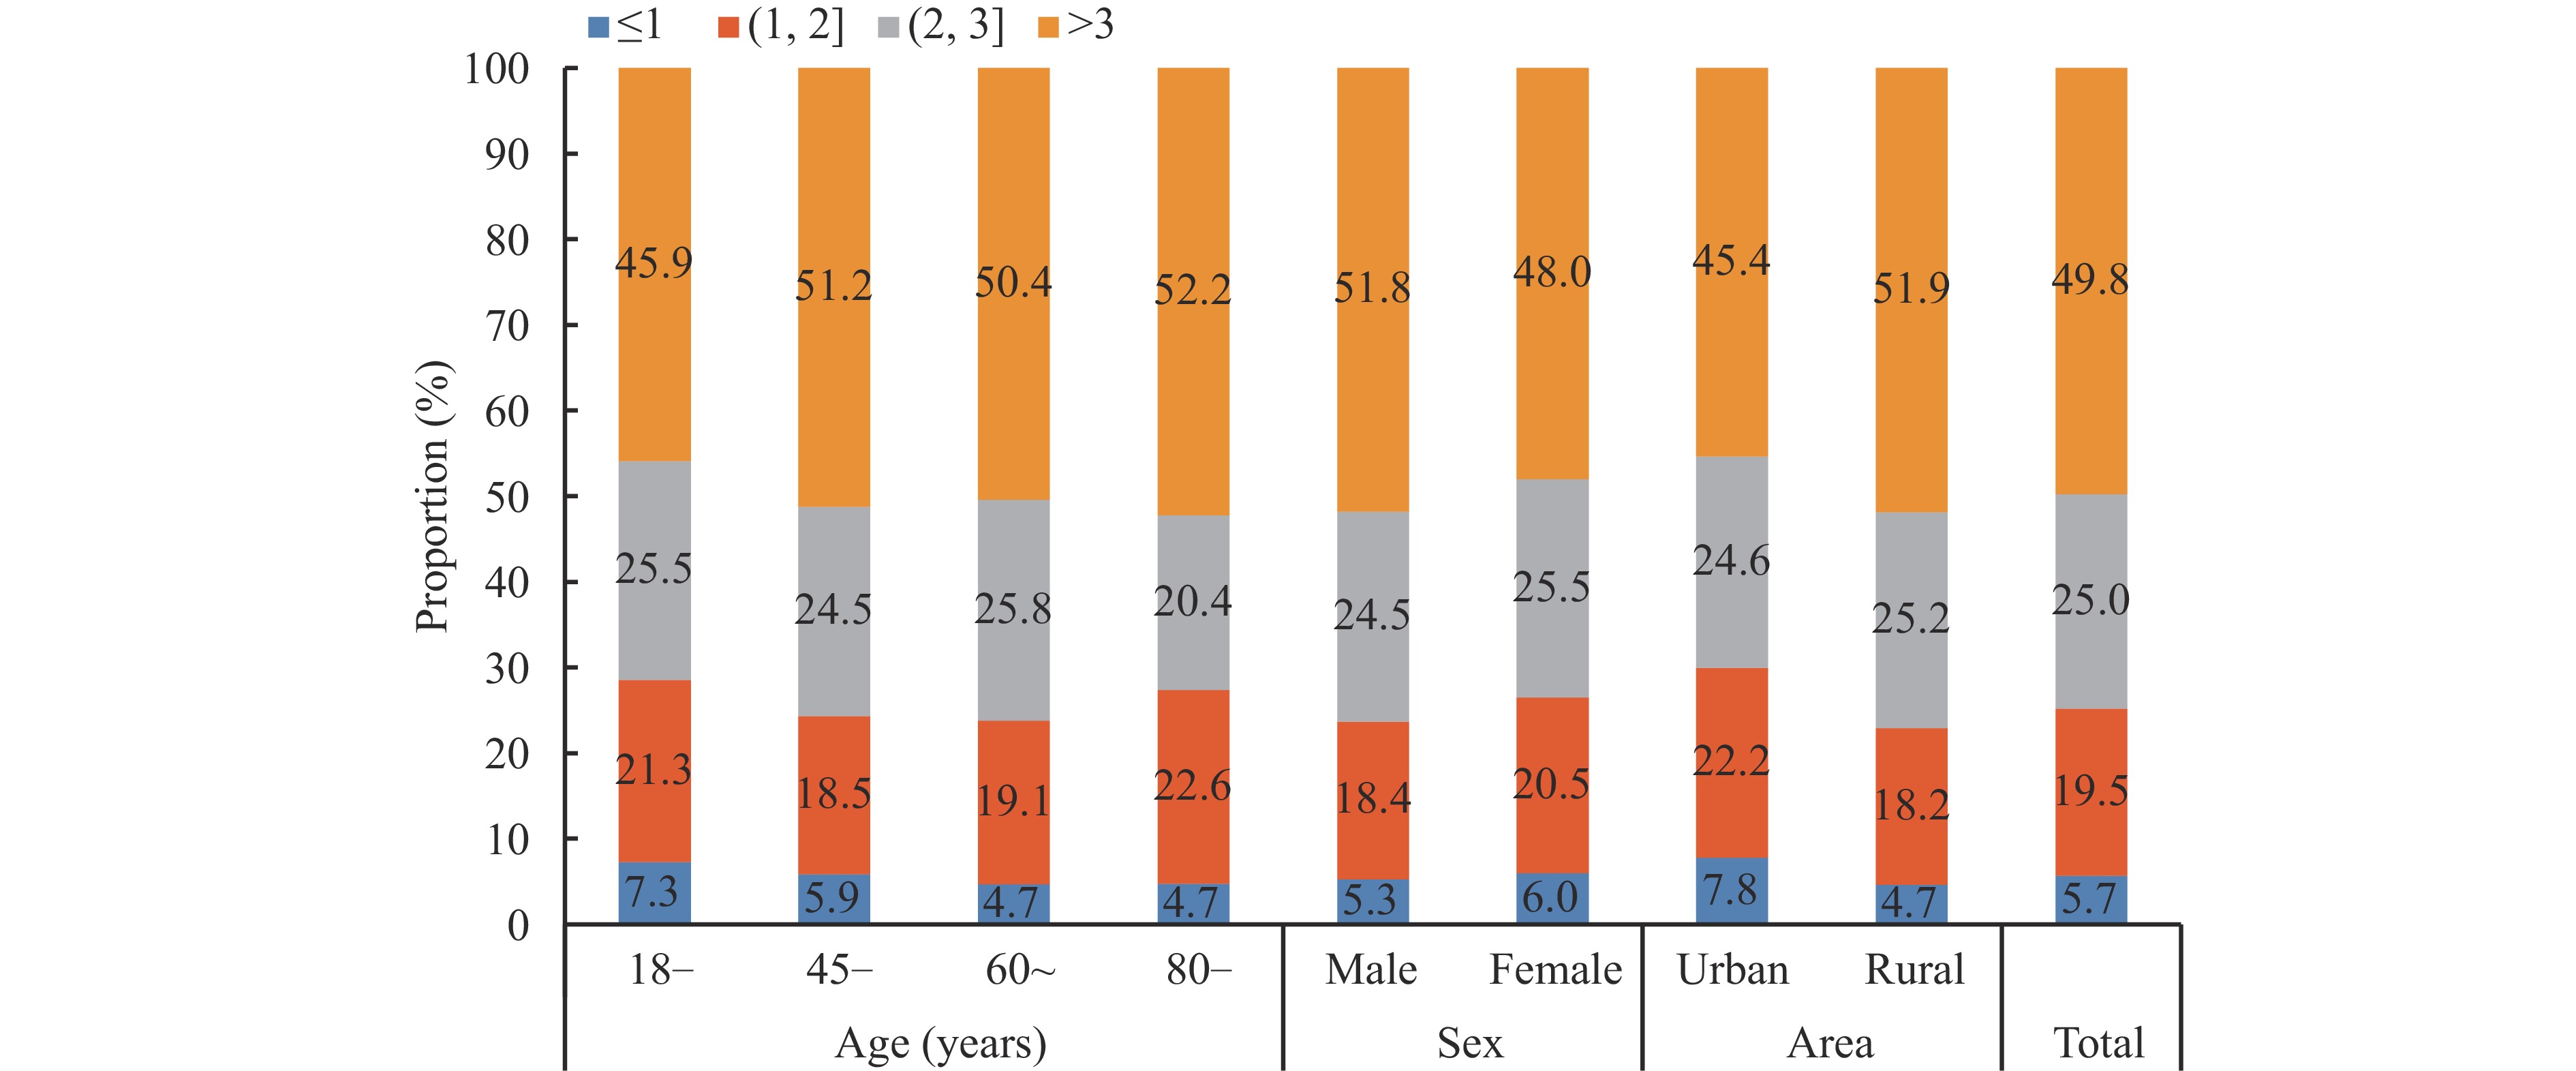 Figure 2.
Distribution of sodium-to-potassium ratio among Chinese adults in 2022–2023.
-
Our research reveals that the intake of calcium, magnesium, and potassium in Chinese adults remains suboptimal, while sodium intake and the sodium-to-potassium ratio are elevated. The Chinese Nutrition and Health Surveillance (CNHS) in 2015–2017, a nationally representative survey, reported mean intakes of calcium, magnesium, sodium, and potassium of 328.3, 251.8, 5,681.4, and 1,474.1 mg/d for adults aged 18–59 years, and 333.2, 242.5, 5412.1, and 1392.6 mg/d for those aged 60 and above, respectively (3). Despite China’s implementation of comprehensive policies to enhance nutritional and health status, including the “National Nutrition Plan 2017–2030” and the “Healthy China Initiative 2019–2030: Reasonable Diet Action”, our findings indicate no substantial improvement in macroelement intake among Chinese adults over this seven-year period.
As illustrated in
Supplementary Figure S1 , vegetables, cereals, and dried legumes constitute the primary dietary sources of calcium, aligning with findings from the CHNS project in 2015 (4). Notably, milk’s contribution to total calcium intake has increased to 9.7% from 6.7% in 2015 (4). However, given the persistently low consumption of dairy products (5), there remains substantial room for improving dairy intake among the population.Our analysis indicates that 64.4% of Chinese adults exhibit inadequate magnesium intake, consistent with the CHNS project findings from 2015, which reported inadequacy rates between 60.9% and 68.45% (6). Whole grains and dark vegetables, recognized as superior sources of dietary magnesium, remain the predominant contributors to magnesium intake among Chinese adults in 2022–2023, accounting for 40.4% and 16.2% of total intake, respectively. The observed inadequate magnesium intake may be attributed primarily to the declining consumption patterns of cereals and vegetables (3).
The Chinese Dietary Guidelines recommend a daily sodium intake not exceeding 2,000 mg. Our findings from 2022–2023 reveal that Chinese adults’ median and mean sodium intakes are 4,182.4 and 5,161.4 mg/d respectively, more than double the recommended maximum. The proportion of individuals exceeding the PI-NCD for sodium intake has reached 89.4%, compared to 86.7% and 88.2% exceeding 2,000 mg/d in 2018 and 2015, respectively (7-8). Notably, 89.1% of dietary sodium intake derives from cooking salt, as shown in Supplementary Figure S1. While the National ‘Healthy Lifestyle Action Plan (2017–2025)’ has implemented six specific action plans — targeting reductions in salt, oil, and sugar, alongside promoting healthy oral health, weight, and bones — and despite a modest downward trend in salt consumption, sodium intake remains persistently elevated (9). Future interventions must continue prioritizing salt reduction strategies to achieve meaningful decreases in salt and sodium consumption.
Meta-analytic evidence indicates that early dietary modifications targeting a Na/K molar ratio of approximately one unit could significantly contribute to hypertension prevention. Our study reveals a concerning Na/K ratio of 3.0 (mean 3.9). The Action on Salt China conducted the largest-scale survey across six PLADs in 2018, employing 24-hour urinary sodium and potassium measurements — the gold standard for intake assessment. Their findings revealed a markedly imbalanced sodium-to-potassium ratio of 5:1 among the Chinese population (10). This substantial imbalance primarily stems from excessive salt consumption coupled with insufficient intake of potassium-rich foods.
A notable urban-rural disparity exists in macroelement intake patterns, with urban areas demonstrating higher intake levels of calcium, magnesium, and potassium. While sodium intake shows no significant urban-rural difference, the lower dietary potassium intake in rural areas results in a higher sodium-to-potassium ratio compared to urban areas. These findings collectively indicate that urban populations maintain generally superior macroelement intake patterns compared to their rural counterparts.
A limitation of this study is that the subjects, drawn from 10 PLADs in China, do not constitute a nationally representative sample. In addition, the macroelement intake in this study only considered food sources. The ignorance of additional intake of nutrient supplements may result in a slight underestimate of calcium or magnesium.
In conclusion, our findings reveal that macroelement intake among Chinese adults remains substantially below recommended targets. To address these nutritional disparities, strict adherence to and implementation of national policies and guidelines — including the National Nutrition Plan 2017–2030 and the Healthy China Initiative 2019–2030: Reasonable Diet Action — is essential for improving overall nutrition status and reducing the urban-rural nutritional gap.
HTML
| Citation: |

|