
 Download:


-
Occupational noise-induced deafness (ONID) ranks among the most prevalent recognized occupational diseases in industrialized nations (1). In China, ONID has maintained its position as the second most common occupational disease since 2015 (2), with Guangdong Province reporting it as the leading occupational disease. Suspected ONID represents a preliminary diagnostic state where workers exposed to occupational noise demonstrate hearing loss meeting ONID diagnostic thresholds but require additional exposure documentation or medical evidence for definitive diagnosis (3-4). The National Health Commission of China emphasizes the importance of enhancing medical institutions’ capabilities in identifying suspected occupational diseases and increasing the initiation rate of subsequent diagnostic procedures (5). While Guangdong Province reports the highest proportion of suspected ONID cases among suspected occupational diseases provincially and ranks prominently nationwide, comprehensive research examining the epidemiological characteristics and diagnostic outcomes of these cases remains limited (6–7). To address this knowledge gap, we conducted a systematic investigation of suspected ONID cases in Guangdong Province from 2014 to 2023, analyzing their epidemiological patterns and diagnostic trajectories. This research aims to establish an evidence-based foundation for developing effective ONID prevention and management policies.
-
Surveillance data of suspected ONID cases in Guangdong Province from January 1, 2014, to December 31, 2023, were extracted from the “Occupational Diseases and Health Hazard Factors Monitoring Information System,” a subsystem of the “China Information System for Disease Prevention and Control.” All data were de-identified through a unique code assignment. Certified physicians at medical institutions identified suspected ONID cases according to two national standards: the ‘Diagnosis of occupational noise-induced deafness (GBZ 49-2014)’ and the ‘Identification standard for suspected occupational disease (GBZ 325-2022)’ (3–4).
The analysis employed descriptive epidemiological methods to characterize suspected ONID cases. The “Occupational Diseases and Health Hazard Factors Monitoring Information System” began collecting data on occupational disease diagnostic procedures in 2020; therefore, epidemiological characteristics analysis encompassed cases from 2014 to 2023, while diagnostic outcome analysis included only cases reported between 2020 and 2023. To ensure a comprehensive assessment of diagnostic progression, cases were followed through June 30, 2024.
The epidemiological analysis examined case distribution across temporal, spatial, and demographic dimensions (sex, age, and occupational noise exposure duration), as well as enterprise attributes (industry sector, scale, and registration type) and identification institution characteristics (ownership type, classification, and certification). Statistical analyses were conducted using R software (version 4.3.0, R Development Core Team). Long-term trends in suspected ONID cases were quantified using Joinpoint regression analysis (Joinpoint software version 5.2.0; National Cancer Institute, Rockville, MD, USA), calculating the annual percentage change (APC) for each segment and the average annual percentage change (AAPC) for the global trend, with corresponding 95% confidence intervals (CIs) (8). Trends were classified as increasing (APC and/or AAPC>0), decreasing (APC and/or AAPC<0) based on slope significance (P<0.05), or stable (non-significant APC and/or AAPC, P≥0.05) (9).
-
From 2014 to 2023, 16,987 suspected ONID cases were reported, demonstrating a significant increasing trend (AAPC: 11.8, 95% CI: 2.9–22.3, P=0.013). Figure 1 depicts the geographic distribution across 21 cities, with the highest case numbers reported in Foshan (3,590; 21.1%), Shenzhen (2,984; 17.6%), Zhongshan (2,400; 14.1%), Dongguan (1,979; 11.7%), and Guangzhou (1,640; 9.7%). The Pearl River Delta region accounted for 87.9% (14,932/16,987) of total cases. The proportion of suspected ONID among all suspected occupational diseases varied substantially by city, ranging from 12.5% in Shanwei to 91.0% in Zhanjiang.
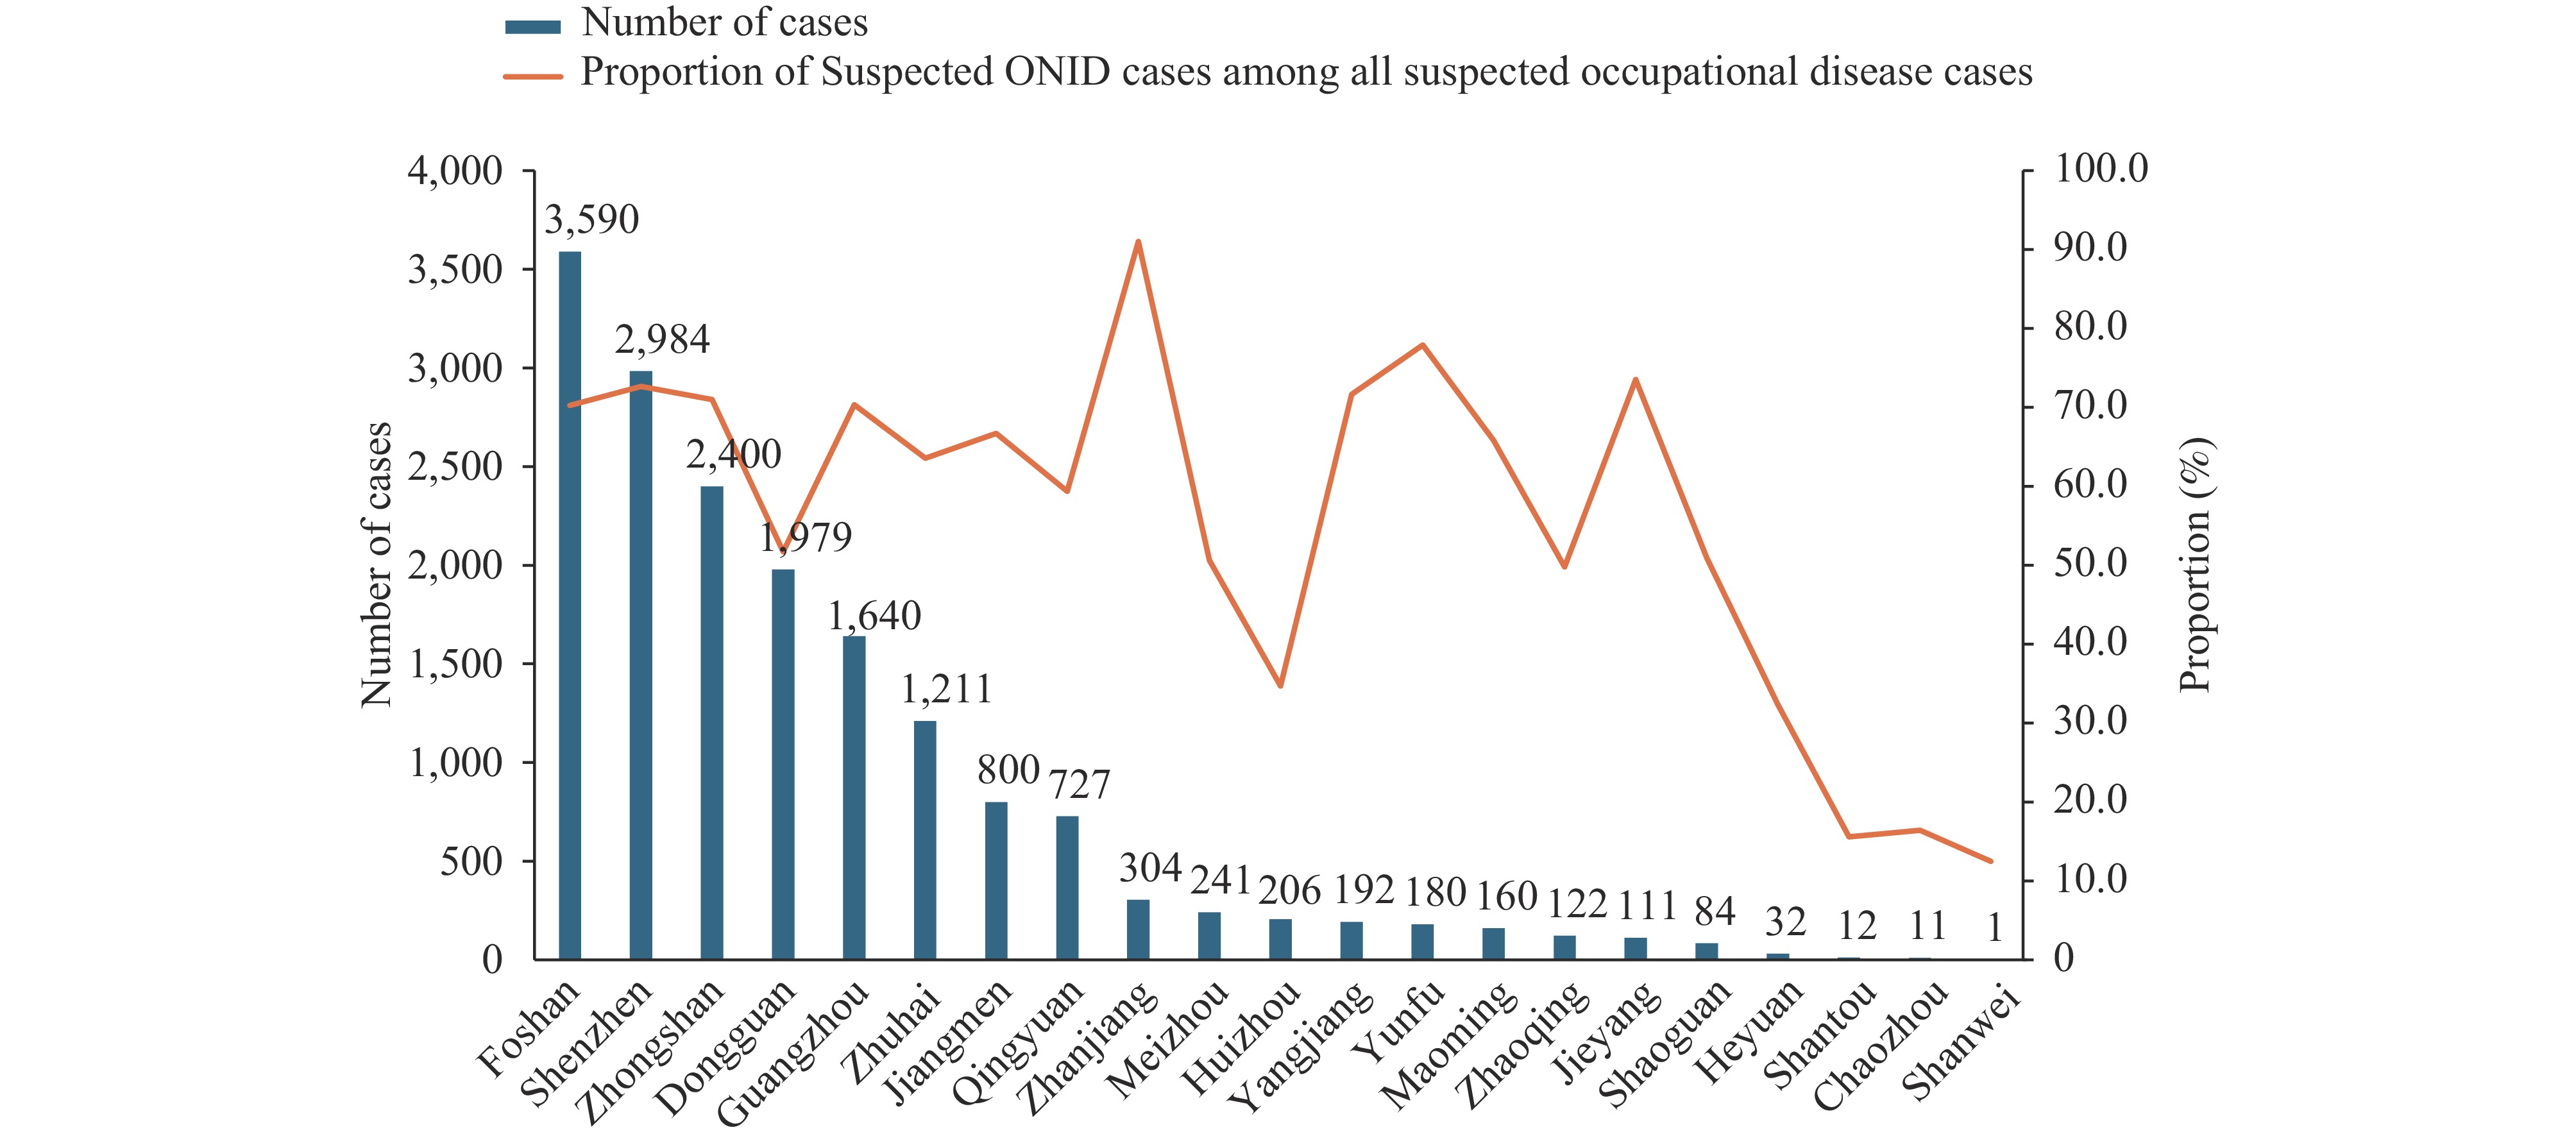 Figure 1.
Geographic distribution and proportion of suspected occupational noise-induced deafness cases in Guangdong Province, China, 2014–2023.
Abbreviation: ONID=occupational noise-induced deafness.The temporal trends of suspected ONID cases from 2014 to 2023 are illustrated in Figure 2. Despite fluctuations in absolute numbers, with a peak of 3,057 cases in 2018 followed by a decline to 1,215 cases in 2023, ONID maintained its position as the predominant suspected occupational disease. The proportion of ONID cases increased from 41.05% in 2014 to 70.62% in 2018, and stabilizing between 2019 and 2023. Throughout the decade, suspected ONID cases (16,987) represented 65.22% of all suspected occupational disease cases (26,044).
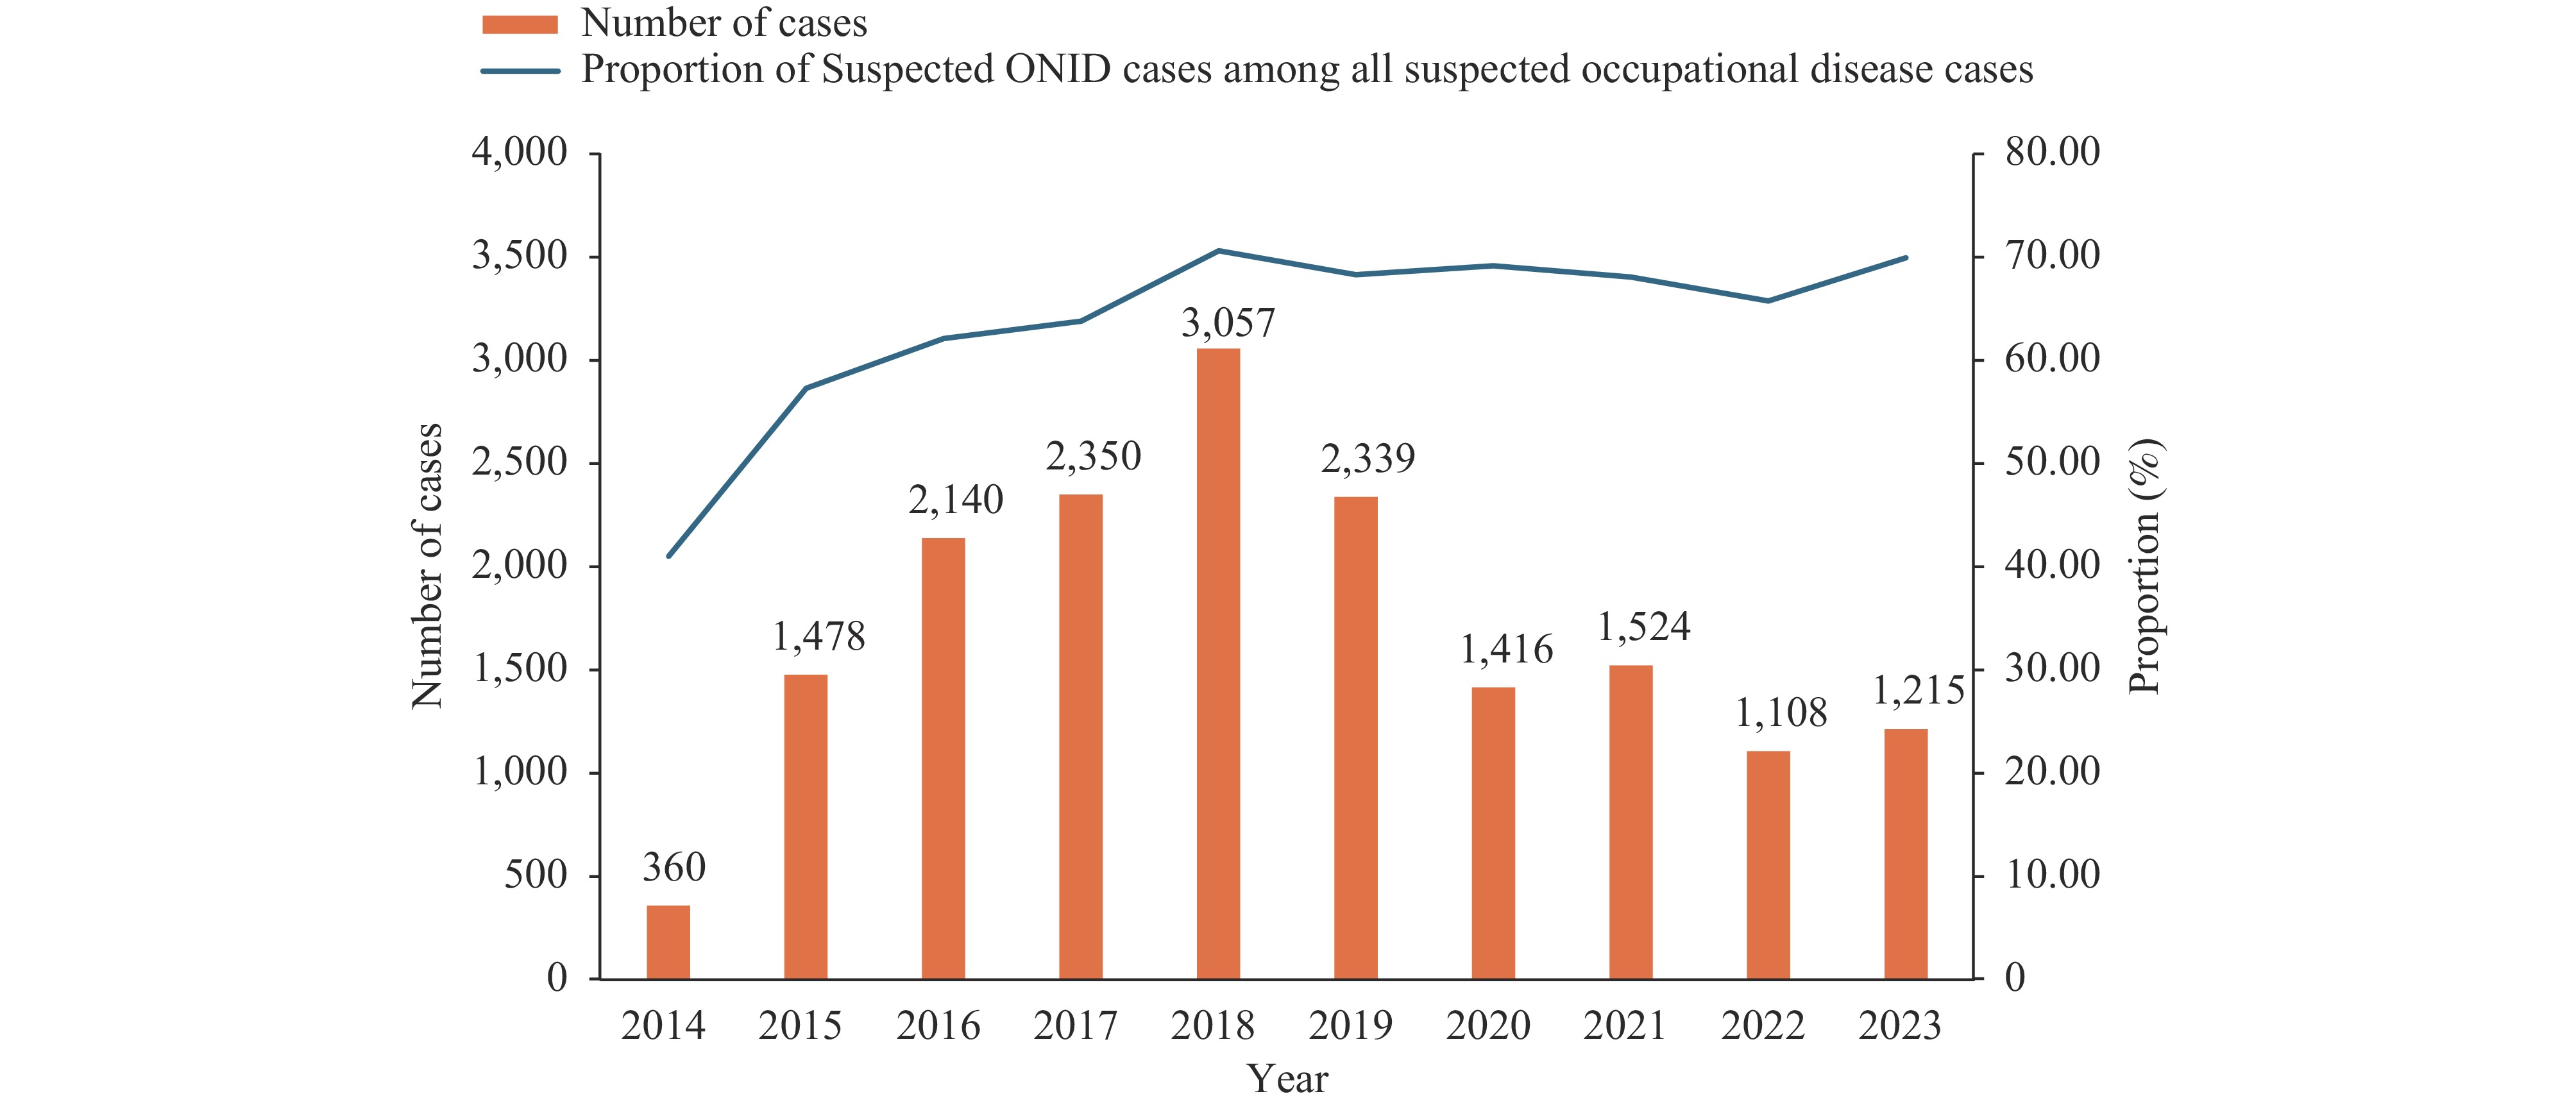 Figure 2.
Temporal trends and proportional distribution of suspected occupational noise-induced deafness cases in Guangdong Province, China, 2014–2023.
Abbreviation: ONID=occupational noise-induced deafness.Table 1 presents the characteristics and AAPC of suspected ONID cases. The manufacturing sector dominated suspected ONID cases, accounting for 90.1% (15,298/16,987) of all reports. Within manufacturing, the metal products industry reported the highest proportion (2,327; 15.2%), followed by non-metallic mineral products (1,416; 9.3%) and electrical machinery and equipment manufacturing (1,314; 8.6%). Domestic-fund enterprises reported 62.1% (10,551/16,987) of cases, demonstrating a significant AAPC of 15.9% (95% CI: 4.5%–29.4%, P=0.014). Demographic analysis revealed that males comprised 87.7% (14,905/16,987) of cases, with the 40–50 years age group representing 45.2% (7,679/16,987). Cases with <3 years of exposure initially increased from 197 in 2014 to 1,494 in 2018, followed by a marked decline to 33 in 2023 (APC: −52.96%, P<0.001 for 2017–2023).
Characteristics Total 2014 2015 2016 2017 2018 2019 2020 2021 2022 2023 AAPC (95% CI) Industry Manufacturing 15,298
(90.1)329
(91.4)1,319
(89.2)1,901
(88.8)2,116
(90.0)2,697
(88.2)2,121
(90.7)1,297
(91.6)1,376
(90.3)1,032
(93.1)1,110
(91.4)11.9*
(3.9, 21.5)Non-Manufacturing 1689
(9.9)31
(8.6)159
(10.8)239
(11.2)234
(10.0)360
(11.8)218
(9.3)119
(8.4)148
(9.7)76
(6.9)105
(8.6)10.1
(−3.9, 26.9)Registration type† Domestic-funded enterprises 10,551
(62.1)176
(48.9)829
(56.1)1,205
(56.3)1,411
(60.0)2,004
(65.7)1,444
(61.7)877
(61.9)1,041
(68.3)718
(64.8)846
(69.7)15.9*
(4.5, 29.4)Hongkong, Macau and Taiwan-funded enterprises 3,617
(21.3)96
(26.7)339
(22.9)503
(23.5)489
(20.8)568
(18.6)564
(24.1)333
(23.5)283
(18.6)216
(19.5)226
(18.6)8.1*
(1.4, 15.7)Foreign-funded enterprises 2,811
(16.5)88
(24.4)310
(21.0)432
(20.2)450
(19.1)478
(15.7)331
(14.2)206
(14.5)200
(13.1)174
(15.7)142
(11.7)3.7
(−2.2, 10.4)Scale† Large 2,891
(17.0)82
(22.8)326
(22.1)459
(21.4)440
(18.7)460
(15.1)341
(14.6)308
(21.8)207
(13.6)156
(14.1)112
(9.2)3.5
(−3.5, 12.9)Medium 5,066
(29.8)134
(37.2)508
(34.4)721
(33.7)688
(29.3)828
(27.1)748
(32.0)348
(24.6)432
(28.3)313
(28.2)346
(28.5)7.8
(−2.7, 19.9)Small 7,467
(44.0)99
(27.5)493
(33.4)770
(36.0)983
(41.8)1,509
(49.5)1,090
(46.6)649
(45.8)707
(46.4)550
(49.6)617
(50.8)19.9*
(10.1, 30.7)Micro and unknown 1,555
(9.2)45
(12.5)151
(10.2)190
(8.9)239
(10.2)253
(8.3)160
(6.8)111
(7.8)178
(11.7)89
(8.0)139
(11.4)8.7
(−12.5, 27.6)Gender Male 14,905
(87.7)297
(82.5)1,283
(86.8)1,843
(86.1)2,038
(86.7)2,701
(88.4)2,029
(86.7)1,265
(89.3)1,349
(88.5)1,002
(90.4)1,098
(90.4)12.8*
(4.4, 22.6)Female 2,082
(12.3)63
(17.5)195
(13.2)297
(13.9)312
(13.3)356
(11.6)310
(13.3)151
(10.7)175
(11.5)106
(9.6)117
(9.6)5.4
(−6.2, 19.1)Age (year) <30 1,375
(8.1)67
(18.6)172
(11.6)236
(11.0)243
(10.3)261
(8.5)176
(7.5)69
(4.9)80
(5.2)33
(3.0)38
(3.1)−10.7*
(−16.9, −4.3)30–39 4,192
(24.7)116
(32.2)469
(31.7)578
(27.0)629
(26.8)769
(25.2)553
(23.6)318
(22.5)357
(23.4)197
(17.8)206
(17.0)4.5
(−7.7, 18.3)40–49 7,679
(45.2)133
(36.9)649
(43.9)986
(46.1)1,102
(46.9)1,436
(47.0)1,111
(47.5)649
(45.8)646
(42.4)493
(44.5)474
(39.0)13.1*
(5.2, 21.4)≥50 3,741
(22.0)44
(12.2)188
(12.7)340
(15.9)376
(16.0)591
(19.3)499
(21.3)380
(26.8)441
(28.9)385
(34.7)497
(40.9)27.7*
(18.8, 39.0)Duration of occupational noise exposure
(year)<3 6,076
(35.8)197
(54.7)794
(53.7)1,122
(52.4)1,268
(54.0)1,494
(48.9)875
(37.4)144
(10.2)117
(7.7)32
(2.9)33
(2.7)−23.3*
(−37.4, −4.4)3–5 3,682
(21.7)49
(13.6)275
(18.6)340
(15.9)378
(16.1)560
(18.3)491
(21.0)422
(29.8)471
(30.9)332
(30.0)364
(30.0)22.4*
(10.7, 36.3)6–8 2,297
(13.5)46
(12.8)147
(9.9)232
(10.8)229
(9.7)349
(11.4)321
(13.7)264
(18.6)284
(18.6)220
(19.9)205
(16.9)18.6*
(6, 32.6)≥9 4,932
(29.0)68
(18.9)262
(17.7)446
(20.8)475
(20.2)654
(21.4)652
(27.9)586
(41.4)652
(42.8)524
(47.3)613
(50.5)26.1*
(17.2, 37.8)Ownership type of identification institutions Public Institution 14,595
(85.9)360
(100.0)1,473
(99.7)2,095
(97.9)2,215
(94.3)2,702
(88.4)1,905
(81.4)1,154
(81.5)1,123
(73.7)767
(69.2)801
(65.9)6.7
(−0.9, 15.9)Private Institution 2,392
(14.1)0
(0.0)5
(0.3)45
(2.1)135
(5.7)355
(11.6)434
(18.6)262
(18.5)401
(26.3)341
(30.8)414
(34.1)107.5*
(85.4, 134)Classification of identification institutions Occupational Disease Prevention and Treatment Institution 3,187
(18.8)60
(16.7)314
(21.2)585
(27.3)560
(23.8)438
(14.3)328
(14.0)243
(17.2)263
(17.3)215
(19.4)181
(14.9)9.9*
(4.0, 15.6)CDC 4,298
(25.3)171
(47.5)664
(44.9)724
(33.8)612
(26.0)661
(21.6)618
(26.4)315
(22.2)270
(17.7)129
(11.6)134
(11.0)−4.8
(−16.2, 7.7)Hospital 8,318
(49.0)127
(35.3)467
(31.6)785
(36.7)1,082
(46.0)1,876
(61.4)1,134
(48.5)776
(54.8)812
(53.3)579
(52.3)680
(56.0)15.3*
(2.8, 30.8)Occupational Health Station 1,184
(7.0)2
(0.6)33
(2.2)46
(2.1)96
(4.1)82
(2.7)259
(11.1)82
(5.8)179
(11.7)185
(16.7)220
(18.1)61.5*
(29.3, 94.6)Certification of identification institutions OHE Institution 12,241
(72.1)250
(69.4)886
(59.9)1257
(58.7)1,618
(68.9)2,451
(80.2)1,840
(78.7)1,058
(74.7)1,139
(74.7)788
(71.1)954
(78.5)10.5
(−4.8, 28.2)Occupational Disease Diagnostic Institution 4,746
(27.9)110
(30.6)592
(40.1)883
(41.3)732
(31.1)606
(19.8)499
(21.3)358
(25.3)385
(25.3)320
(28.9)261
(21.5)6.4
(−2, 15.5)Total 16,987
(100.0)360
(100.0)1,478
(100.0)2,140
(100.0)2,350
(100.0)3,057
(100.0)2,339
(100.0)1,416
(100.0)1,524
(100.0)1,108
(100.0)1,215
(100.0)11.8*
(2.9, 22.3)Abbreviation: AAPC=Average annual percentage change
* P<0.05
† 8 cases from the industry of public administration, social security, and social organizations are not classified by registration type and scale.Table 1. Characteristics and average annual percentage change of suspected occupational noise-induced deafness cases in Guangdong Province, 2014−2023 (n, %).
Analysis of identification institution characteristics revealed a notable shift from public to private institutions. While public institutions diagnosed the majority of cases (85.9%; 14,595/16,987), private institutions showed a marked increase in case identification, reaching 34.1% by 2023 (AAPC 107.5%, 95% CI: 85.4%–134.0%, P<0.001). Hospitals identified 49.0% (8,318/16,987) of cases. The proportion of cases identified by the CDCs decreased from 47.5% to 11.0%, while outpatient health stations exhibited an increased contribution from 0.6% to 18.1% (AAPC=61.5%, 95% CI: 29.3%–94.6%, P<0.001). Occupational health examination (OHE) institutions identified 72.1% (12,247/16,987) of all cases over the entire study period.
Table 2 demonstrates the diagnostic initiation and confirmation rates for suspected ONID. Among 5,263 suspected cases, the overall diagnostic procedure initiation rate was 45.1%, with a confirmation rate of 48.9%. The initiation rate increased from 36.9% in 2020 to 55.8% in 2022 before decreasing to 47.7% in 2023. Confirmation rates fluctuated between 42.1% and 54.4%, reaching their peak in 2021. Public institutions, which identified 73.1% (3,845/5,263) of cases, demonstrated higher initiation (46.0%) and confirmation (50.7%) rates compared to private institutions (42.8% and 43.8%, respectively). While OHE institutions identified the majority of suspected cases (74.8%, 3,939/5,263), they showed lower initiation (42.5%) and confirmation (46.9%) rates than occupational disease diagnostic institutions (53.0% and 53.8%, respectively). Occupational disease prevention and treatment institutions achieved the highest initiation rate (56.4%), while CDC maintained the highest confirmation rate (54.2%). Although hospitals identified the largest proportion of cases (54.1%, 2,847/5,263), they recorded the lowest initiation (40.7%) and confirmation (46.2%) rates.
Characteristics Total of
suspected
ONIDInitiation of occupational
Disease diagnostic procedureDiagnosis of ONID No Yes Initiation rate, % No Yes Diagnostic
confirmation
rate, %Year 2020 1,416 894 522 36.9 242 280 53.6 2021 1,524 868 656 43.0 299 357 54.4 2022 1,108 490 618 55.8 358 260 42.1 2023 1,215 636 579 47.7 314 265 45.8 Ownership type of identification institutions Public Institution 3,845 2,077 1,768 46.0 872 896 50.7 Private Institution 1,418 811 607 42.8 341 266 43.8 Certification of identification institutions OHE Institution 3,939 2,266 1,673 42.5 889 784 46.9 Occupational disease diagnostic institution 1,324 622 702 53.0 324 378 53.8 Classification of identification institutions Occupational disease prevention and treatment institution 902 393 509 56.4 246 263 51.7 CDC 848 446 402 47.4 184 218 54.2 Hospital 2,847 1,688 1,159 40.7 623 536 46.2 Outpatient health station 666 361 305 45.8 160 145 47.5 Total 5,263 2,888 2,375 45.1 1,213 1,162 48.9 Abbreviation: ONID=occupational noise-induced deafness. Table 2. Suspected ONID initiation of occupational disease diagnostic procedure and diagnostic confirmation rates of ONID in Guangdong Province, 2020–2023.
-
Throughout the decade from 2014 to 2023, suspected ONID cases maintained a predominant position among occupational diseases in Guangdong Province despite experiencing a decline in absolute numbers after peaking in 2018. This pattern underscores noise as the primary occupational hazard in the region. The geographical distribution revealed that 87.9% of cases were concentrated in the Pearl River Delta, with manufacturing industries accounting for 90.1% of all suspected cases. This concentration aligns with the Pearl River Delta’s status as a globally significant manufacturing hub, which inherently concentrates on occupational noise exposure risks (10–11). The demographic analysis revealed a strong male predominance among cases, attributable to both physiological differences in auditory sensitivity and the higher proportion of males in occupational settings with elevated noise exposure (12–14). A notable temporal trend emerged in cases with exposure durations of less than 3 years, showing a sharp decline after 2018. This reduction directly resulted from a clarification issued by the National Health and Family Planning Commission in late 2017, which specified that the 3-year continuous work tenure requirement for ONID diagnosis should be calculated based on calendar days, inclusive of overtime. The institutional landscape evolved significantly during the study period, with occupational health examination institutions increasing from 140 to over 290, marked by substantial growth in private sector participation. By 2023, private institutions conducted 42.5% of occupational health examinations but identified only 34.1% of suspected ONID cases. This discrepancy suggests potential systemic issues, including insufficient technical capacity, inadequate expertise, or suboptimal quality control processes in some private institutions. Furthermore, economic considerations might influence certain private institutions to apply less stringent diagnostic standards, potentially leading to the underdiagnosis of suspected ONID cases (15).
Despite an increasing trend in diagnostic procedure initiation rates that peaked in 2022, the overall initiation rate remained low at 45.1%. This improvement reflects enhanced emphasis from health administration authorities and the implementation of the national standard GBZ/T 325-2022, which mandates employers to arrange occupational disease diagnosis within 30 days for suspected cases. However, several factors contribute to the persistently low initiation rate. First, workers with minor hearing impairments often avoid formal diagnosis, fearing that an ONID diagnosis might limit future employment opportunities. Some workers deliberately maintain their “suspected ONID” status to preserve associated benefits. A nationwide study (16) revealed that 27.9% of undiagnosed cases were attributed to worker reluctance. Second, informal compensation agreements between employers and workers frequently circumvent the formal diagnostic process. Additionally, some occupational disease identification institutions fail to properly notify workers of their suspected ONID status. Finally, insufficient regulatory enforcement regarding timely diagnostic arrangements by employers remains a significant barrier.
The confirmation rate of 48.9% for suspected ONID cases aligns with the national average of 46.79%(16). Initial screening identifies suspected cases based on specific audiometric criteria: binaural high-frequency average hearing threshold (BHFTA) ≥40 dB and a monaural threshold mean value (MTMV) ≥26 dB in the better-hearing ear. However, diagnostic confirmation follows a more stringent protocol requiring a mandatory week-long cessation of noise exposure, followed by three pure-tone audiometry tests conducted at minimum three-day intervals. The final diagnosis adheres to GBZ49-2014 standards, based on the lowest thresholds from these tests. Two primary factors contribute to the relatively low confirmation rate: hearing threshold recovery in borderline cases following noise exposure cessation, and the mandatory requirement of three years' continuous occupational noise exposure. This duration requirement can result in cases where workers exhibit diagnostic-level hearing loss but fail to receive ONID confirmation due to insufficient exposure duration.
A significant disparity in confirmation rates exists between occupational disease diagnostic institutions (53.8%) and OHE institutions (46.9%). This difference likely stems from varying diagnostic approaches: OHE physicians tend to classify cases as suspected ONID when any potential relationship between hearing loss and noise exposure exists, resulting in higher case identification but lower confirmation rates. In contrast, occupational disease diagnostic institutions adhere more rigorously to GBZ 49-2014 criteria, leading to fewer but more precisely identified suspected cases and, consequently higher confirmation rates.
This study had two primary limitations. First, the absence of comprehensive data on the total worker population exposed to occupational noise prevented the calculation of suspected ONID incidence rates. Second, the “Occupational Diseases and Health Hazard Factors Monitoring Information System” only began collecting data on occupational disease diagnostic procedures in 2020, creating a significant data gap that precluded analysis of diagnostic processes for suspected ONID cases from 2014 to 2019 and limited our understanding of long-term diagnostic trends.
In conclusion, our study revealed critical insights into the epidemiological characteristics of suspected ONID in Guangdong Province, demonstrating a persistently high occurrence pattern. Priority attention should be directed toward the Pearl River Delta region, manufacturing industries, and domestic-funded enterprises. These evidence-based findings are essential for guiding targeted and effective resource allocation in ONID prevention and control efforts. Our analysis also highlighted significant concerns, particularly the low initiation rates of diagnostic procedures and suboptimal diagnostic confirmation rates for suspected ONID cases. To address these challenges, we recommend: 1) developing expert consensus guidelines for identifying suspected ONID; 2) implementing regular quality assessments by health administrative departments; 3) strengthening the capacity and quality control measures of private occupational health examination institutions; 4) conducting comprehensive occupational health promotion activities to enhance awareness of ONID risks and the importance of early diagnosis; and 5) establishing more robust regulatory oversight of diagnostic procedure initiation for suspected ONID cases. These integrated measures are expected to enhance the overall management and prevention of ONID in Guangdong Province and potentially inform occupational health policies throughout China.
HTML
| Citation: |

|