
 Download:


-
Laboratory detection of recent human immunodeficiency virus type 1 (HIV-1) infection remains a critical challenge in HIV-1 surveillance and control efforts. Among commercially available assays, two predominant methods are the HIV-1 BED capture enzyme immunoassay (BED-CEIA) and limiting antigen avidity enzyme immunoassay (LAg-Avidity EIA) (1–2). BED-CEIA operates by measuring the progressive increase in HIV-1-specific immunoglobulin G (IgG) proportion relative to total IgG during the first two years post-seroconversion. It utilizes a branched peptide incorporating gp41 immunodominant sequences from HIV-1 subtypes B, E, and D, enabling consistent detection across various viral subtypes (1). LAg-Avidity EIA, conversely, measures the increasing antibody-antigen binding strength that develops over time following infection (2–4). This assay employs rIDR-M, a multi-subtype recombinant protein encompassing the immunodominant region (IDR) of HIV-1 (group M) gp41, which offers advantages in large-scale production (2). While BED-CEIA demonstrates superior operational stability, it exhibits a higher false recent rate (FRR) compared to LAg-Avidity EIA (5). To combine the advantageous features of both assays — namely, BED-CEIA’s operational stability and LAg-Avidity EIA’s convenient antigen preparation and lower FRR — we developed a recombinant antigen-based capture enzyme immunoassay (RAg-CEIA). This novel assay incorporates a modified HIV-1 recombinant antigen conjugated with horseradish peroxidase (HRP), replacing the branched peptide and streptavidin-labeled HRP components of BED-CEIA. The novel antigen maintains the core structure of rIDR-M from LAg-Avidity EIA but features strategic modifications: the His tag is relocated to the C-terminus, while a linker and hydrophilic Trx fusion tag are added to the N-terminus, enabling HRP labeling (6). However, further optimization is required to ensure data comparability with BED-CEIA results. This study aims to optimize RAg-CEIA and establish technical parameters for HIV-1 incidence estimation in China.
-
This study utilized 668 HIV-1 antibody-positive plasma specimens and 1 HIV-1 negative plasma specimen, categorized as follows: 1) One large-volume HIV-1 antibody-positive plasma specimen and one large-volume HIV-1 negative plasma specimen were used to prepare the calibrator (CAL), high positive control (HPC), low positive control (LPC), and negative control (NC). 2) 15 HIV-1 antibody-positive plasma specimens with known normalized optical density (ODn) values from BED-CEIA were employed for RAg-CEIA optimization. 3) 171 longitudinal plasma specimens from 51 HIV-1 seroconverting individuals were analyzed to determine the optimal ODn threshold value for recent/long-term infection classification and to calculate the mean duration of recent infection (MDRI). They comprised 81 specimens (31 individuals) from a man who have sex with men (MSM) cohort in Beijing Municipality and 90 specimens (20 individuals) from a routine HIV-1 testing cohort in Yunnan Province. Inclusion criteria specified an interval of less than 60 days between the last negative and first positive HIV-1 antibody test results, absence of acquired immune deficiency syndrome (AIDS), and no prior antiretroviral treatment (1). 4) 481 HIV-1 antibody-positive plasma specimens collected across five provinces (Beijing, Yunnan, Guizhou, Gansu, and Xizang) were used to calculate the FRR. These specimens met the criteria of non-AIDS status, no antiretroviral treatment history, and infection duration exceeding twice the MDRI (7).
-
The RAg-CEIA protocol followed previously established procedures (6). Briefly, specimen preparation involved adding 500μL of specimen diluent (3% bovine serum albumin, fraction V, in wash buffer containing 0.1% Triton X-100 in phosphate buffer solution; pH 7.2) to titer tubes arranged in an 8×12 rack. Subsequently, 5μL of NC, CAL, LPC, HPC, or test specimens were added and thoroughly mixed via pipetting. 100μL of each mixture was transferred to wells of a 96-well microplate pre-coated with goat anti-human IgG antibody. The microplate underwent incubation at 37 ℃ (±1℃) for 1 h, followed by 5 wash cycles. After adding 100μL of enzyme conjugate per well, the plate was incubated for 30 minutes at 37 ℃ (±1℃) and washed again. Color development was initiated by adding 100μL of tetramethylbenzidine (TMB) substrate, followed by 30-minute incubation at 37 ℃ (±1℃) in darkness. The reaction was terminated with 100 μL of 1 N H2SO4, and optical density (OD) measurements were taken at 450 nm with 630 nm reference wavelength. Controls and specimens were tested in triplicate or duplicate, with ODn values calculated as the ratio of median OD to median CAL OD.
-
RAg-CEIA optimization employed orthogonal experimental design to determine optimal parameters for the CAL dilution ratio and enzyme conjugate (HIV-1 recombinant antigen labeled with HRP) titer. The optimization targeted two primary objectives: 1) achieving linear correlation between RAg-CEIA and BED-CEIA ODn values for 15 HIV-1 antibody-positive specimens with BED-CEIA ODn values of 0.6-1.0, and 2) establishing a CAL OD value of approximately 0.8. The CAL, HPC, and LPC were prepared by diluting heat-inactivated HIV-1 antibody-positive plasma in heat-inactivated HIV-1 negative plasma, while the enzyme conjugate was diluted in specimen diluent.
-
ODn values were obtained from 171 longitudinal plasma specimens using optimized RAg-CEIA. A comprehensive database was established incorporating specimen background information and corresponding RAg-CEIA ODn values. The estimated days post-seroconversion were calculated using the midpoint between the last negative and first positive HIV-1 antibody test results (1). ODn values were plotted against estimated days post-seroconversion, and the optimal threshold ODn value for recent/long-term infection classification and MDRI were determined using the R package inctools (version 4.4.1; R Foundation for Statistical Computing, Vienna, Austria) (7). The FRR was calculated from 481 HIV-1 antibody-positive plasma specimens as the percentage of specimens incorrectly classified as recent infections (7).
-
The orthogonal experimental analysis revealed optimal parameters for the RAg-CEIA: a raw material dilution ratio of 1/12 for calibrator preparation and an enzyme conjugate titer of 1:1,200. Consequently, the dilution ratios for HPC and LPC preparation were established at 1/6 and 1/24, respectively. The assay demonstrated excellent operational stability, with coefficients of variation (CVs) for both OD and ODn values of CAL, LPC, and HPC consistently below 10% (Table 1).
Controls OD ODn Mean±SD CV (%) Mean±SD CV (%) NC 0.036±0.010 28.1 0.048±0.014 30.4 CAL 0.751±0.062 8.2 1 0 LPC 0.522±0.077 4.4 0.695±0.055 3.6 HPC 1.486±0.103 7.0 1.983±0.124 6.2 Abbreviation: SD=standard deviation; CV=coefficient of variation; OD=optical density; ODn=normalized optical density; NC=negative control; CAL=calibrator; LPC=low positive control; HPC=high positive control. Table 1. Mean, SD, and CV of OD and ODn values of the controls from 14 runs.
-
Analysis of ODn values, which reflect the ratio of HIV-1-specific IgG to total IgG, demonstrated a consistent temporal increase across nearly all subjects. Notable heterogeneity was observed in individual immune responses. While ODn values exhibited relatively tight clustering during early seroconversion, the distribution progressively widened over time (Figure 1).
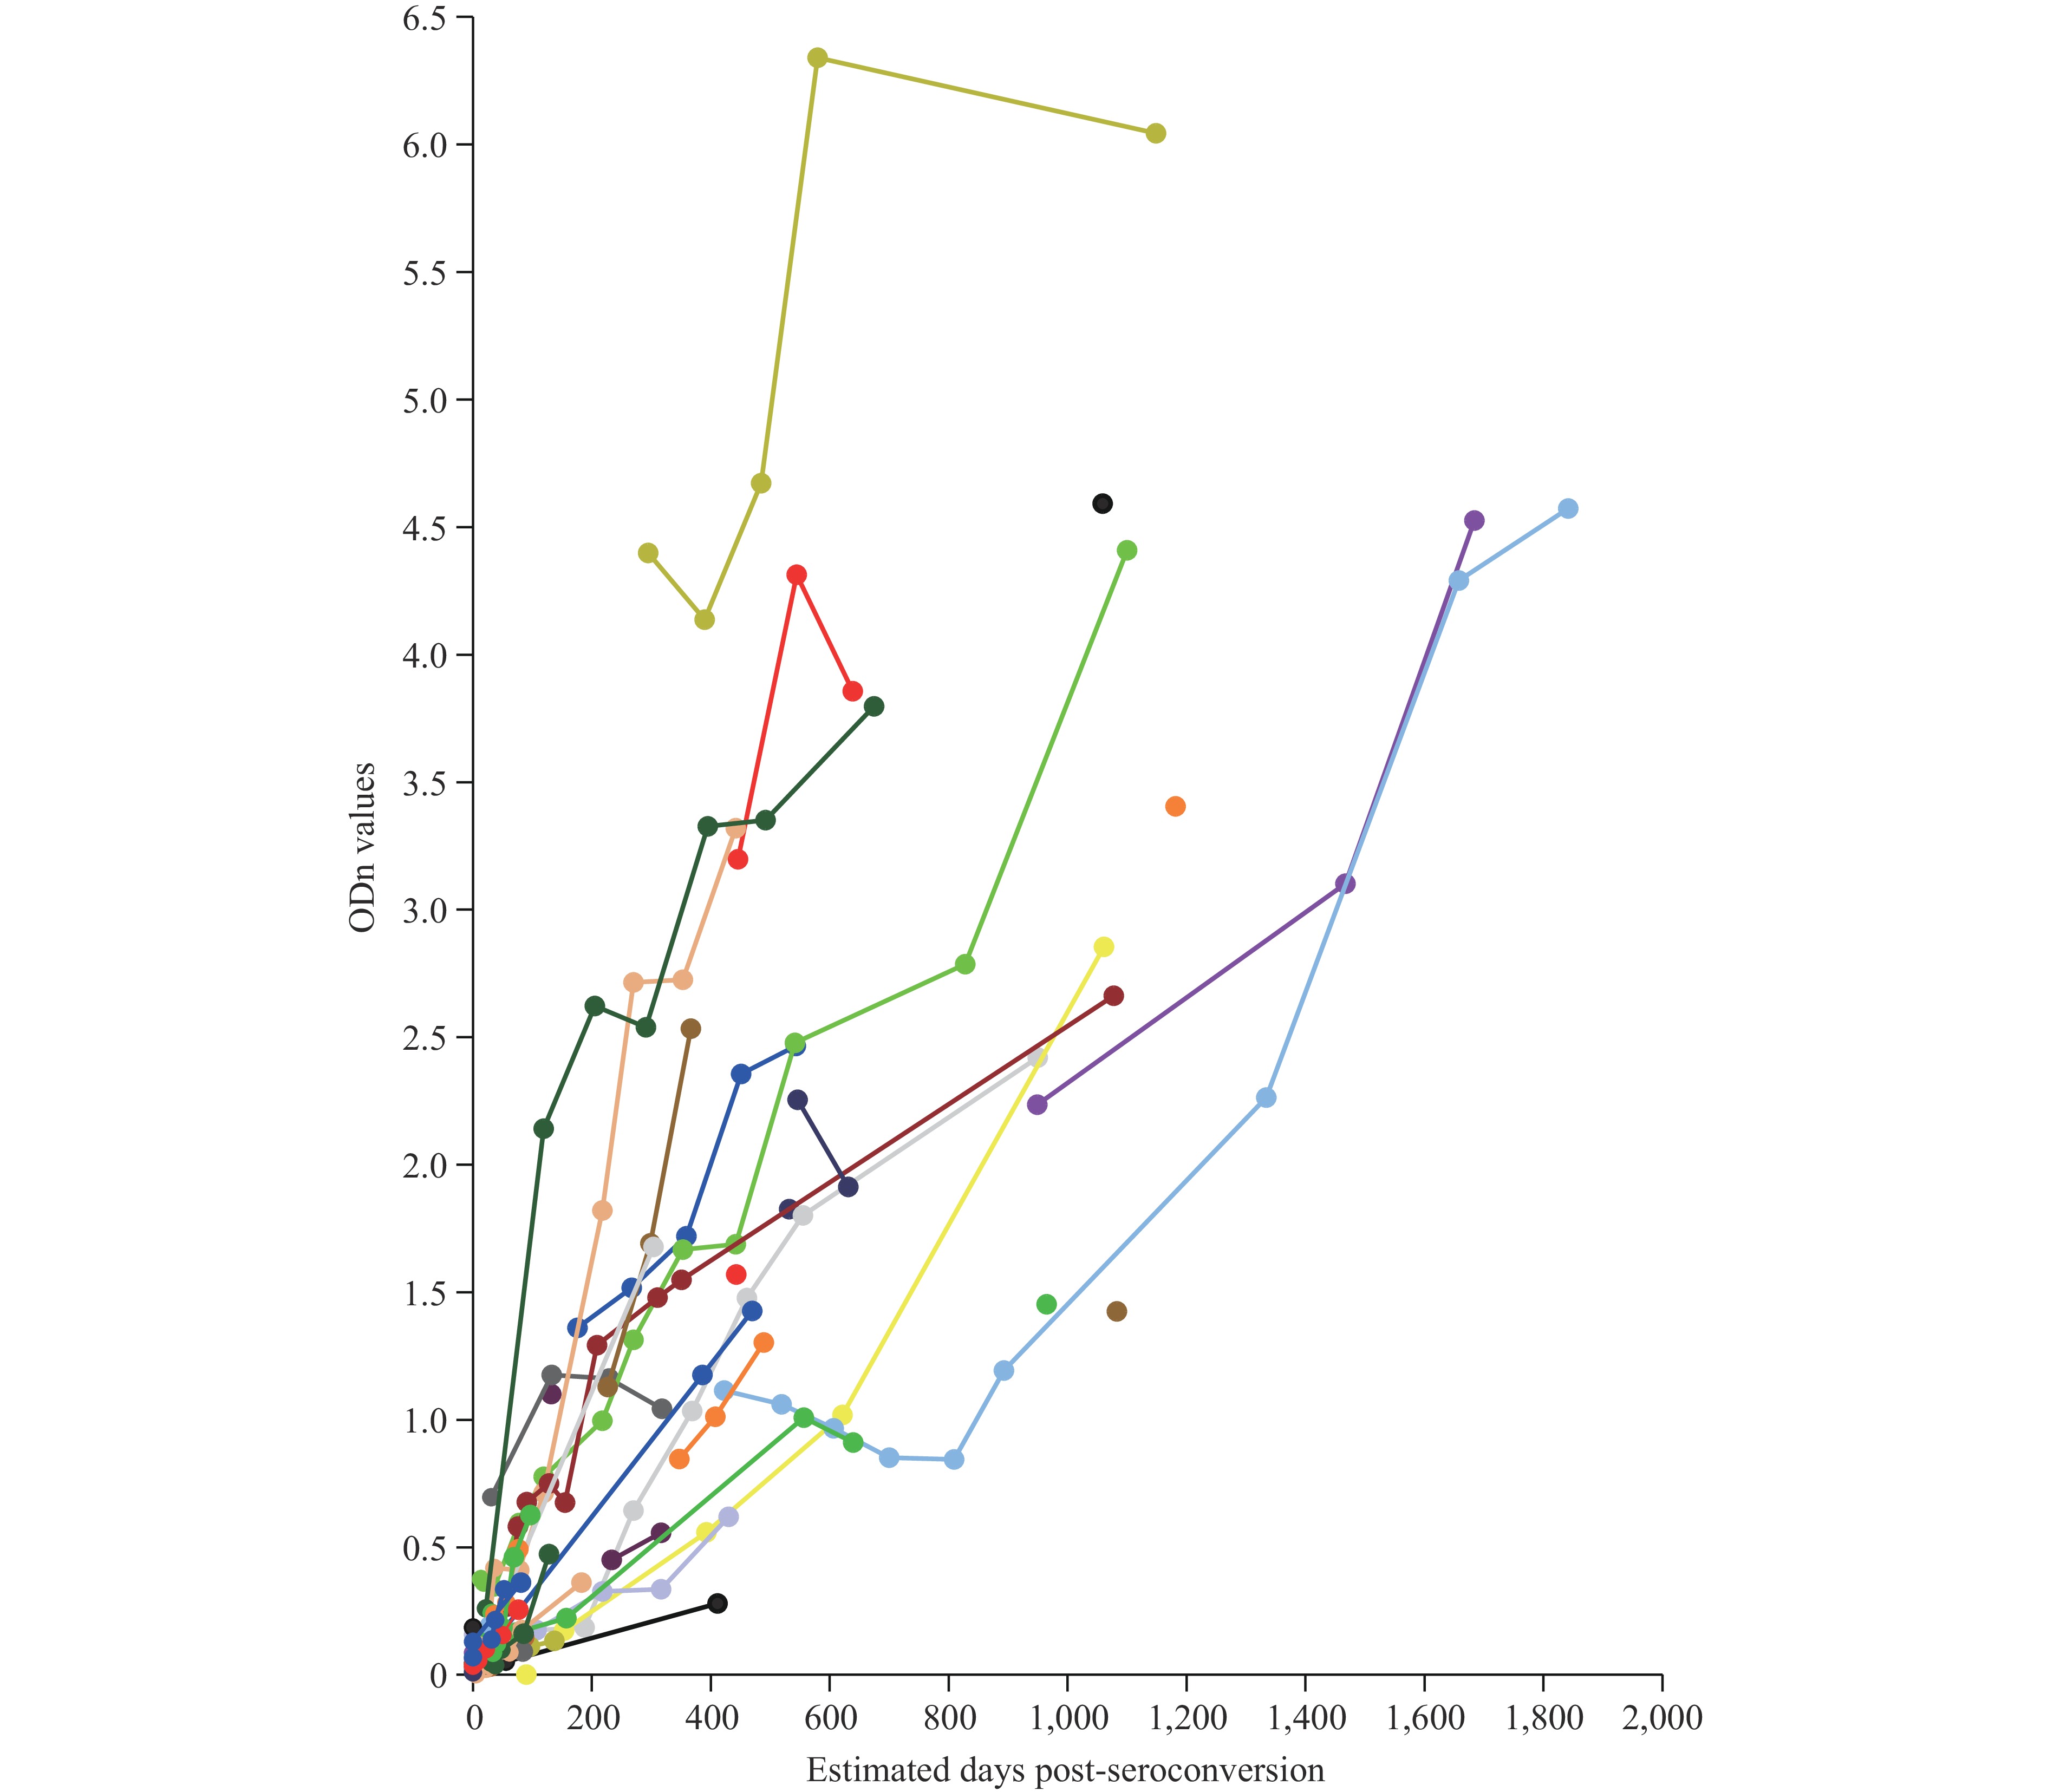 Figure 1.
ODn kinetics measured by RAg-CEIA among 51 seroconverting individuals from 2 cohorts. Each color of line and dot represents an individual with sequential specimens collected over days post-seroconversion and each dot represents a specimen. ODn values reflecting the ratio of HIV-1-specific IgG to total IgG increased in almost all individuals over time. There was heterogeneity among individual responses.
Abbreviations: ODn=normalized optical density; RAg-CEIA=recombinant antigen-based capture enzyme immunoassay; HIV-1=human immunodeficiency virus type 1; IgG=immunoglobulin G. -
Optimal sensitivity and specificity were achieved at an ODn threshold value of 0.8 for distinguishing between recent and long-term infections, corresponding to an MDRI of 205 days [95% confidence interval (CI): 176, 242 days]. Using this threshold, specimens with ODn≤0.8 were classified as recent HIV-1 infections, while those above this value were designated as long-term infections. In the analysis of 481 HIV-1 antibody-positive plasma specimens, 23 samples were misclassified as recent infections by RAg-CEIA, yielding an FRR of 4.78% (95% CI: 3.05%, 7.09%).
-
Current technological limitations and individual immunological variations constrain the utility of existing HIV-1 recent infection detection assays. These assays primarily serve to classify recent versus long-term HIV-1 infections and estimate HIV-1 incidence at the population level, rather than providing definitive individual diagnoses.
RAg-CEIA represents an innovative assay that successfully combines the superior operational stability of BED-CEIA with the advantages of LAg-Avidity EIA, namely convenient antigen preparation and reduced FRR. Our validation demonstrates excellent experimental stability, with CVs below 10% for both OD and ODn values across controls CAL, LPC and HPC. The assay achieves an MDRI of 205 days and an FRR of 4.78% for HIV-1 incidence estimation in China, showing marked improvement over the BED-CEIA’s FRR of 6.85% in Chinese populations (8). Since MDRI and FRR are crucial determinants of HIV-1 incidence estimation accuracy, and these parameters are influenced by HIV-1 subtypes and population-specific immune responses, it is essential to establish region-specific MDRI and FRR values before implementing any assay in new geographical areas (7).
International studies have documented substantial variation in MDRI values across HIV-1 subtypes for both BED-CEIA and LAg-Avidity EIA. BED-CEIA’s MDRI ranges from 127 days (Thai AE) to 236 days (subtypes AG, AD), with an overall MDRI of 197 days (95% CI: 173, 220 days). LAg-Avidity EIA shows similar variability, with MDRI values spanning 109 days (subtype A&D) to 152 days (subtype C) and an overall MDRI of 130 days (95% CI: 118, 142 days) (9–10). In China, field applications of these assays yield overall MDRIs of 168 days and 130 days, respectively (8). Our MDRI calculations for RAg-CEIA utilized specimens from both an MSM cohort in Beijing and a routine HIV-1 testing cohort in Yunnan (11–12), providing representative coverage of China’s predominant HIV-1 subtypes. The fourth national HIV molecular epidemic survey revealed that CRF07_BC (41.3%), CRF01_AE (32.7%), and CRF08_BC (11.3%) account for 85.3% of HIV-1 infections in China (13). This limited subtype diversity suggests minimal impact of genetic variability on MDRI calculations when estimating population-level HIV-1 incidence.
The limitations of this study are the relatively small specimen pool used for calculating incidence estimation parameters and only the overall MDRI is obtained. These constraints stem from China’s policy of immediate antiretroviral treatment upon HIV-1 diagnosis, which significantly restricts the availability of longitudinal plasma specimens from both seroconverting individuals and those with long-term infections.
HTML
Specimens
Experimental Process
Assay Optimization
Data Analysis
Assay Optimization and Quality Control
ODn Kinetics Measured by RAg-CEIA Among 51 Seroconverting Individuals
Technical Parameters for Estimating HIV-1 Incidence in China
| Citation: |

|