
 Download:


-
Over the past 40 years, China’s HIV epidemic has undergone significant evolution, with numerous preventive and control measures implemented to reduce HIV transmission and disease burden. The introduction of antiretroviral therapy (ART) has markedly improved survival outcomes among people living with human immunodeficiency virus/acquired immunodeficiency syndrome (HIV/AIDS, PLWHA) (1). As ART research advanced, China progressively adjusted its free ART eligibility criteria for PLWHA, modifying CD4 cell count thresholds from <200 to <350, then to ≤500 cells/µL, and finally to universal treatment regardless of CD4 count in 2004, 2008, 2014, and 2016, respectively (2).
Early survival studies of PLWHA in China primarily focused on specific high-risk populations, such as people who inject drugs and former plasma donors (3-4). With the evolution of primary transmission routes, numerous studies have examined long-term PLWHA survival in localized areas (5). However, comprehensive nationwide survival data spanning from the first reported case to present remains lacking. Understanding long-term survival patterns within China’s complex and evolving HIV epidemic context can illuminate population-level trends in survival and mortality while identifying survival disparities among PLWHA subpopulations. In this study, we analyzed data from the National HIV/AIDS Comprehensive Response Information Management System (CRIMS) to evaluate PLWHA survival from 1985 to 2022. Our findings provide crucial insights for optimizing future HIV prevention and control strategies.
-
Data were extracted from the CRIMS database, which encompasses comprehensive HIV/AIDS diagnosis, treatment, and follow-up data reported from 31 provinces in China. The study included all newly reported PLWHA in CRIMS between 1985 and 2022. After excluding 19,218 (1.1%) individuals with missing follow-up records or logical data inconsistencies, the final analysis dataset was established.
The primary outcome measure was all-cause mortality. The observation period extended from the date of HIV/AIDS diagnosis (starting point) to December 31, 2023 (endpoint). Survival time was calculated as the duration between diagnosis and either death or the follow-up endpoint. The main exposure variable was the diagnostic period cohort. Based on pivotal changes in Chinese ART standards (2), the study population was stratified into five cohorts by diagnosis year: 1985–2003, 2004–2007, 2008–2013, 2014–2015, and 2016–2022. The period from 1985 to 2003 was designated as the pre-ART era, preceding China’s implementation of free national ART in 2004. The 2016–2022 period was classified as the treat-all era, as it marked the initiation of universal ART access regardless of CD4 counts.
The analysis incorporated socio-demographic and clinical variables including sex at birth, age at diagnosis, HIV transmission route, testing venue, CD4 count at diagnosis, and ART initiation status. CD4 counts at diagnosis were stratified into four categories: <200, 200–350, 351–499, and ≥500 cells/μL. Individuals presenting with AIDS-defining illnesses within 6 months of diagnosis were classified in the “CD4<200 or AIDS” group, while those lacking CD4 test results within this period were categorized as “unknown.”
Survival trends were analyzed using Kaplan-Meier curves, stratified by diagnostic cohort and demographic factors within cohorts, including age at diagnosis, HIV transmission route, and CD4 count at diagnosis. Log-rank tests assessed between-group survival differences. Cox proportional hazard models were employed to estimate hazard ratios (HRs) and 95% confidence intervals (CIs) for evaluating the impact of diagnostic cohort, socio-demographic factors, and clinical indicators on mortality risk. To accurately assess the impact of ART policies on PLWHA survival, we conducted additional analyses on the ART-recipient subgroup using the same model framework. Statistical analyses were performed using R software (version 4.3.1, R Foundation for Statistical Computing, Vienna, Austria), with statistical significance set at P<0.05 using two-sided tests.
-
Among the 1,619,060 PLWHA included in this study, 433,420 deaths occurred by December 31, 2023. Analysis of survival rates across the 5 diagnostic cohorts revealed progressive improvements, with 1-year survival rates increasing from 85.2% to 91.1% and 5-year survival rates rising from 66.1% to 81.4%. The differences in survival rates across diagnostic cohorts were statistically significant (P<0.001) (Figure 1). Similar trends of improved survival with evolving treatment criteria were observed across age groups, HIV transmission routes, and CD4 count categories at diagnosis (Figure 2). Notably, across all diagnostic cohorts, survival rates decreased with advancing age (P<0.001). In post-2004 cohorts, individuals with homosexual transmission consistently demonstrated higher survival rates compared to other transmission routes (P<0.001). Additionally, PLWHA with higher CD4 counts at diagnosis showed significantly better survival outcomes (P<0.001).
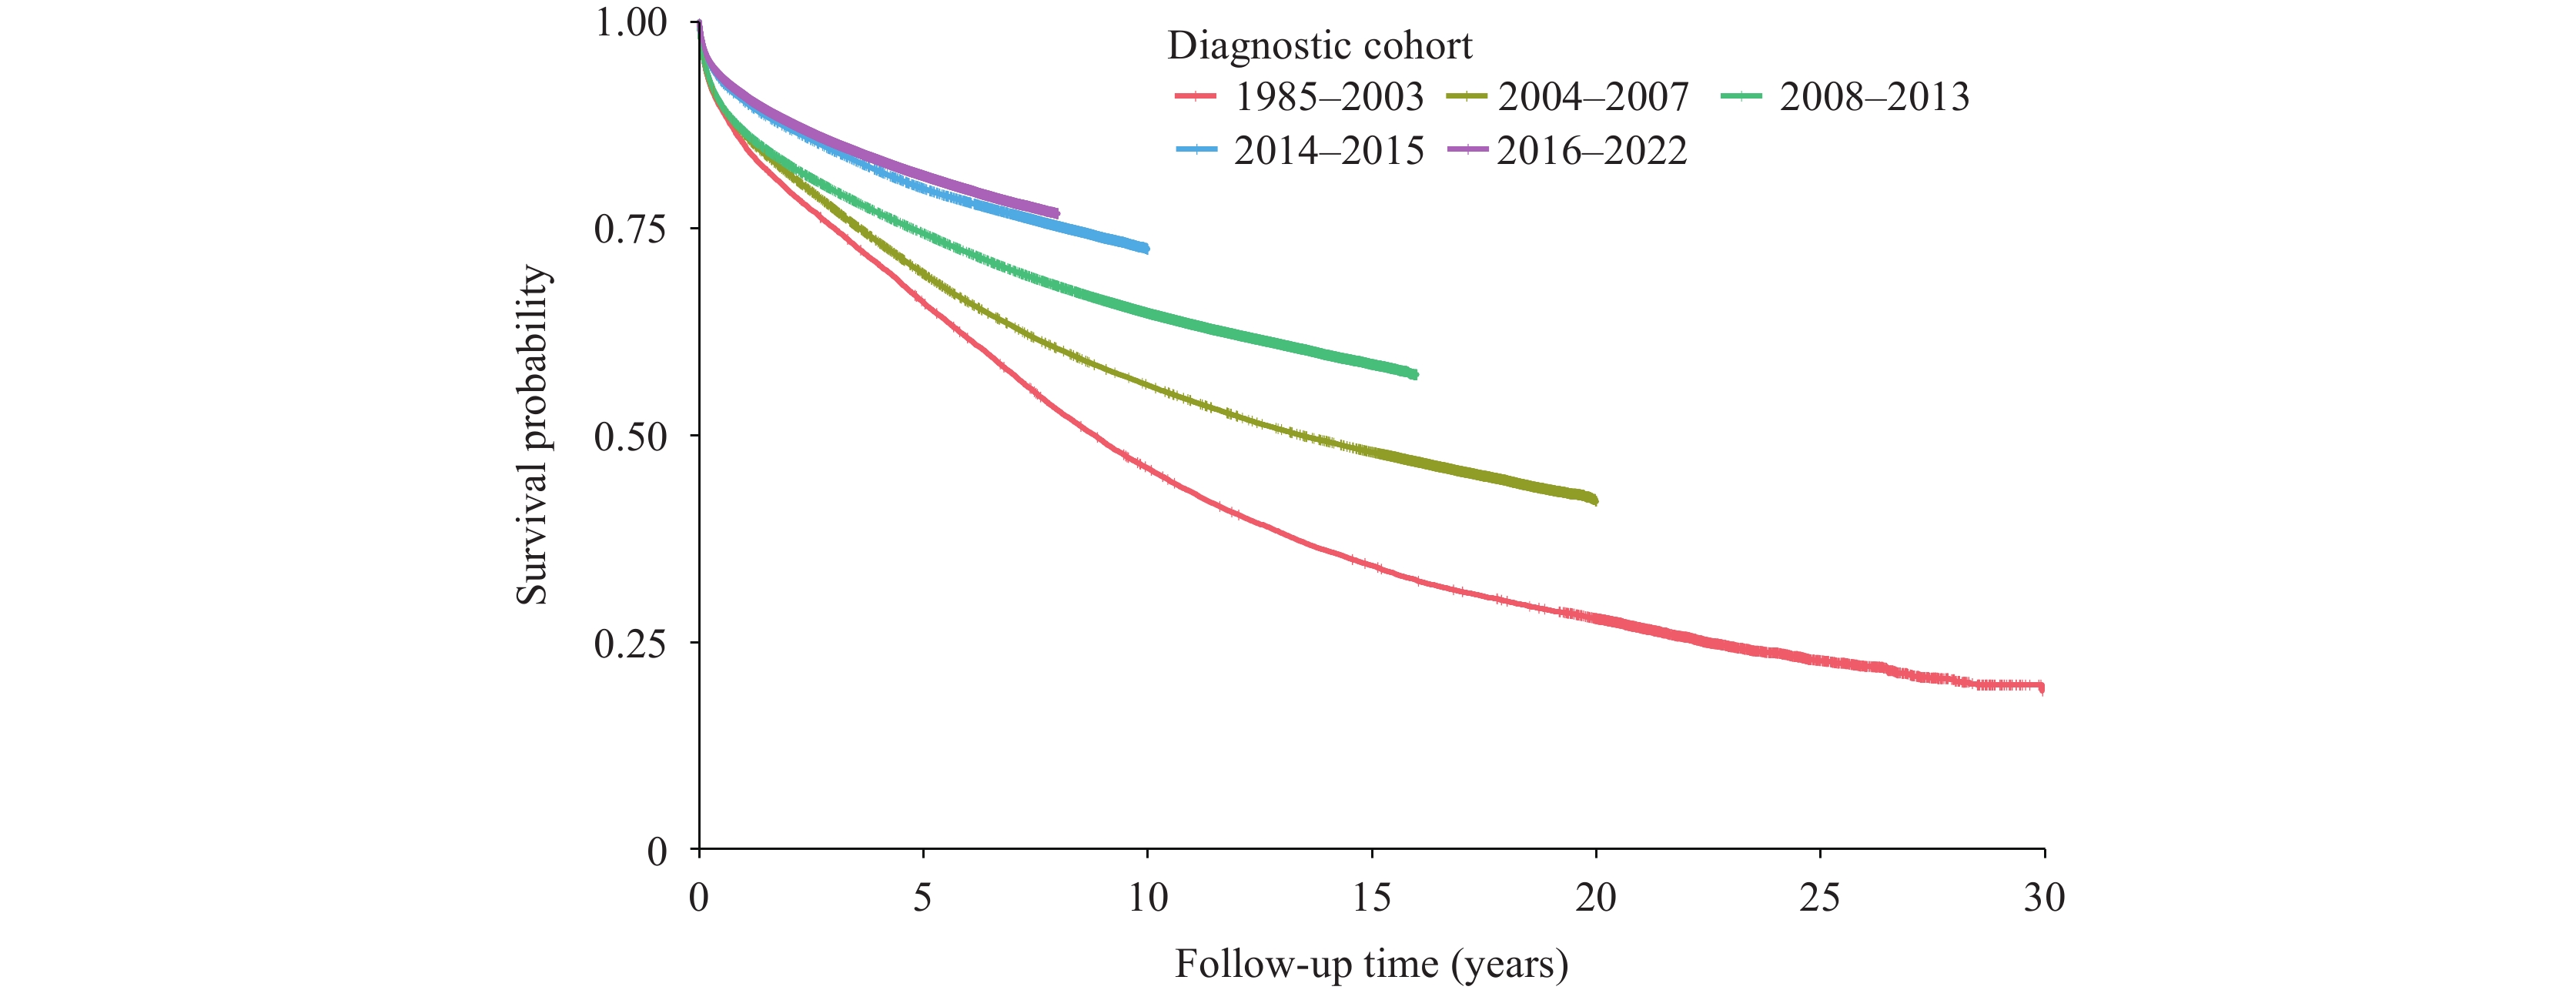 Figure 1.
Survival time since HIV diagnosis by cohort in China, 1985–2022.
Abbreviation: HIV=human immunodeficiency virus.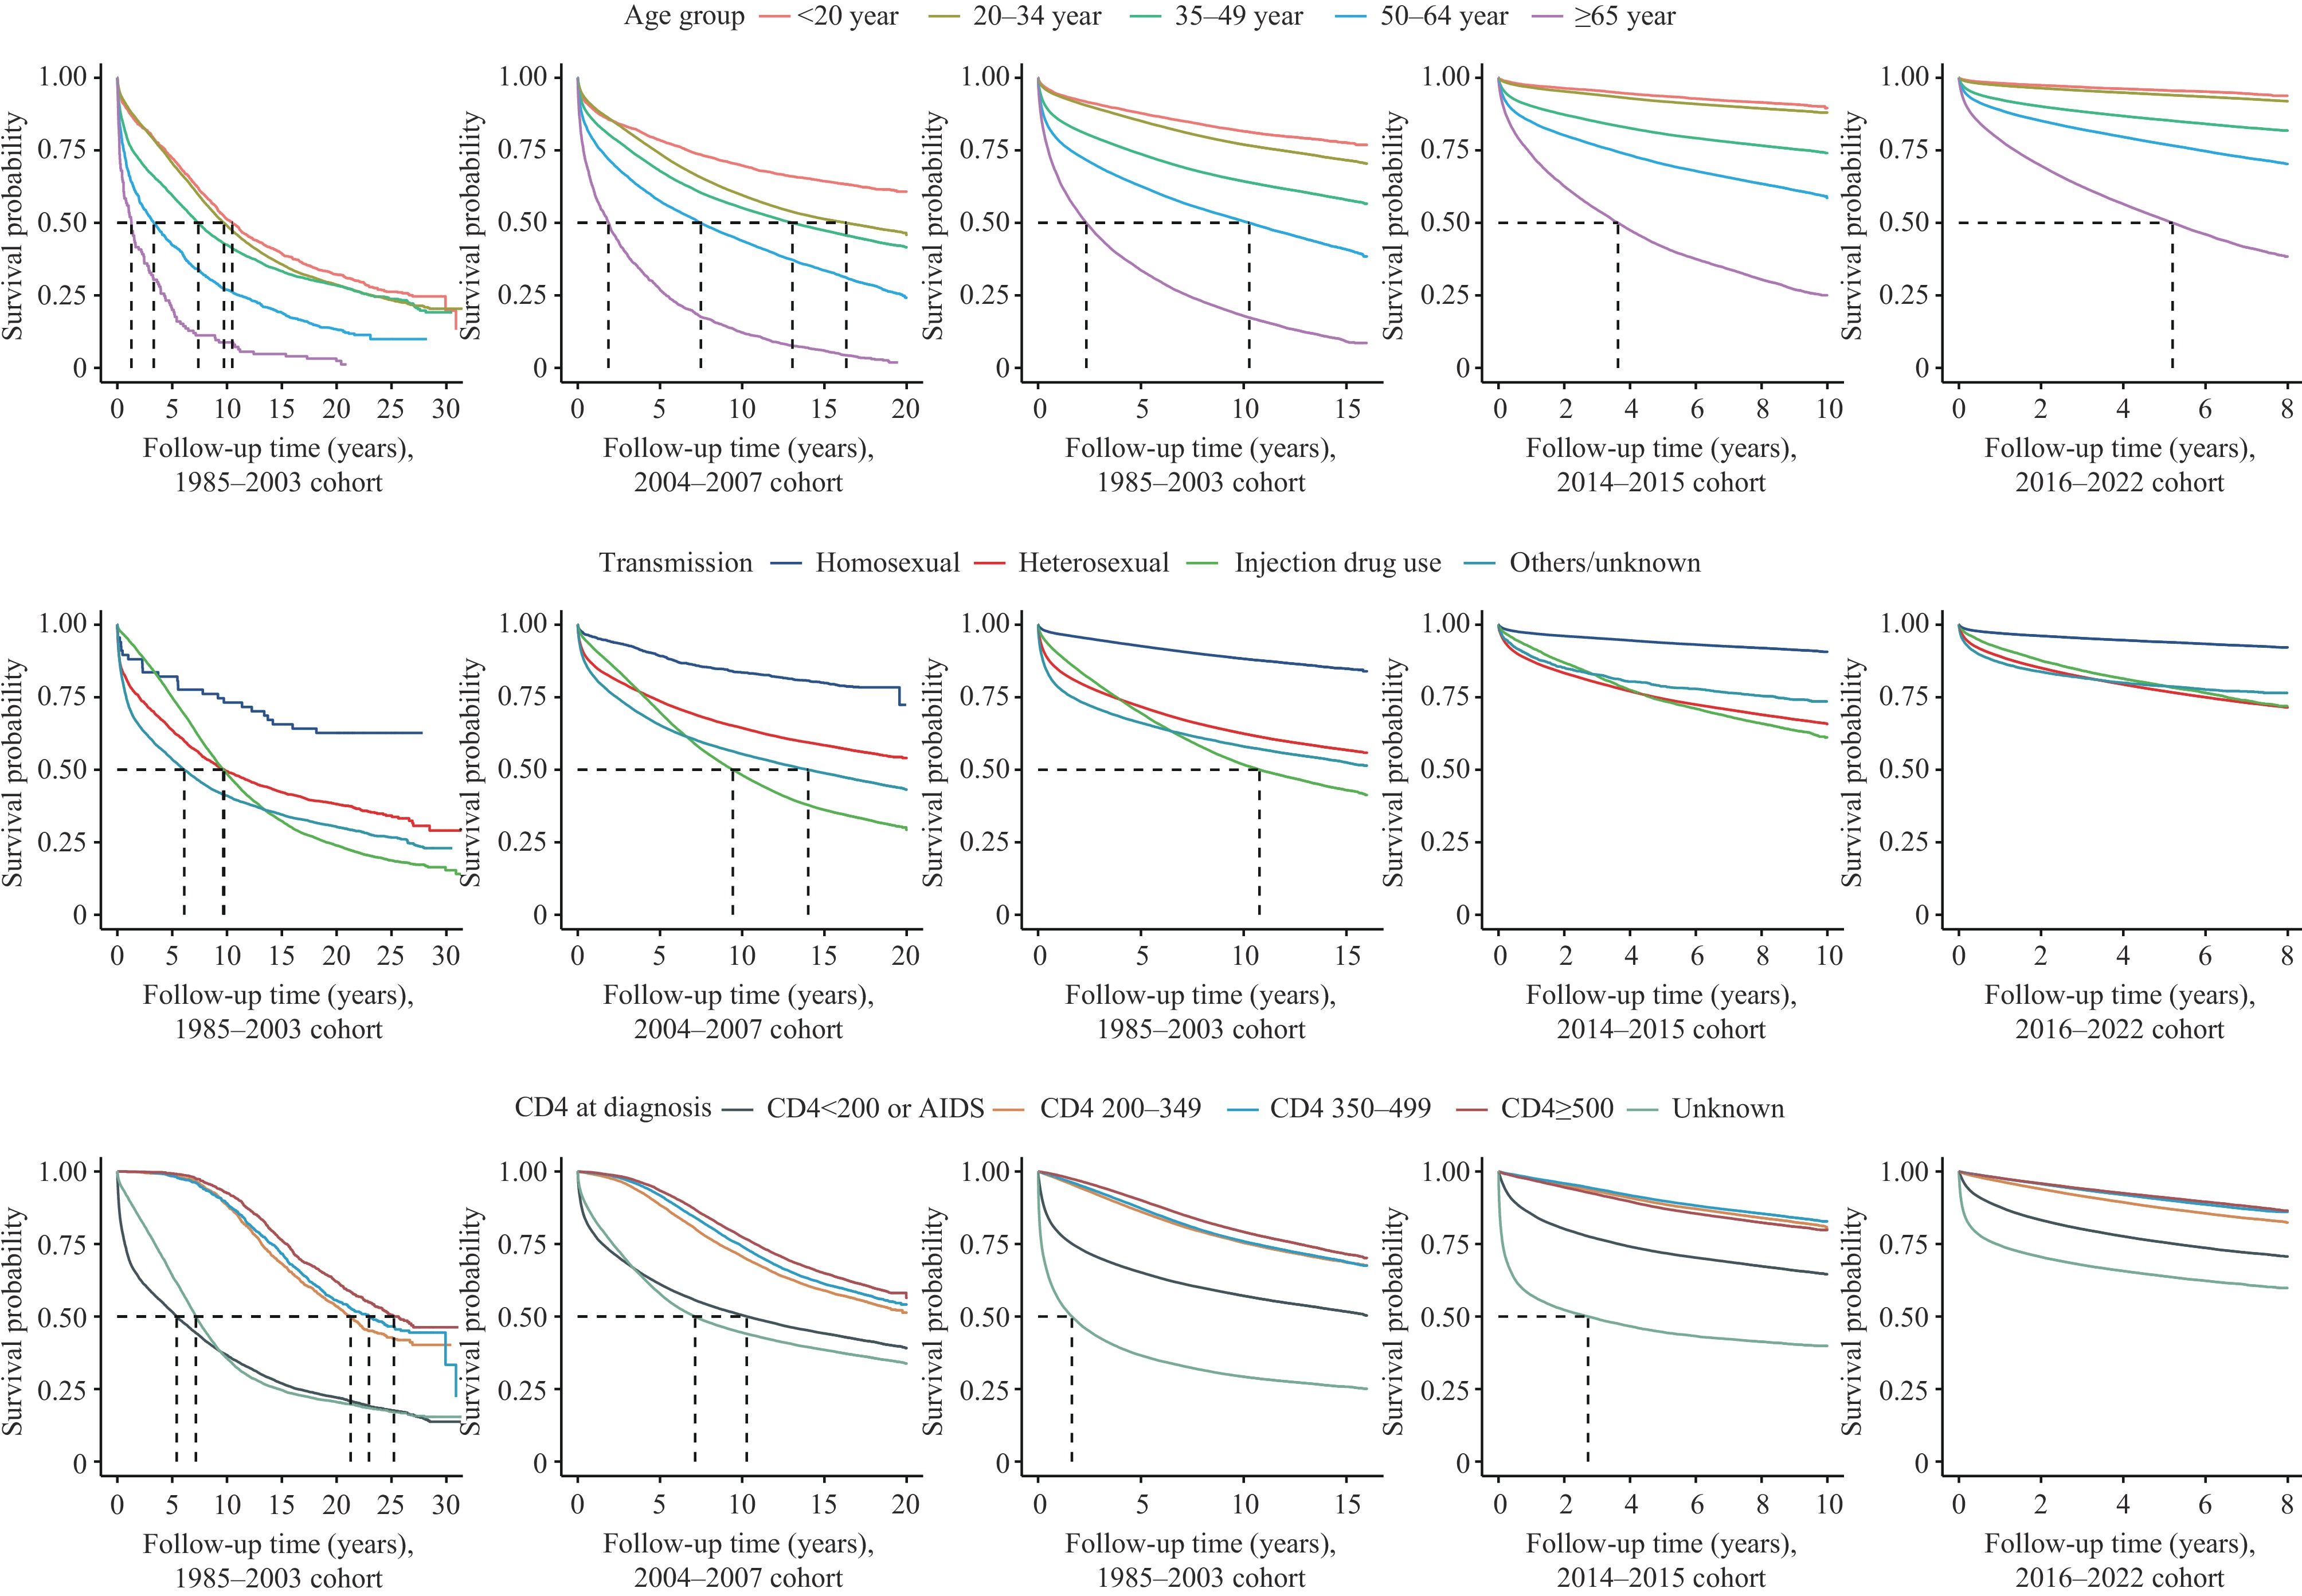 Figure 2.
Survival time by different age group, transmission and CD4 at diagnosis from pre-ART era to treat-all era in China,1985–2022.
Abbreviation: ART=antiretroviral therapy.The Cox proportional hazard model, adjusted for age at diagnosis, sex, transmission route, venue of testing, and CD4 count at diagnosis, demonstrated progressively lower mortality risks corresponding to changes in treatment criteria (Table 1). Compared to the 2016–2022 diagnostic cohort, the adjusted HRs were 1.92 (95% CI: 1.89, 1.96), 1.75 (95% CI: 1.73, 1.77), 1.73 (95% CI: 1.72, 1.75), and 1.35 (95% CI: 1.34, 1.36) for the 1985–2003, 2004–2007, 2008–2013, and 2014–2015 cohorts, respectively. Analysis of ART recipients revealed a consistent reduction in mortality risk across post-2004 diagnostic cohorts. Higher mortality risks were associated with male sex, age ≥65 years, injection drug use or other transmission routes, hospital-based testing, and lower CD4 counts or AIDS at diagnosis (P<0.05). Subgroup analyses incorporating ART initiation as an additional adjustment factor yielded similar results, with untreated PLWHA showing consistently higher mortality risks compared to those receiving ART (Table 2).
Characteristic All people People on ART Proportion(%) Adjusted HR (95% CI) Proportion (%) Adjusted HR (95% CI) Diagnostic cohort 1985–2003 1.5 1.92 (1.89, 1.96)§ 0.7 1.07 (1.03, 1.11)§ 2004–2007 7.2 1.75 (1.73, 1.77)§ 5.8 1.21 (1.18, 1.23)§ 2008–2013 22.8 1.73 (1.72, 1.75)§ 21.0 1.18 (1.17, 1.19)§ 2014–2015 12.9 1.35 (1.34, 1.36)§ 13.2 1.11 (1.10, 1.13)§ 2016–2022 55.6 Ref. 59.2 Ref. Sex Male 75.7 1.50 (1.49, 1.51)§ 74.9 1.55 (1.53, 1.56)§ Female 24.3 Ref. 25.1 Ref. Age group, years <20 3.6 0.58 (0.57, 0.60)§ 3.8 0.46 (0.44, 0.48)§ 20–34 34.5 0.69 (0.68, 0.69)§ 35.6 0.62 (0.61, 0.63)§ 35–49 29.6 Ref. 29.7 Ref. 50–64 21.1 1.63 (1.62, 1.65)§ 21.3 1.83 (1.81, 1.85)§ ≥65 11.1 3.52 (3.49, 3.56)§ 9.6 4.31 (4.26, 4.37)§ HIV transmission route Homosexual contact 21.4 0.42 (0.41, 0.42)§ 23.9 0.44 (0.43, 0.45)§ Heterosexual contact 65.6 Ref. 65.7 Ref. Injection drug use 7.8 2.09 (2.07, 2.11)§ 5.8 2.16 (2.12, 2.19)§ Others/unknown 5.3 1.18 (1.16, 1.19)§ 4.6 1.40 (1.37, 1.42)§ CD4 at diagnosis (cells/μL) CD4<200 or AIDS 31.9 1.87 (1.85, 1.89)§ 32.3 2.11 (2.07, 2.15)§ CD4 200–349 22.4 0.99 (0.97, 1.00)† 24.6 1.22 (1.20, 1.24)§ CD4 350–499 16.8 0.99 (0.98, 1.00) 17.9 1.08 (1.06, 1.10)§ CD4 ≥500 14.4 Ref. 15.0 Ref. Unknown 14.5 3.25 (3.22, 3.29)§ 10.2 1.78 (1.75, 1.82)§ Venue of testing Hospitals 50.8 1.45 (1.44, 1.47)§ 49.7 1.28 (1.27, 1.29)§ VCT clinics 26.2 Ref. 27.7 Ref. Others 23.0 0.97 (0.96, 0.98)§ 22.6 0.97 (0.96, 0.98)§ Note: Model 1: Adjusted for age group, sex, HIV transmission route, and venue of testing. Model 2: Model 1 with additional adjustment for ART initiation.
Abbreviations: HR=hazard ratio; CI=confidence interval; ART=antiretroviral therapy; HIV=human immunodeficiency virus; VCT=voluntary counseling and testing.
* Analysis excluded 81 PLWHA with missing age data.
† P<0.05.
§ P<0.001.Table 1. Cox proportional hazards regression models for mortality risk among people living with HIV/AIDS in China, 1985–2022 (n=1,619,060).
Characteristic 1985–2003 2004–2007 2008–2013 2014–2015 2016–2022 Proportion (%) Adjusted HR
(95% CI)Proportion (%) Adjusted HR
(95% CI)Proportion (%) Adjusted HR
(95% CI)Proportion (%) Adjusted HR
(95% CI)Proportion (%) Adjusted HR
(95% CI)Sex Male 76.0 1.08
(1.03, 1.12)§67.0 1.34
(1.31, 1.36)§71.8 1.29
(1.27, 1.31)§77.9 1.29
(1.27, 1.32)§77.9 1.45
(1.43, 1.47)§Female 24.0 Ref. 33.0 Ref. 28.2 Ref. 22.1 Ref. 22.1 Ref. Age group, years <20 6.2 0.65
(0.61, 0.70)§4.0 0.64
(0.61, 0.67)§3.8 0.66
(0.63, 0.68)§3.9 0.54
(0.50, 0.58)§3.3 0.42
(0.40, 0.45)§20–34 62.5 0.79
(0.76, 0.82)§48.8 0.82
(0.80, 0.83)§41.1 0.73
(0.72, 0.74)§37.3 0.61
(0.59, 0.62)§28.6 0.52
(0.51, 0.53)§35–49 25.8 Ref. 36.5 Ref. 33.0 Ref. 30.6 Ref. 27.1 Ref. 50–64 5.0 1.66
(1.55, 1.77)§9.0 1.54
(1.50, 1.58)§14.8 1.55
(1.53, 1.58)§19.0 1.61
(1.58, 1.65)§26.2 1.52
(1.50, 1.54)§≥65 0.5 1.72
(1.44, 2.06)§1.8 1.76
(1.68, 1.85)§7.2 2.05
(2.01, 2.08)§9.1 2.41
(2.35, 2.47)§14.7 2.51
(2.48, 2.55)§HIV transmission route Homosexual contact 0.3 0.69
(0.46, 1.02)1.6 0.56
(0.51, 0.62)§15.8 0.49
(0.48, 0.51)§27.8 0.49
(0.48, 0.51)§25.3 0.54
(0.53, 0.55)§Heterosexual contact 11.1 Ref. 28.5 Ref. 65.0 Ref. 66.6 Ref. 71.8 Ref. Injection drug use 52.9 1.02
(0.96, 1.08)32.2 1.33
(1.30, 1.36)§13.8 1.34
(1.32, 1.36)§4.5 1.52
(1.47, 1.58)§1.7 1.50
(1.45, 1.55)§Others/unknown 35.7 1.49
(1.41, 1.57)§37.6 1.37
(1.34, 1.40)§5.4 1.14
(1.11, 1.16)§1.1 1.16
(1.06, 1.26)§1.2 1.33
(1.27, 1.39)§CD4 at diagnosis (cells/μL) CD4<200 or AIDS 35.9 3.54
(3.27, 3.83)§39.2 2.71
(2.63, 2.79)§32.6 2.56
(2.52, 2.61)§30.7 2.31
(2.25, 2.37)§30.8 2.52
(2.47, 2.58)§CD4 200–349 6.1 1.48
(1.34, 1.64)§9.4 1.40
(1.34, 1.45)§18.3 1.37
(1.34, 1.40)§22.8 1.17
(1.14, 1.21)§26.2 1.26
(1.23, 1.29)§CD4 350–499 5.7 1.24
(1.11, 1.37)†10.1 1.15
(1.10, 1.19)§19.2 1.15
(1.13, 1.17)§18.8 1.05
(1.01, 1.08)†16.5 1.04
(1.01, 1.06)†CD4 ≥500 6.6 Ref. 11.5 Ref. 18.1 Ref. 19.4 Ref. 14.1 Ref. Unknown 45.6 2.68
(2.48, 2.90)§29.9 2.21
(2.14, 2.28)§11.9 2.63
(2.58, 2.68)§8.4 2.84
(2.75, 2.92)§12.4 3.01
(2.95, 3.08)§Venue of testing Hospitals 17.4 1.15
(1.09, 1.22)§20.7 1.27
(1.24, 1.30)§44.3 1.15
(1.14, 1.17)§52.5 1.30
(1.27, 1.33)§57.9 1.42
(1.40, 1.44)§VCT clinics 11.4 Ref. 30.3 Ref. 28.6 Ref. 28.3 Ref. 24.7 Ref. Others 71.2 0.88
(0.83, 0.92)§49.1 0.88
(0.87, 0.90)§27.2 0.83
(0.82, 0.84)§19.2 0.92
(0.89, 0.95)§17.5 0.84
(0.83, 0.86)§ART initiation Treated 43.7 Ref. 68.1 Ref. 78.4 Ref. 87.5 Ref. 90.8 Ref. Untreated 56.3 10.79
(10.35, 11.24)§31.9 9.64
(9.46, 9.82)§21.6 11.77
(11.62, 11.92)§12.5 11.57
(11.34, 11.81)§9.2 12.56
(12.42, 12.70)§Note: The model was adjusted for age group, sex, HIV transmission route, venue of testing, and ART initiation. Ref. means reference.
Abbreviation: HR=hazard ratio; CI=confidence interval; ART=antiretroviral therapy; HIV=human immunodeficiency virus; VCT=voluntary counseling and testing.
* The analysis excluded 56 PLWHA with missing age data from the 1985–2003 cohort and 25 PLWHA with missing age data from the 2004–2007 cohort.
† P<0.01.
§ P<0.001.Table 2. Cox proportional hazards regression models for mortality risk of PLWHA by different diagnostic periods in China.
-
The implementation of China's national free ART policy has significantly enhanced survival outcomes among PLWHA. Survival rates markedly improved from the pre-2003 period (1-year: 85.2%; 5-year: 66.1%) to the post-2016 era (1-year: 91.1%; 5-year: 81.4%). These outcomes position China's survival rates above those reported in Thailand (2014–2018: 1-year: 88.2%; 5-year: 75.1%) (6), though below those achieved in the Republic of Korea (2014–2018: 1-year: 96.8%; 5-year: 93.4%) (7) and Japan, where 10-year survival rates increased from 65.0% in the pre-ART era to 96.0% for those diagnosed after 2008 (8). These international variations likely reflect differences in healthcare infrastructure, socioeconomic conditions, and patient demographics. Notably, the near-universal ART coverage in Japanese and the Republic of Korean studies may explain their superior outcomes. Our findings align with U.S. data, showing that mortality risk during follow-up was approximately twice as high for individuals diagnosed in the pre-ART era compared to the treat-all era (9).
The enhanced survival of PLWHA can be partially attributed to the declining proportion of untreated individuals. Our analysis revealed substantially higher mortality risks among untreated populations compared to those receiving ART across all diagnostic cohorts. The proportion of untreated individuals decreased markedly from 56.3% to 9.2% as ART initiation criteria were relaxed. Furthermore, survival improvements were observed even among those receiving ART, likely due to earlier treatment initiation following the adjustment of ART eligibility criteria.
The mortality risk for PLWHA diagnosed at age 65 or older was significantly higher compared to those diagnosed between ages 35–49. This disparity intensified over time, with the adjusted HR increasing from 1.72 in the 1985–2003 cohort to 2.51 in the 2016–2022 cohort. For older PLWHA receiving ART, reduced immune resilience compared to younger adults contributes to elevated mortality risk (10). Furthermore, older PLWHA face increased risks of comorbidities including hypertension, cardiovascular diseases, and malignancies (11). The convergence of HIV infection with these age-related conditions may compound disease burden. Given both the rising proportion of newly reported older PLWHA and the increased longevity of existing patients due to ART, healthcare systems must urgently develop targeted, differentiated strategies to address the unique challenges posed by an aging PLWHA population (12).
Despite expanded treatment criteria enabling earlier ART initiation at higher CD4 counts, a substantial proportion of patients still present with advanced disease. Our analysis revealed that patients with CD4 counts below 200 or AIDS-defining events had significantly higher mortality risk [adjusted HR (AHR)=1.87, 95% CI: 1.85, 1.89] compared to those with CD4 counts ≥500. Notably, 30.8% of patients in the 2016–2022 cohort presented with CD4 counts below 200 or AIDS-defining illness. Hospital-based diagnoses increased from 17.4% in the 1985–2003 cohort to 57.9% in the 2016–2022 cohort, with these patients more likely to present at advanced disease stages compared to those identified through voluntary counseling and testing (13). Late ART initiation is associated with persistent immunological dysfunction and increased mortality risk compared to early treatment (14). While rapid ART initiation and personalized clinical management can significantly reduce mortality in late presenters (15), early detection remains crucial. Although China’s expanded HIV testing strategies show promise for improving survival through earlier diagnosis, their long-term impact requires further evaluation, particularly given the ongoing challenges in providing high-quality HIV care at the primary care level.
This study was subject to several limitations. First, there was inherent survivorship bias, as only living PLWHA have the opportunity to receive ART, which may confound our assessment of ART policy impacts on survival outcomes. Second, as the data originated from a routine surveillance system, the collected information was inherently limited. Future research examining long-term survival of PLWHA would benefit from in-depth analyses of intrinsic factors such as comorbidities, social support networks, and medication adherence patterns.
In conclusion, China’s implementation of the national free ART policy has effectively improved survival outcomes among PLWHA. Moving forward, continued expansion of HIV testing strategies is crucial to reduce the proportion of late diagnoses with lower CD4 count levels. Additionally, developing differentiated and precise services for older populations will be essential to further reduce mortality risk among PLWHA.
-
All personnel involved in AIDS prevention, control, and data reporting activities.
HTML
| Citation: |

|