
 Download:


-
The productive life of society has been greatly affected since the outbreak of coronavirus disease 2019 (COVID-19) in late 2019. In November 2021, genome surveillance teams in South Africa and Botswana detected the Omicron variant on November 26, 2021 (1). Compared to previous strains, the Omicron variant has a faster transmission rate and enhanced immune escape. Several scholars have shown that novel coronaviruses are characterized by multi-wave epidemics and changes in case-fatality ratios over time (2–5). Because of the multiple disparities between countries, differences in the number of confirmed cases and deaths in outbreaks across regions are often related to social inequalities (6–7). Ribeiro KB et al. studied social inequalities in COVID-19 mortality in São Paulo and showed that significant social inequalities exist in COVID-19 mortality, with higher case-fatality ratios among Black and mestizo populations compared to White populations and higher case-fatality ratios associated with lower socioeconomic indicators such as education and income (8). Perelman J et al. retrieved data from the Sixth National Health Survey of Portugal, conducted from September 2019 to December 2019, and examined and analyzed social inequalities in eight diseases associated with COVID-19 deaths in Portugal; they showed that populations with higher education had a lower risk of hypertension, diabetes, stroke, obesity, and cardiovascular disease (9). Since the naming of the Omicron strain, several waves of outbreaks have occurred in many countries, mainly caused by the Omicron strain and its variants. We collected epidemiological data on the Omicron variant of COVID-19 in 71 countries from November 14, 2021, to June 11, 2023, to analyze the characteristics of outbreak transmission following the emergence of the Omicron strain and assess the impact of income level inequalities on the COVID-19 case-fatality ratio.
This study compiled weekly data on new confirmed COVID-19 cases and deaths for 71 countries based on daily new COVID-19 cases published by the World Health Organization (https://covid19.who.int/data). The baseline was defined as the 50th percentile of the number of non-zero new weekly cases. The start of each outbreak wave was defined as the first of 3 consecutive weeks in which the number of new cases exceeded the baseline, and the end was defined as the first of 3 consecutive weeks in which the number of new cases fell below the baseline (10). Figure 1 shows the weekly trend of new cases between November 14, 2021, and June 11, 2023, using Poland, the United States, Singapore, and India as examples.
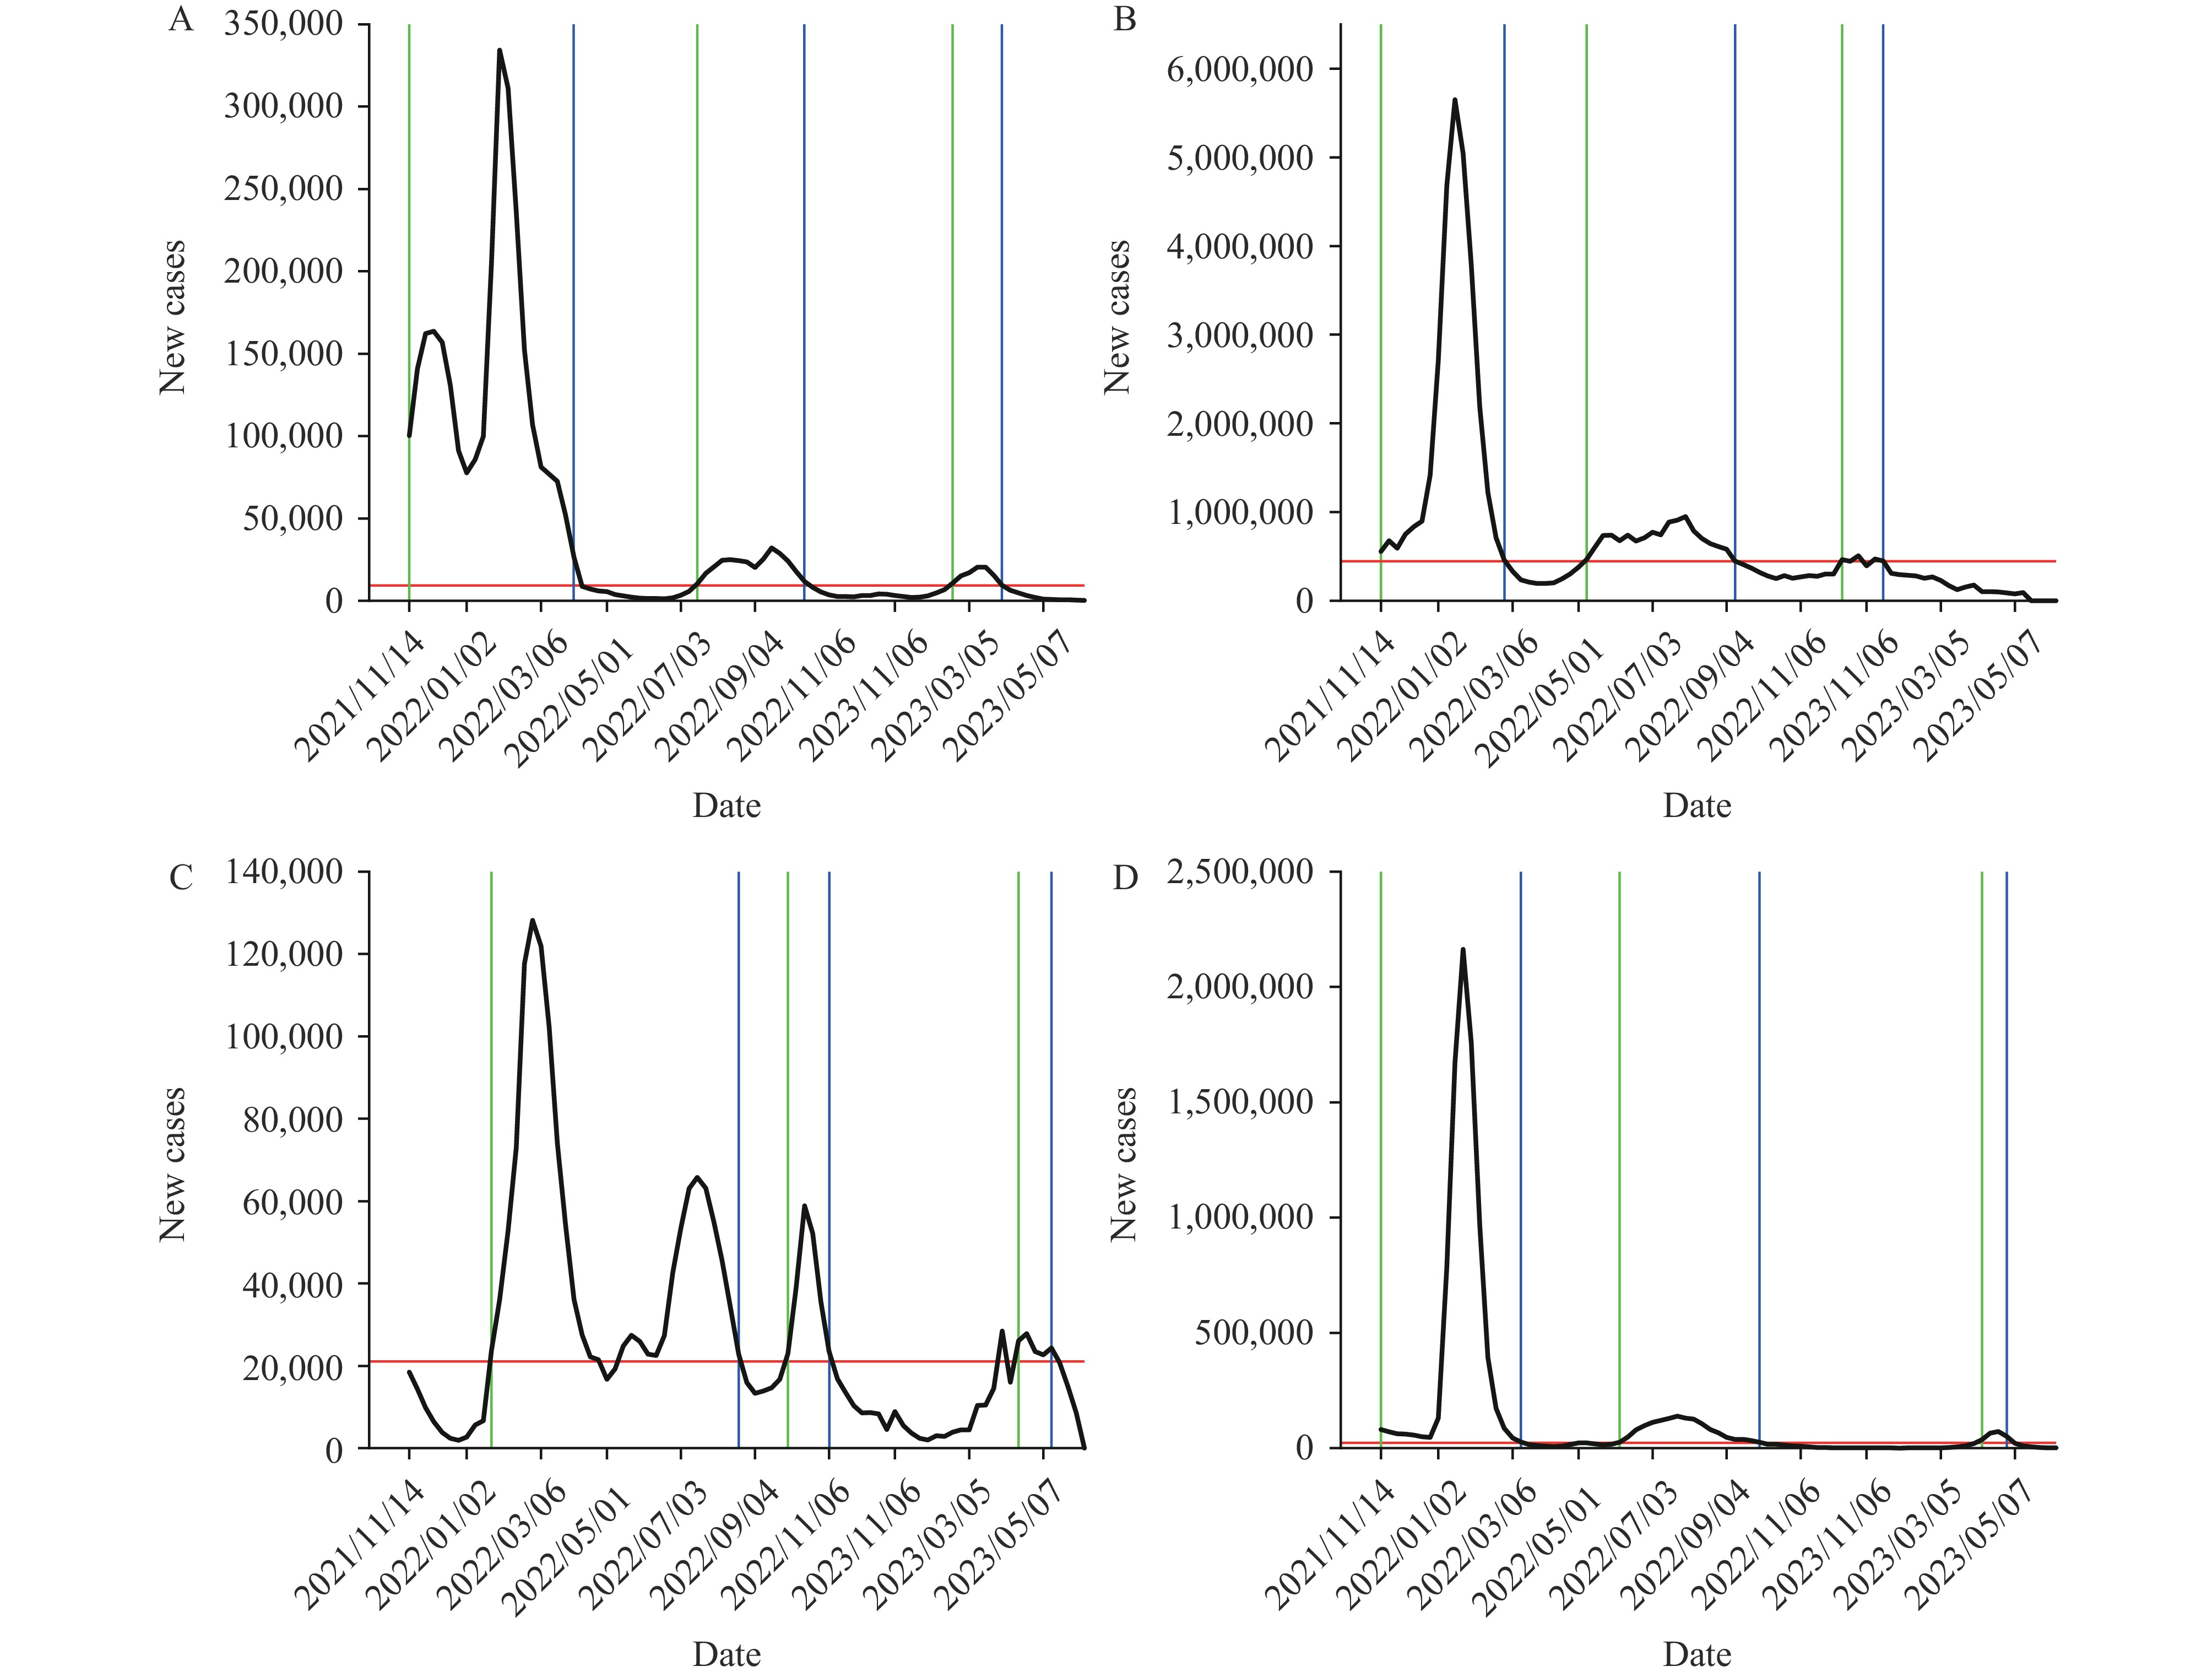 Figure 1.
Time-series plot of new cases in (A) Poland, (B) the United States, (C) Singapore, and (D) India between November 14, 2021 and June 11, 2023.
Note: The black curve is the number of new confirmed cases per week, the red horizontal line is the baseline, the green vertical line is the start time of each wave of the epidemic, and the blue vertical line is the end time of each wave of the epidemic.Based on World Bank classification criteria, the 71 countries were categorized by income level into four tiers: high-income, upper-middle-income, lower-middle-income, and low-income countries; and geographically into seven regions: South Asia, Europe and Central Asia, the Middle East and North Africa, East Asia and the Pacific, sub-Saharan Africa, North America, and Latin America and the Caribbean. The case-fatality ratio for each outbreak wave was calculated using the number of deaths divided by the number of confirmed cases during the same period. Descriptive statistics were analyzed for the time intervals between each outbreak wave. R 4.1.3 software (The R Foundation for Statistical Computing,Vienna, Austria) was used to conduct Fisher’s exact test to determine whether country income level and geographic location were related to the number of outbreak waves. The Kruskal-Wallis one-way ANOVA was used to determine whether there was a significant difference in case-fatality ratios between different outbreak classifications and to assess the effect of income inequality on the outbreak case-fatality ratio.
Of the 71 countries included in the analysis, 5 experienced one wave of outbreaks, 22 experienced two waves, and 38 experienced three waves between November 14, 2021 and June 11, 2023. Six countries, including Brunei, Austria, and Uzbekistan, experienced four waves during this period.
Based on each epidemic wave’s outbreak time and genomic surveillance data of COVID-19 from the Centers for Disease Control and Prevention, the predominant epidemiologic strains in the Omicron variant’s first wave were BA.1.1, BA.2, and BA.2.12.1. The dominant viral strains in the second wave were BA.5, and the dominant strains in the third wave were BQ.1.1 and XBB.1.5.
To obtain the time interval between low and high epidemics of the viral strains in the population, the interval between two waves of outbreaks was defined as the difference between the start time of each wave and the end time of the previous wave. The median interval between the first and second waves of Omicron subvariant outbreaks was 70 days (interquartile range: 43.75–91), and the median interval between the second and third waves was 87.5 days (interquartile range: 49–119); these intervals follow a lognormal distribution. These findings suggest that in most countries, the viral strain shows a trend of high prevalence approximately 2–4 months after the end of one wave. The distribution of the time interval between each outbreak wave is shown in Figure 2.
 Figure 2.
Distribution of outbreak intervals (A) between the first and second waves of Omicron sub-variants and (B) between the second and third waves.
Abbreviation: AIC=Akaike information criterion; BIC=Bayesian information criterion.We studied the case-fatality ratio of Omicron variants over time and calculated the case-fatality ratio of outbreaks in 38 countries with three waves of outbreaks based on available data, as shown in Figure 3. We found that among the three epidemic waves, the highest case-fatality ratio occurred during the first wave of Omicron sub-variants in 24 countries: Greece, Chile, Singapore, Mexico, Guatemala, Peru, India, Ukraine, Kenya, Madagascar, Afghanistan, Ethiopia, Mali, Burundi, Italy, Switzerland, Panama, Poland, Qatar, Armenia, Ecuador, Morocco, Myanmar, and Plurinational State of Bolivia. The highest case-fatality ratio occurred in the second wave in two countries: Malawi and the Philippines. There were 12 countries with the highest case-fatality ratio in the third wave: the United States of America, Luxembourg, the Netherlands, Slovenia, France, Colombia, Nepal, Lebanon, Mozambique, Belgium, Canada, and Indonesia. The mean case-fatality ratios for these 38 countries in the three epidemic waves were 0.006899513, 0.003806385, and 0.003993398, respectively.
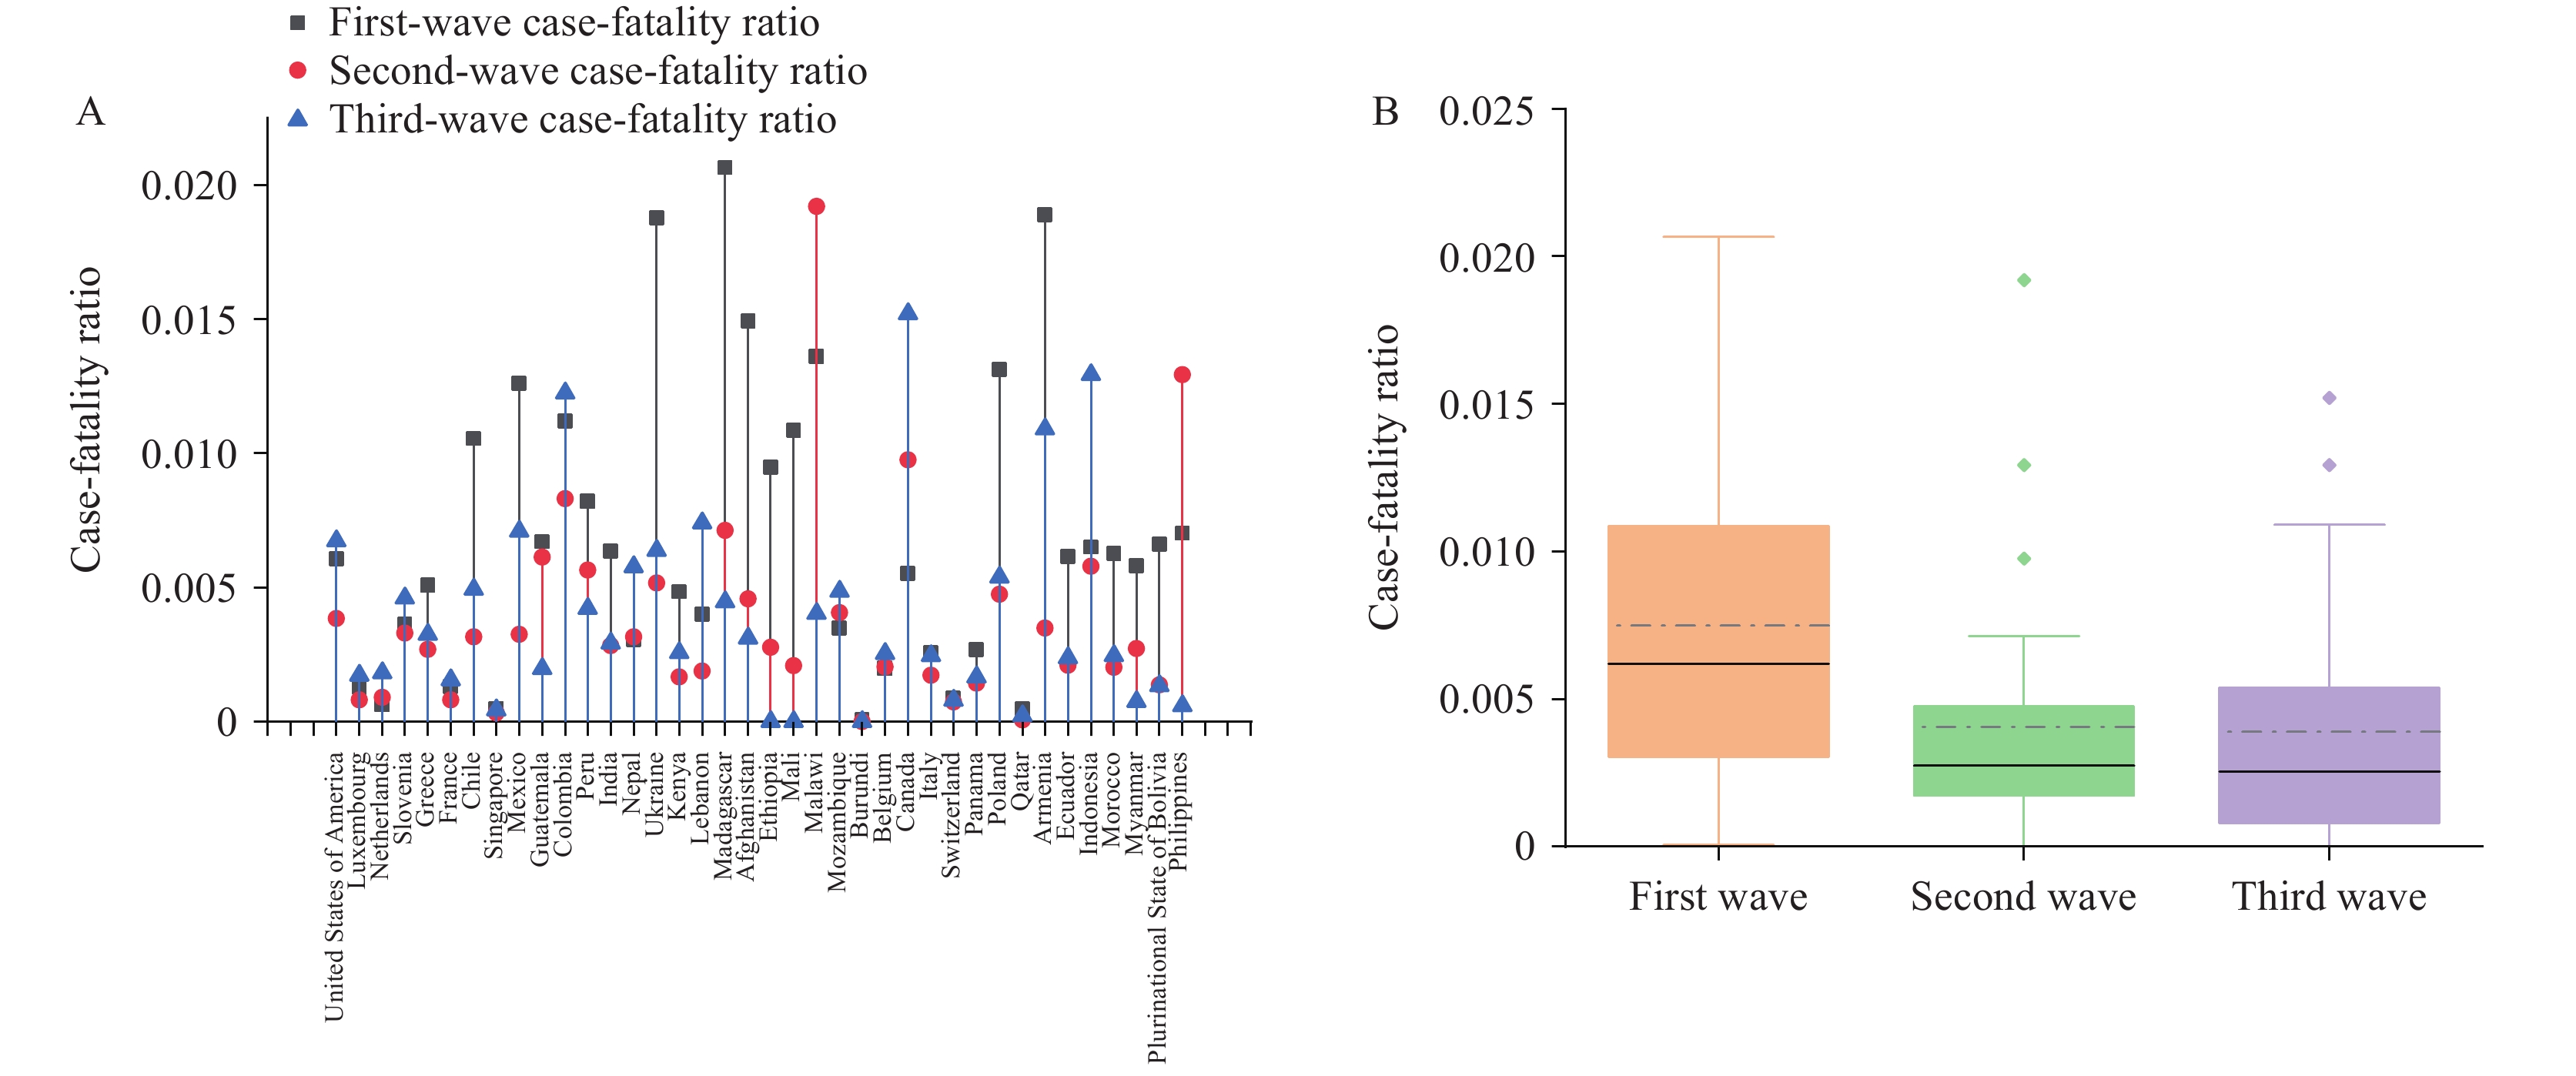 Figure 3.
Case-fatality ratio analysis of three waves of outbreaks caused by Omicron variants in 38 countries. (A) Case-fatality ratio per country; (B) Case-fatality ratio per wave of the epidemic.
Note: In panel A, the black, red, and blue lines represent the first, second, and third waves of case-fatality ratios, respectively. In panel B, the solid line represents the median case-fatality rate for each wave of the epidemic, and the dashed line represents the mean case-fatality rate for each wave of the epidemic.A Kruskal-Wallis one-way ANOVA was used to analyze differences in case-fatality ratios between epidemic waves. The resulting P value of 0.008572 was less than the 0.05 level of significance, indicating a significant difference in case-fatality ratios between the three epidemic waves. Dunn’s method was used for pairwise comparisons. Results are shown in Table 1. The P value comparing the case-fatality ratio of the first wave to the second and third waves was less than 0.05. Box plots of the case-fatality ratios for the three waves show that the Omicron variant was associated with higher lethality in the early stages of emergence. As the pandemic progressed, the lethality of the second and third waves was much lower than that of the first wave of Omicron sub-variants.
Comparison expression Z P First wave vs. second wave 2.719 0.010 First wave vs. third wave 2.622 0.013 Second wave vs. third wave −0.097 1.000 Table 1. Results of Dunn’s test for case-fatality ratio in three waves of the epidemic.
Fisher’s exact test was used to determine the correlation between a country’s income level, geographic location, and the number of outbreak waves. The resulting P values were 0.7744 and 0.9219, respectively, indicating no relationship between a country’s income level or geographic location and the number of outbreak waves. The case-fatality ratios from 71 countries experiencing the first wave of Omicron sub-variants were categorized by geographic location and analyzed using a Kruskal-Wallis one-way ANOVA. The P value of 0.2648 exceeded 0.05, indicating no significant difference in case-fatality ratios of the first Omicron sub-variant wave across regions. Figure 4A shows the case-fatality ratio levels of the first Omicron sub-variant wave according to a country’s income class when the Omicron variant first circulated, addressing income inequality between countries. The mean case-fatality ratios of the first Omicron sub-variant wave for high-income, upper-middle-income, lower-middle-income, and low-income countries were 0.003053595, 0.009750986, 0.006429692, and 0.009294815, respectively.
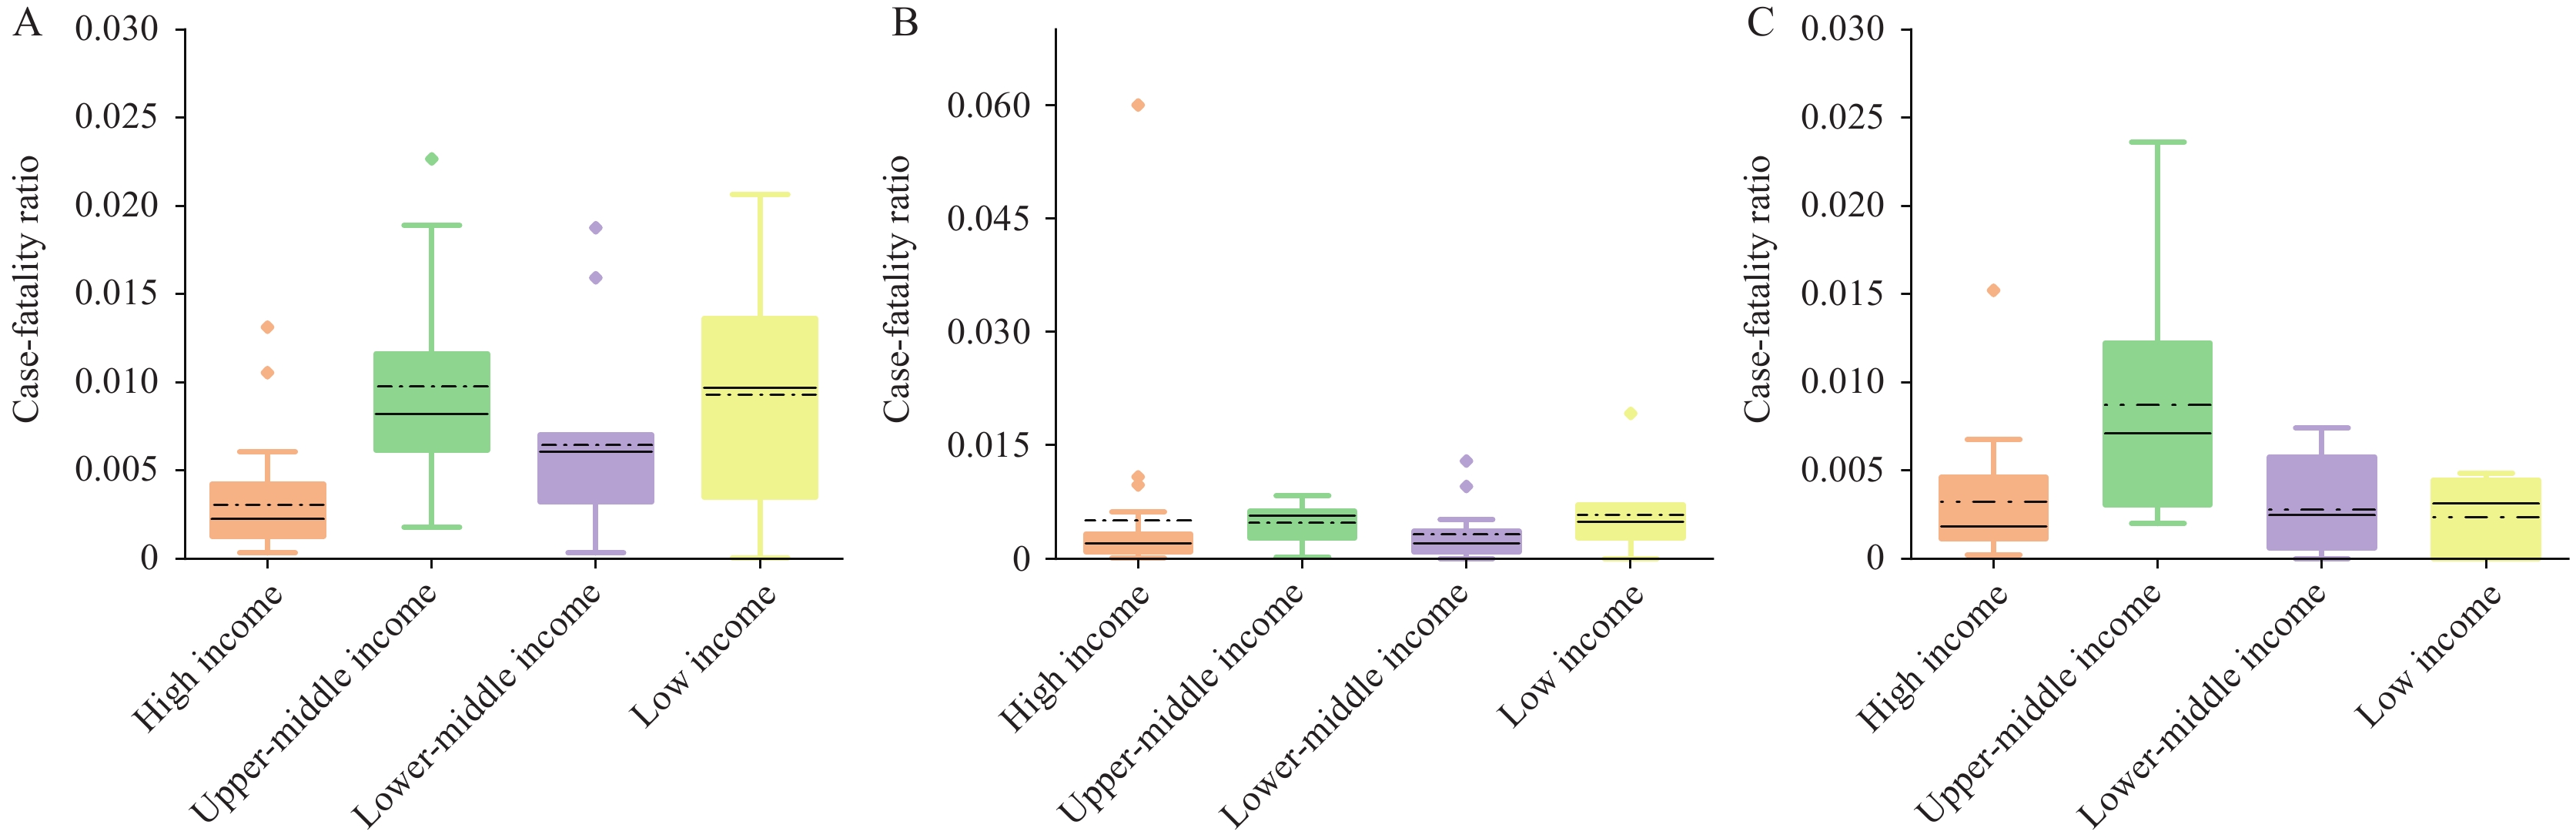 Figure 4.
Levels of case-fatality ratio of Omicron sub-variants in countries with different income levels. (A) Levels of case-fatality ratio in the first wave of Omicron sub-variants in countries with different income levels. (B) Levels of case-fatality ratio in the second wave of Omicron sub-variants in countries with different income levels. (C) Levels of case-fatality ratio in the third wave of Omicron sub-variants in countries with different income levels.
Note: The solid line represents the median case-fatality rate for each wave of the epidemic, and the dashed line represents the mean case-fatality rate for each wave of the epidemic.A Kruskal-Wallis one-way ANOVA was performed to assess the relationship between country income level and case-fatality ratio in the first wave of Omicron subvariants. This analysis was chosen based on sample size considerations. The P and Dunn’s two-by-two comparison test results are shown in Table 2. These results indicate that, when the Omicron variant first became endemic, the case-fatality ratio was significantly lower in high-income countries compared to countries with other income levels. This difference is likely due to social inequalities and disparities in resource allocation.
Comparison expression Z P High income vs. low income −3.31 2.79×10⁻³ High income vs. lower-middle income −2.55 3.25×10⁻² Low income vs. lower-middle income 0.99 9.68×10⁻¹ High income vs. upper-middle income −4.50 2.01×10⁻⁵ Low income vs. upper-middle income −0.02 1.00 Lower-middle income vs. upper-middle income −1.60 3.32×10⁻¹ Table 2. Results of the Dunn's test for country income level and case-fatality ratio in the first wave of Omicron sub-variants.
-
The constant mutation of COVID-19 strains and declining levels of immunity may cause coronaviruses to exhibit multiple epidemic waves. Our study found that neither the geographic location nor the income level of a country correlated with the number of epidemic waves. Although the Omicron variant of COVID-19 resulted in different case-fatality ratios for each epidemic wave, the second and third waves had significantly lower case-fatality ratios than the first wave.
Therefore, attention to the novel coronavirus epidemic remains paramount. Analysis of the data in this paper reveals that the interval between the end date of each wave and the start date of the next wave follows a lognormal distribution, with a median of 70 days (interquartile range: 43.75–91) and 87.5 days (interquartile range: 49–119), respectively. Consequently, most national viral strains will likely transition from low to high prevalence within 2–4 months. Discrepancies in income levels, resource allocation, and policy implementation across different countries contribute to significant variations in the Omicron case-fatality ratio. For instance, regarding vaccine distribution in Africa and the Middle East, countries with superior healthcare infrastructure have an advantage in vaccine access (11). Therefore, analyzing data from a wider range of countries and regions is crucial for a more accurate understanding of outbreak temporal characteristics. Increased immune escape by Omicron leads to multiple infection waves, and repeated infections increase the risk of death, hospitalization, and sequelae (12). Therefore, protective measures should be implemented to mitigate the risk of multiple novel coronavirus infections.
HTML
| Citation: |

|