-
Health-adjusted life expectancy (HALE) is a widely recognized metric that captures both mortality and non-fatal health outcomes. Over the past few decades, global HALE has increased substantially and is strongly correlated with the socio-demographic index (SDI) (1-2). However, apart from social development indicators, the impact of population dynamics is often overlooked in studies of factors influencing HALE. Fertility rate, as a crucial element, may have a complex effect on HALE among older adults. Despite HALE increasing globally, the relationship between fertility rate and HALE, particularly among older adults in countries at varying development levels, remains underexplored. Exploring these issues is vital for formulating policies to promote the health and longevity of older populations in the context of low fertility. Therefore, this study analyzed country-level panel data from 1995 to 2019 to examine the impact of fertility rate on HALE at age 65, adjusting for socioeconomic factors and considering different SDI country groupings.
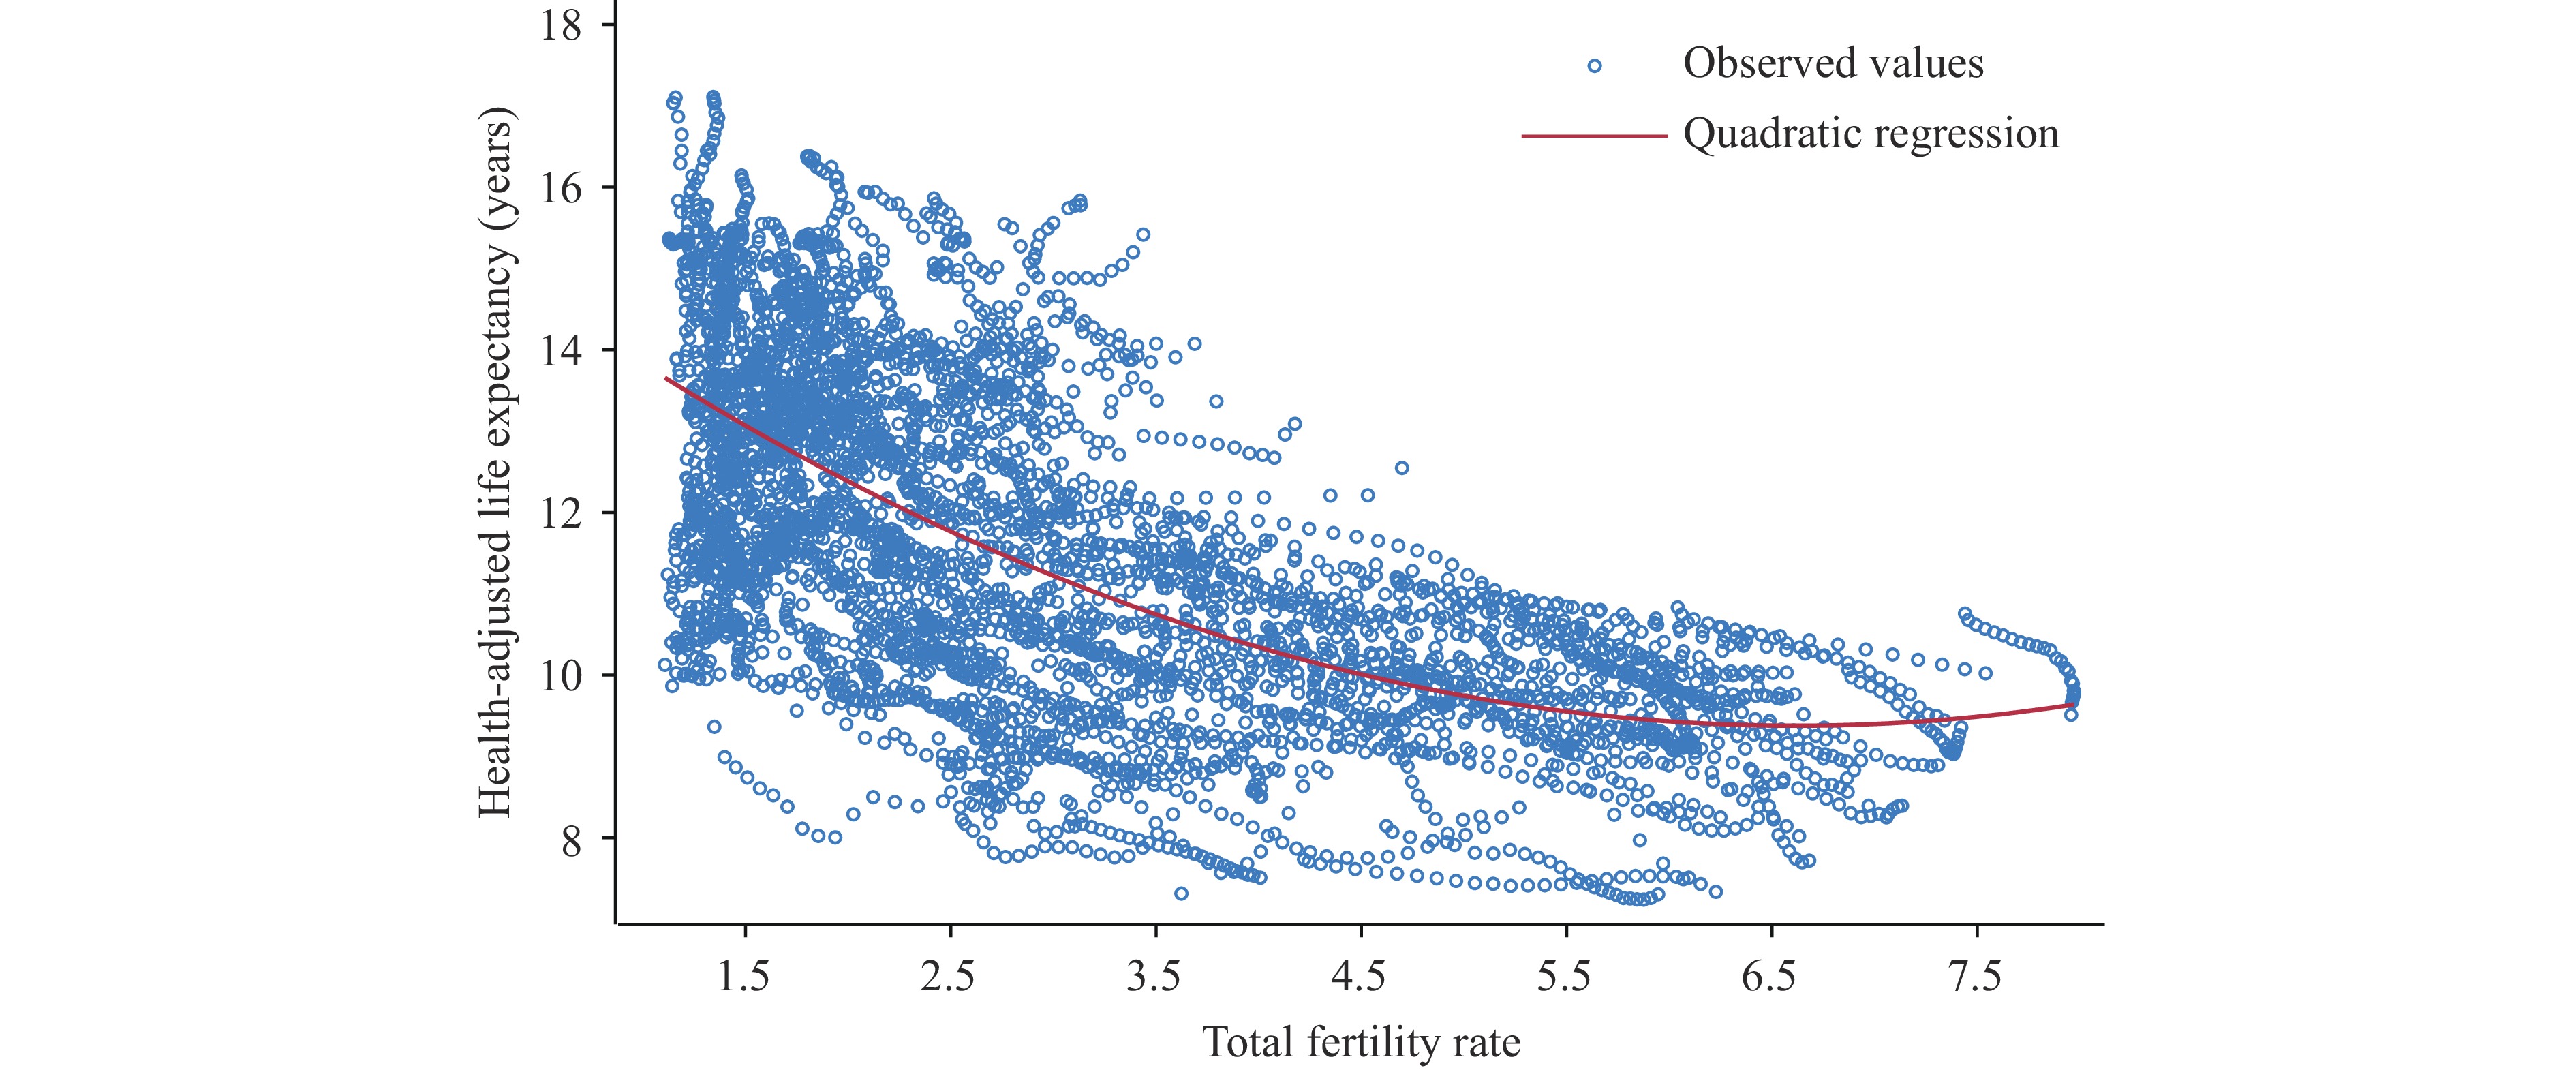
A country-level panel database spanning 1995 to 2019 was constructed using indicators of HALE, total fertility rate (TFR), human resources for health (HRH), gross domestic product (GDP) per capita, and total health spending (THS) per GDP from GBD Results (3). Data from Our World in Data (4), including average years of schooling, population density, and the percentage of the population living in urban areas, were also incorporated. After addressing missing values, 191 of 204 countries and territories were included in the analytical sample, yielding 4,625 observations. The impact of TFR on HALE was estimated using generalized estimating equations (GEE) with Gaussian distributions, considering HALE as the dependent variable and controlling for time effects. In both univariate and multivariate analyses, the quadratic term of TFR was incorporated, as the fitting analysis based on the scatter plot indicated a nonlinear relationship between TFR and HALE (Figure 1). Among covariates, HRH, per capita GDP, THS per GDP, and population density were log-transformed to control for skewness.
 Figure 1.
Scatter plot of TFR and HALE at age 65 across 191 countries, 1995–2019.
Note: A quadratic smoothing method was applied to fit the scatter plot.
Abbreviation: TFR=total fertility rate; HALE=health-adjusted life expectancy.
Countries were ranked and divided equally into three groups based on their 1995 country-level SDI. SDI is a composite measure of development status, calculated as the geometric mean of three indices, each scaled from 0 to 1: total fertility rate among women younger than 25 years, mean years of education among individuals aged 15 years and older, and lag-distributed income per capita. SDI is highly correlated with health outcomes, with a score of 0 representing the lowest theoretical level of development relevant to health and a score of 1 representing the highest. Multivariate GEE models stratified by SDI groups were then estimated. Given that SDI development trends between 1995 and 2019 varied across countries, leading to SDI grouping changes for some countries during this period, the following analysis was conducted. The sample was re-examined, revealing SDI grouping changes in 23 countries during the study period, representing 12.04% of the total sample. The multivariable GEE model was then re-estimated using the 2019 SDI groupings; the main results were unchanged. All computations were performed using STATA 17.0 (StataCorp LLC, College Station, TX, USA).
The estimated results from the GEE models are presented in Table 1. In the univariable model, TFR and all other socioeconomic indicators were statistically significant predictors of HALE. Specifically, HALE tended to increase linearly with decreasing TFR, as the quadratic term for TFR was not statistically significant (TFR: β=−0.48, P<0.001; TFR squared: β=−0.01, P=0.102). Considering other variables, for every 10% increase in HRH density, per capita GDP, and THS per GDP, HALE increased by 0.16 years, 0.14 years, and 0.07 years, respectively. Additionally, a 5-year increase in average years of schooling was associated with a 1.5-year increase in HALE.
Variables Univariable model Multivariable model All All Low SDI† Middle SDI† High SDI† TFR −0.48* (−0.59, −0.36) −0.71* (−0.82, −0.60) 0.37* (0.20–0.53) −0.64* (−0.98, −0.30) −1.41* (−1.85, −0.98) TFR squared −0.01 (−0.02, 0) 0.05* (0.04, −0.06) −0.05* (−0.07, −0.04) 0.11* (0.06, 0.16) 0.57* (0.46, 0.67) Log HRH (workers per
10,000 population)1.61* (1.56, 1.66) 1.21* (1.08, 1.33) 1.16* (0.98, 1.33) 0.38 (−0.12, 0.65) 1.66* (1.50, 1.82) Log per capita GDP
(2021 PPP)1.39* (1.34, 1.44) 0.19* (0.10, 0.29) 0.64* (0.51, 0.76) 0.11 (−0.08, 0.29) 0.34* (0.21, 0.48) Log THS per GDP 0.67* (0.57, 0.76) −0.01 (−0.10, 0.07) −0.04 (−0.14, 0.06) 0.25 (−0.41, 0.09) 0.88* (0.74, 1.01) Average years of
schooling (years)0.30* (0.29, 0.31) 0.32* (0.30, 0.33) 0.25* (0.23, 0.27) 0.29* (0.26, 0.32) 0.23* (0.21, 0.26) Percentage of urban
population (%)0.08* (0.08, 0.08) 0 (0, 0.01) −0.01 (−0.01, 0) 0.02* (0.01, 0.03) 0.02* (0.01, 0.03) Log population density
(people per km2)1.97* (1.87, 2.06) 0.65* (0.54, 0.76) 0.43* (0.26, 0.60) 0.39* (0.17, 0.61) 1.35* (1.19, 1.51) Number of countries 191 191 63 64 64 Observations 4,625 4,625 1,527 1,548 1,550 Note: 95% confident intervals are bracketed below coefficient estimates.
Abbreviation: TFR=total fertility rate; HALE=health-adjusted life expectancy; SDI=socio-demographic index; HRH=human resources for health; GDP=gross domestic product; PPP=purchasing power parity; THS=total health spending.
*P<0.05.
† Low SDI countries: 0.08–0.69; Middle SDI countries: 0.42–0.81; High SDI countries: 0.60–0.93.Table 1. Correlation of TFR and social development indicators with HALE at age 65 across different SDI country groups, 1995–2019.
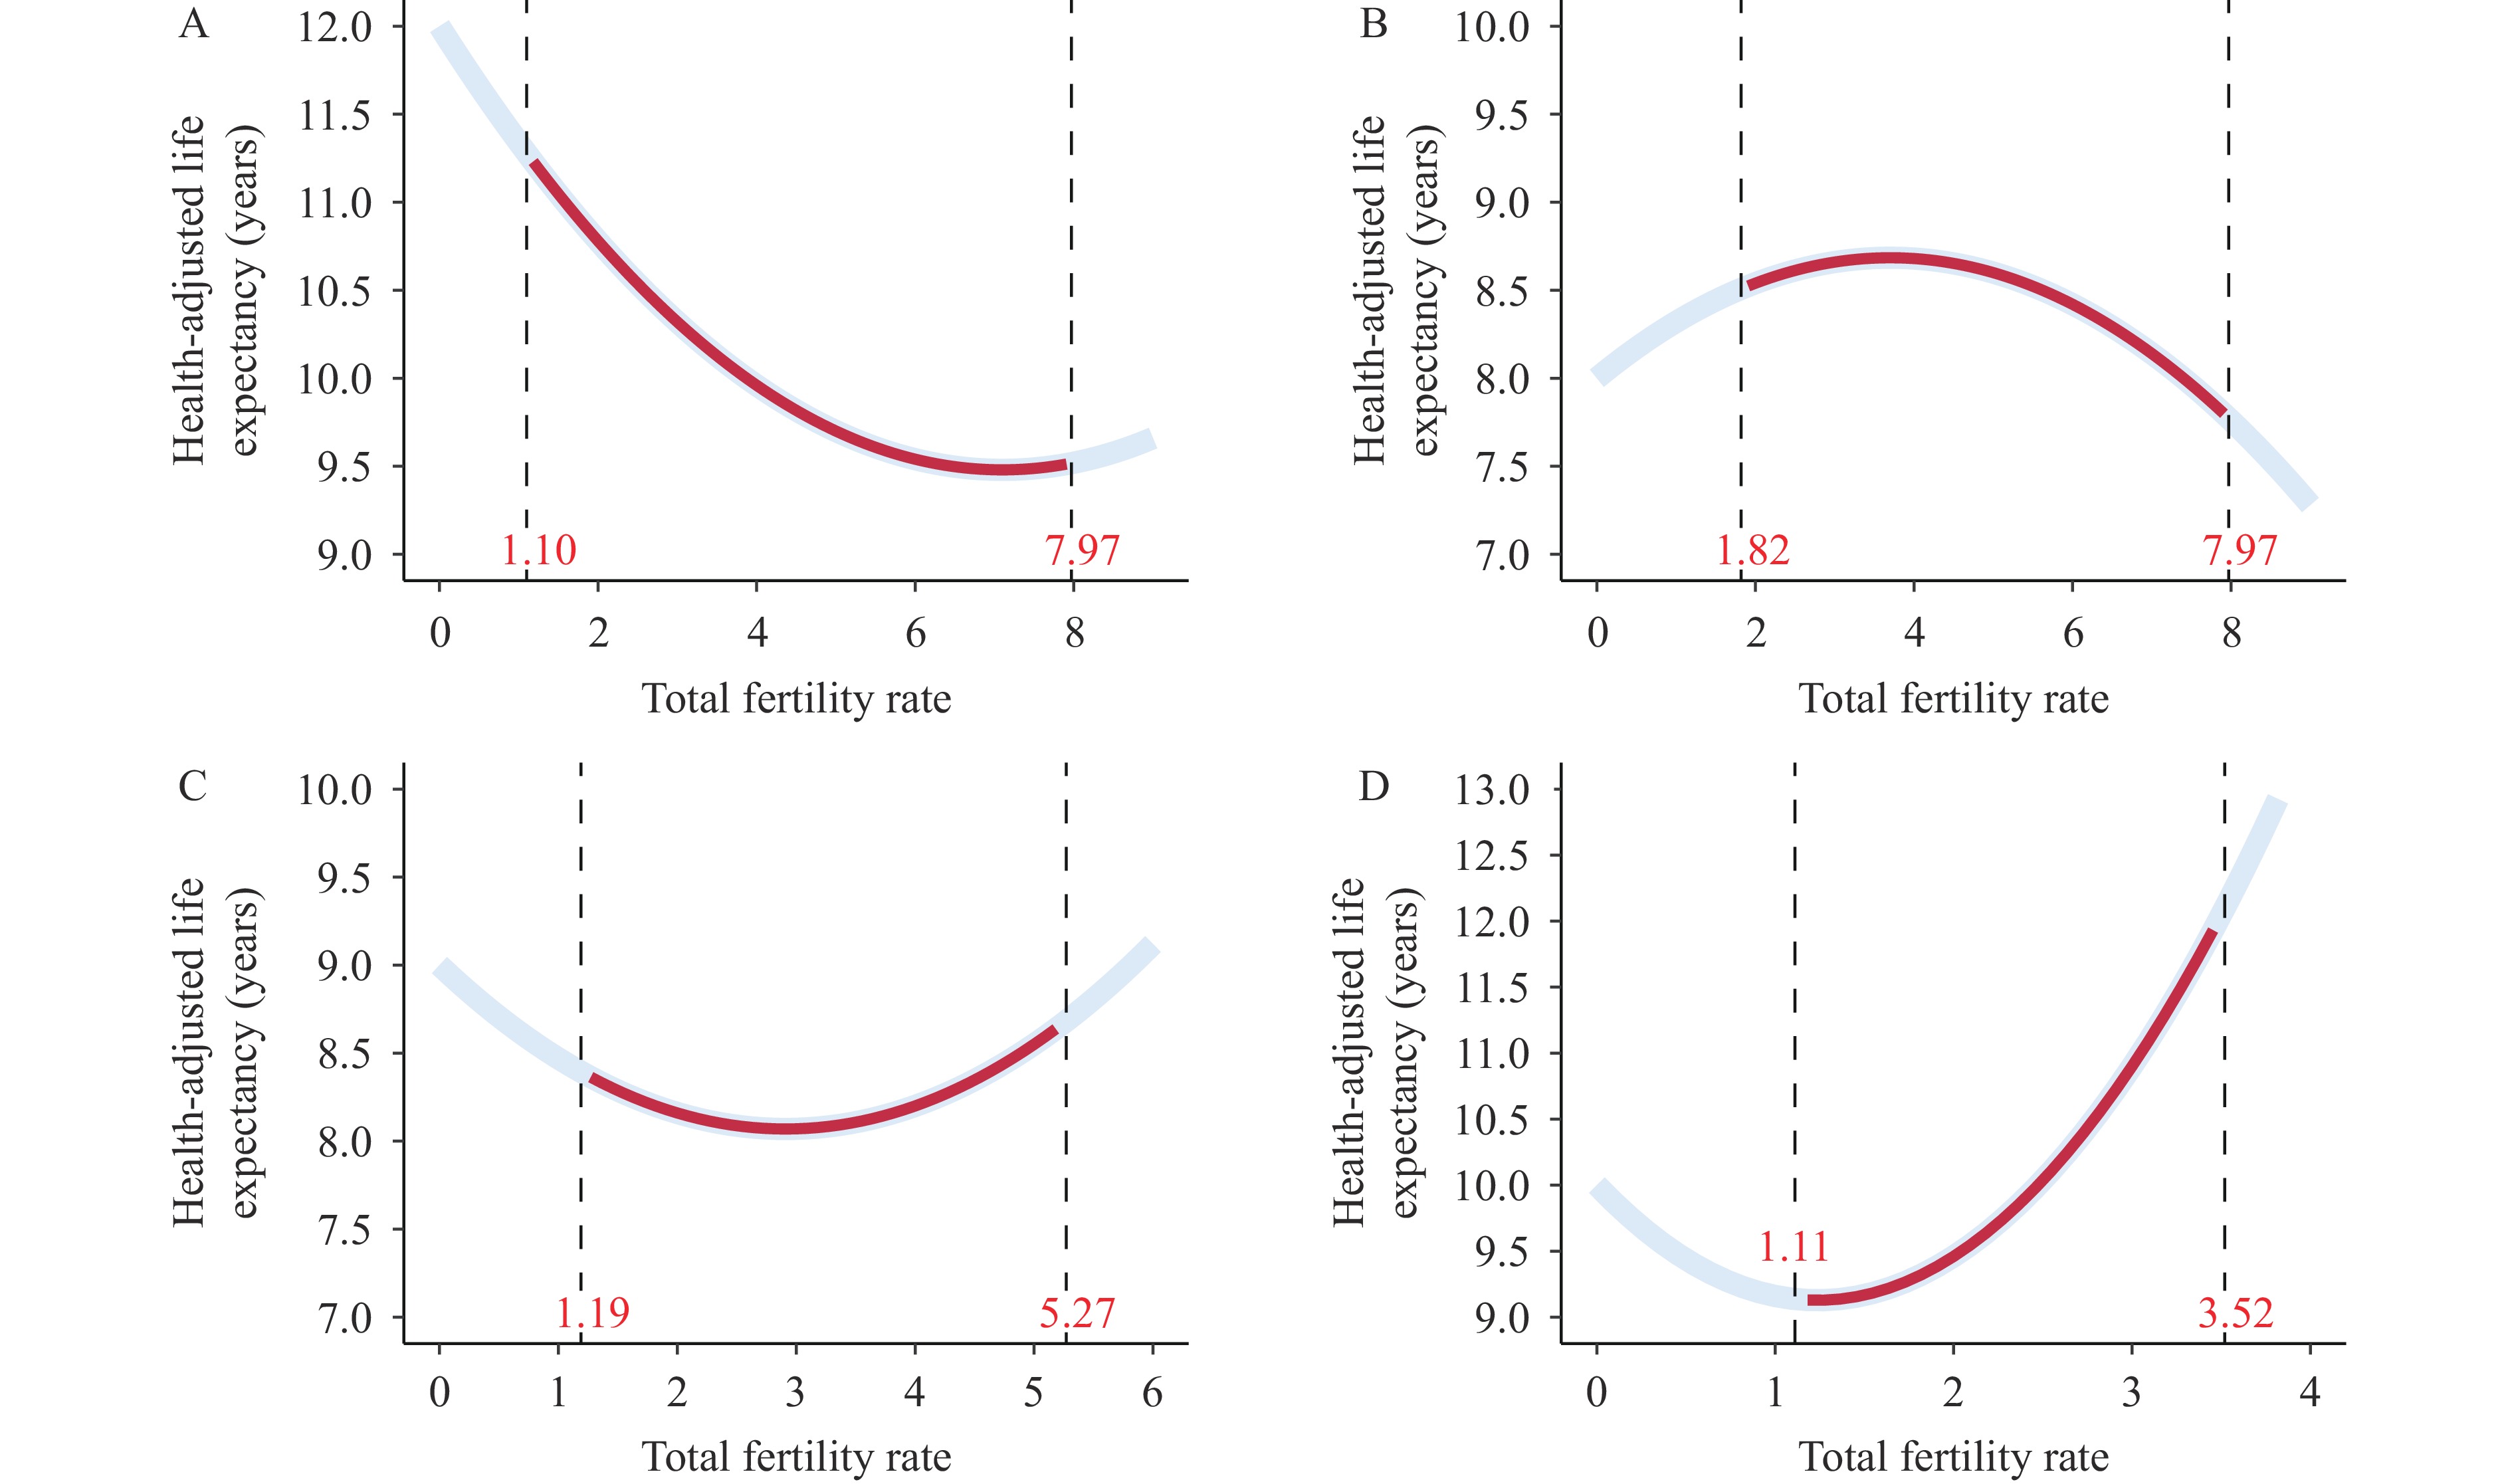
In the multivariable analyses, after controlling for confounding variables, a significant quadratic relationship was observed between TFR and HALE (TFR: β=−0.71, P<0.001; TFR squared: β=0.05, P<0.001). As shown in Figure 2A, as TFR decreased, HALE accelerated after maintaining stability, consistent with the overall trend described by the observed values (Figure 1). Moreover, when compared to the univariable models, the results revealed that the effect sizes for GDP per capita and THS per GDP decreased, while the estimated coefficient for HRH and education remained stable (log HRH: β=1.21, P<0.001; log per capita GDP: β=0.19, P<0.001; log THS per GDP: β=−0.01, P=0.746; average years of schooling: β=0.32, P<0.001).
 Figure 2.
Estimated trends of HALE at age 65 based on observed TFR across different SDI country groups, 1995–2019. (A) Total countries; (B) Low SDI countries; (C) Middle SDI countries; (D) High SDI countries.
Note: The numbers in red in each figure show the range of observed TFR values in each SDI country group, and the corresponding predicted HALE values are also marked using red curves.
Abbreviation: HALE=healthy-adjusted life expectancy; TFR=total fertility rate; SDI=socio-demographic index.
Stratified analyses by SDI groups revealed distinct correlations between TFR and HALE among older adults. In low-SDI countries, HALE increased with rising TFR up to 4. Beyond this threshold, further increases in TFR were associated with a decline in HALE (Figure 2B). Conversely, in the middle- and high-SDI countries, increasing TFR did not reduce HALE. A monotonically upward trend was even observed in high-SDI countries (Figure 2C and D).
-
In the context of promoting improvements in development as an essential strategy for global health, this study further explored the impact of TFR on HALE of the older population among country clusters with different SDI, which will contribute to our understanding of the correlation between TFR and healthy longevity at varying levels of socioeconomic development, as well as to the development of more targeted health promotion programs and interventions.
Although some studies have identified a negative correlation between HALE and TFR (5-6), these studies primarily focused on HALE at birth and did not explore differences in correlation patterns between regions with varying levels of social development. This study conducted a comprehensive analysis of the impact of TFR on health and longevity through HALE for the first time. The key finding is that the decline in TFR promotes an overall upward trend in HALE among the older population globally, which is also evident in low-SDI countries when TFR exceeds approximately 4. However, this relationship weakens in middle-SDI countries and reverses in high-SDI countries, where HALE decreases as TFR declines. For instance, Japan, a high-SDI country, exemplifies the challenges posed by low fertility rates. Japan faces significant health and economic burdens due to bottom-up aging, driven by a combination of low fertility, high life expectancy, and demographic shifts. This is reflected in the widening gap between life expectancy and healthy life years, despite ongoing increases in overall life expectancy (7). In summary, the study findings suggest that while the trend of declining TFR may support healthy aging in less developed countries, different strategies may be required in more developed countries, where this decline could pose health and economic challenges.
Considering other socioeconomic indicators, the study confirmed the critical role of education in promoting population health, demonstrating similar effect sizes across SDI groups. This suggests that increasing educational attainment remains an effective measure for healthy aging (8). Furthermore, a strong association between higher levels of healthcare resources and HALE among older adults was consistent with previous analyses (9). However, stratified analyses revealed that the influence of HRH in middle-SDI countries was no longer significant. Similar results were reported in a study examining the correlation between health system performance measured by the Healthcare Access and Quality Index and HALE at age 70 (2). Finally, the study results indicated that regardless of SDI grouping, the contribution of economic level to HALE was significantly reduced in multivariate models. A cluster analysis of 22 Western Pacific countries showed that, although GDP per capita in developed countries was five times higher than in the least developed countries, HALE at age 70 was similar across groups, potentially due to comparable THS per GDP (10).
The public health implications of these findings are substantial. In low-SDI countries, efforts should focus on fertility rate management and improving education systems to enhance health literacy, which can contribute to better health outcomes in older adults. Conversely, in middle- and high-SDI countries, TFR should be maintained within a reasonable range. In addition to controlling TFR, improving healthcare quality, expanding access to care, and strengthening social support systems are crucial to ensuring that longer lifespans yield better health outcomes.
This analysis shares the limitations of the GBD 2019 publications (11), including difficulties identifying sources of uncertainty, delays in data availability, variability in coding practices, and other biases. Additionally, this study did not include other important socioeconomic indicators that may affect older adult health, such as the status of women (1), due to limited data availability. Furthermore, because TFR is a component of SDI, its inclusion as both a covariate and part of the stratifying indicator requires careful interpretation. By including TFR as a separate independent variable in our models, we isolated its direct effect on HALE, independent of its contribution to SDI. This strategy helps avoid conflating the direct effect of TFR on HALE with its indirect influence through SDI. Nevertheless, stratifying by SDI remains pivotal because it encompasses a broader socioeconomic and demographic context. While TFR affects HALE directly and indirectly through SDI, our model adjustments clarify that the observed patterns reflect more than just the fertility component of SDI. This underscores the importance of considering the broader socioeconomic landscape when interpreting the relationship between fertility rates and HALE across different developmental contexts.
In conclusion, based on the long-span country-level panel data, this study identified various patterns of correlation between TFR and HALE at different levels of SDI, and these effects are independent of other socioeconomic indicators that may influence HALE. Given the finding that HALE decreases with declining TFR in high-SDI countries, low- and middle-SDI countries with the potential for future development should invest more in health capital to prepare for the future health challenges of aging populations. Additionally, countries currently experiencing low fertility rates but still at lower levels of socioeconomic development should adopt a range of additional cost-effective socioeconomic measures to ensure a balanced improvement in both health and longevity.
HTML
| Citation: |


 Download:


