

 Download:


-
Infertility represents a significant global public health concern that affects the quality of life for individuals of both sexes and poses challenges to human fertility and birth rates, particularly in regions with low fertility desires. This condition not only impacts demographic trends but is also associated with various social issues, including stigmatization, marital strife, and psychological distress (1). It is reported that 15% of couples of reproductive age worldwide experience infertility, with prevalence rates as high as 30% in certain populations (2). The Asia-Pacific region, which houses over half of the global population, is experiencing a decline in fertility rates attributed to both diminished fertility desires and capacities, thereby leading to structural population issues (3). Yet, research on infertility in these areas is sparse and often restricted to women or limited demographics. This study utilizes the 2021 Global Burden of Disease (GBD) data to assess trends and distributions of infertility in the Asia-Pacific, focusing on gender and age demographics, regional variances, and shifts in the causes of infertility from 1990 to 2021. The results indicate polycystic ovary syndrome (PCOS) has emerged as a predominant concern, while the Philippines has the highest and most rapidly increasing rates of infertility. These findings could provide a foundation for formulating precise infertility prevention and control policies within the Asia-Pacific region.
The analysis focused on the prevalence and number of infertility cases, as well as the estimated annual percentage change (EAPC) in age-standardized prevalence rates for both sexes over the 31-year period. Given that the Asia-Pacific region theoretically includes 39 countries, this study narrowed its focus to the 29 countries identified in recent research by The Joint United Nations Programme on HIV/AIDS (UNAIDS)
1 (4). Infertility prevalence number was determined by the total number of cases within the population, while the prevalence rate was calculated per 100,000 population. Age-standardized rates (ASR) per 100,000 population with 95% uncertainty intervals (UIs) derived from the 25th to 975th values of the ordered 1,000 draw-level estimates, were computed using the formula: $ \mathrm{A}\mathrm{S}\mathrm{R}= \sum _{\mathrm{i}=1}^{\mathrm{A}}{\mathrm{a}}_{\mathrm{i}}{\mathrm{w}}_{\mathrm{i}}/ \sum _{\mathrm{i}=1}^{\mathrm{A}}{\mathrm{w}}_{\mathrm{i}}\times \mathrm{100,000} $ , where ai is the age-specific rate of the ith age group, wi is the number of persons (or weight) of the ith age group in the selected reference standard population, and A is the number of age groups.Furthermore, the EAPC across these countries was calculated to describe both spatial and temporal patterns of infertility from 1990 to 2021. EAPC is a widely recognized measure summarizing the trend of ASR over time (5-6). A regression line was fitted to the natural logarithm of the rates, i.e.,
$ \mathrm{y}=\mathrm{a}+\mathrm{\beta }\mathrm{x}+\mathrm{e} $ , where$ \mathrm{y}=\mathrm{ln}\left(\mathrm{A}\mathrm{S}\mathrm{R}\right) $ and$ \mathrm{x}\mathrm{ }=\mathrm{ }\mathrm{c}\mathrm{a}\mathrm{l}\mathrm{e}\mathrm{n}\mathrm{d}\mathrm{a}\mathrm{r}\mathrm{ }\mathrm{y}\mathrm{e}\mathrm{a}\mathrm{r} $ . The EAPC was calculated as$ 100\times \mathrm{ }(\mathrm{e}\mathrm{x}\mathrm{p}\left(\mathrm{\beta }\right)-1) $ and its 95% confidence interval (CI) were obtained from the linear regression model output. An increasing trend in ASR was indicated if both the EAPC estimation and the lower boundary of its 95% CI exceeded zero, whereas a decreasing trend was noted if both the EAPC estimate and the upper boundary of its 95% CI fell below zero. Otherwise, ASRs were considered stable (6). Statistical analyses were conducted using R software (version 4.3.0, R Development Core Team, Vienna, Austria).The prevalence of primary and secondary infertility has varied by sex, age, and over time in the Asia-Pacific Region, as illustrated in Figure 1. Figure 1A demonstrates the differences in prevalence rates between males and females across age groups from 1990 to 2021. Females consistently exhibited higher infertility rates across all age groups, with the most pronounced age-specific prevalence differences due to female-predominant causes occurring between the ages of 35 and 39 years in both 1990 and 2021. Over the past three decades, both primary and secondary infertility have been more prevalent in females. Specifically, secondary infertility was particularly notable in both sexes aged 35–39 in 1990 and 2021, whereas primary infertility was more common in both sexes aged 20–24 in 1990 and 25–29 in 2021. Additionally, secondary infertility consistently showed higher prevalence rates compared to primary infertility across all age groups in both years. Moreover, the growth rate of secondary infertility surpassed that of primary infertility from 1990 to 2021. The pattern of sex and age disparities over time was similarly reflected in the prevalence number of infertility (Figure 1B).
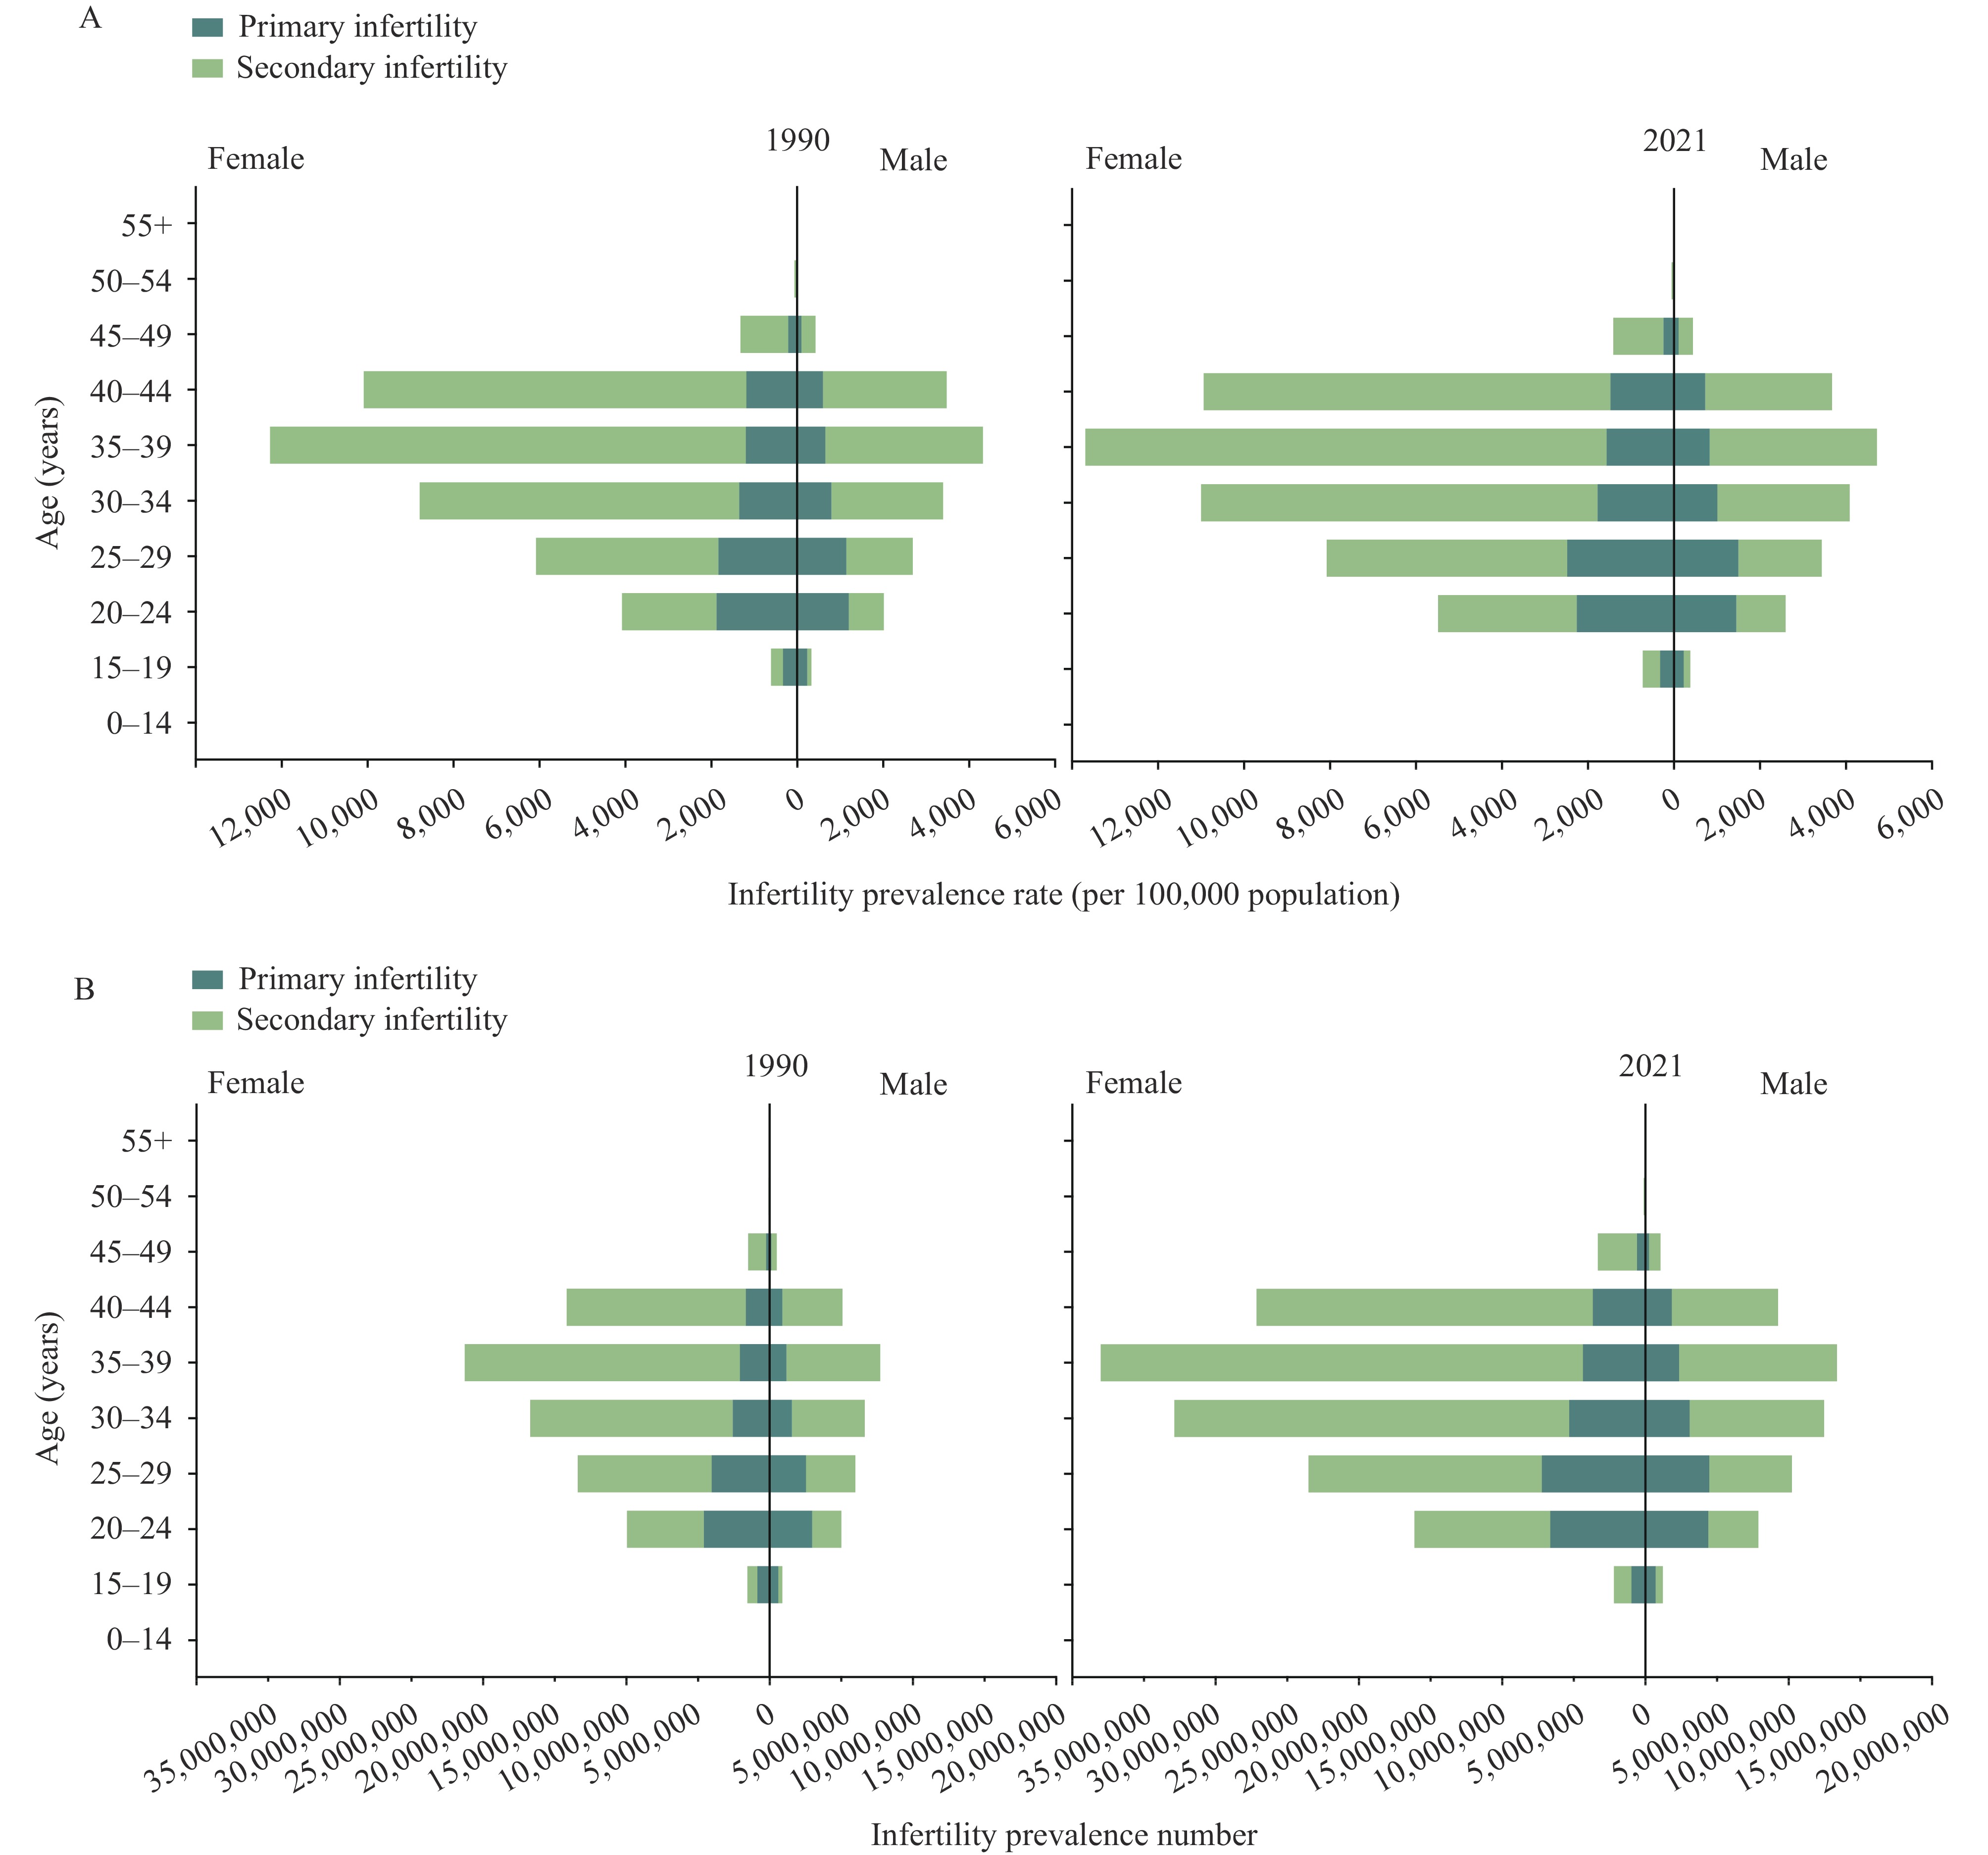 Figure 1.
Trends and distribution of primary and secondary infertility prevalence rates and numbers by age group for females and males in the Asia-Pacific region, 1990–2021. (A) Infertility prevalence rate. (B) Infertility prevalence number.
Note: Infertility can be classified as either primary or secondary. Primary infertility refers to the inability to achieve a first pregnancy, whereas secondary infertility denotes the inability to conceive following a previous pregnancy.In 2021, the ASR of infertility prevalence varied markedly across the Asian Pacific region. The Philippines exhibited the highest ASR at 3,510.33 per 100,000, followed by Indonesia and Pakistan, whereas Australia reported the lowest rate at 897.96 per 100,000 (Table 1). Of the 29 countries analyzed, 10 showed significant increases in infertility prevalence ASR. The most substantial rise was seen in the Philippines, with an EAPC of 5.33 (95% CI: 3.25, 7.45), followed by India and Viet Nam (EAPC=1.94, 95% CI: 1.43, 2.45 and EAPC=1.62, 95% CI: 1.05, 2.19, respectively). Conversely, nine countries reported declining trends, with the greatest decrease observed in Pakistan (EAPC=−3.29, 95% CI: −6.04, −0.45) (Table 1).
Regions ASR per 100,000 in 1990
(95% UI)ASR per 100,000 in 2021
(95% UI)EAPC (%), 1990–2021
(95% CI)Global 2,075.72 (1,336.16, 3,182.36) 2,468.15 (1,581.10, 3,862.14) 0.57 (0.44, 0.70) Afghanistan 1,461.20 (932.56, 2,292.92) 979.32 (856.35, 1,160.28) −1.82 (−2.11, −1.52) Australia 890.36 (530.73, 1,409.53) 897.96 (528.18, 1,417.18) 0.01 (−0.05, 0.06) Bangladesh 1,183.95 (1,055.27, 1,345.81) 1,533.48 (1,376.83, 1,734.36) 1.05 (0.75, 1.36) Bhutan 1,406.00 (893.20, 2,162.94) 1,419.05 (903.35, 2,174.70) 0.01 (−0.01, 0.02) Brunei Darussalam 1,030.88 (577.12, 1,693.11) 1,044.28 (583.39, 1,744.85) 0.05 (−0.02, 0.13) Cambodia 2,057.25 (1,236.86, 3,463.66) 1,984.32 (1,204.36, 3,318.29) −1.87 (−2.58, −1.16) China 2,944.84 (1,726.45, 4,873.84) 3,135.64 (1,851.35, 5,164.88) 0.10 (0.06, 0.15) Democratic People's Republic of Korea 2,347.94 (1,391.90, 3,985.52) 2,273.22 (1,324.95, 3,903.93) −0.20 (−0.24, −0.17) Fiji 2,836.28 (1,786.14, 4,293.09) 2,844.53 (1,852.98, 4,281.87) −0.01 (−0.02, 0.00) India 1,963.85 (1,232.87, 3,046.20) 3,041.50 (1,961.52, 4,792.83) 1.94 (1.43, 2.45) Indonesia 2,280.56 (1,411.98, 3,604.37) 3,332.04 (2,041.71, 5,385.01) 1.49 (1.03, 1.95) Iran (Islamic Republic of) 1,809.77 (1,128.16, 2,883.87) 1,835.71 (1,126.24, 2,921.20) −0.20 (−0.69, 0.28) Japan 1,660.44 (917.14, 2,852.42) 1,687.98 (950.28, 2,857.53) −0 (−0.10, 0.09) Lao People’s Democratic Republic 1,820.00 (1,110.00, 3,021.84) 1,762.87 (1,098.53, 2,894.07) −0.05 (−0.07, −0.03) Malaysia 2,006.65 (1,200.48, 3,347.56) 1,983.66 (1,189.22, 3,345.92) −0.04 (−0.06, −0.02) Maldives 3,632.57 (2,293.16, 5,685.02) 2,371.73 (2,058.51, 2,749.48) −1.82 (−2.17, −1.47) Mongolia 1,584.92 (949.44, 2,685.90) 1,715.44 (1,008.38, 2,906.38) 0.28 (0.25, 0.30) Myanmar 1,867.81 (1,093.28, 3,175.98) 1,133.83 (1,005.34, 1,308.96) −2.29 (−2.71, −1.86) Nepal 1,718.86 (1,087.54, 2,753.70) 1,004.01 (865.60, 1,165.00) −0.67 (−1.33, 0.00) New Zealand 9,72.45 (564.95, 1,524.23) 1,384.51 (826.30, 2,141.65) 1.58 (1.31, 1.86) Pakistan 3,230.98 (1,359.57, 6,084.93) 3,226.62 (1,301.38, 6,199.24) −3.29 (−6.04, −0.45) Papua New Guinea 1,446.30 (911.11, 2,255.36) 1,035.89 (865.11, 1,225.50) −1.23 (−1.55, −0.91) Philippines 3,046.45 (1,320.03, 5,547.14) 3,510.33 (1,599.58, 6,312.60) 5.33 (3.25, 7.45) Republic of Korea 1,056.95 (591.37, 1,765.99) 1,065.12 (586.74, 1,801.75) 0.00 (−0.09, 0.09) Singapore 1,060.92 (595.63, 1,803.57) 1,125.21 (617.59, 1,916.93) 0.08 (−0.05, 0.20) Sri Lanka 955.78 (808.83, 1,141.02) 1,570.44 (982.91, 2,555.69) 0.63 (0.29, 0.98) Thailand 993.29 (832.85, 1,190.81) 1,691.46 (1,042.39, 2,705.93) 0.71 (0.36, 1.06) Timor−Leste 1,409.94 (897.06, 2,201.63) 1,447.15 (894.55, 2,253.38) −0.13 (−0.58, 0.33) Viet Nam 964.28 (591.37, 1,626.28) 933.46 (577.76, 1,567.81) 1.62 (1.05, 2.19) Abbreviation: ASR=age−standardized rate; EAPC=estimated annual percentage change; UI=uncertainty interval; CI=confidence interval. Table 1. Age-standardized infertility prevalence rate in 1990 and 2021, and estimated annual percentage change in age-standardized infertility prevalence rate among both sexes in Asia-Pacific countries from 1990 to 2021.
The distribution of infertility causes within the Asia-Pacific Region demonstrated notable shifts between 1990 and 2021, as depicted in Figure 2, which outlines specific causes at level 4 of the impairment factors hierarchy. In 1990, the predominant causes of infertility were identified as female infertility, male infertility, and various sexually transmitted infections (STIs). By 2021, these had shifted to female infertility, male infertility, and polycystic ovarian syndrome (PCOS). During this time frame, urogenital congenital anomalies declined from the eighth to the eleventh most common cause, with prevalence rates decreasing significantly from 414.52 to 7.56 per 100,000 population. In addition, there were upward movements in the rankings for PCOS, maternal sepsis, other maternal infections, Klinefelter syndrome, and Turner syndrome. Conversely, other STIs saw a decline in their relative importance as causes of infertility by 2020. Notably, PCOS rose from the fourth to the third leading cause of infertility, with an increase in prevalence rate of 1,772.25 per 100,000 population (Figure 2).
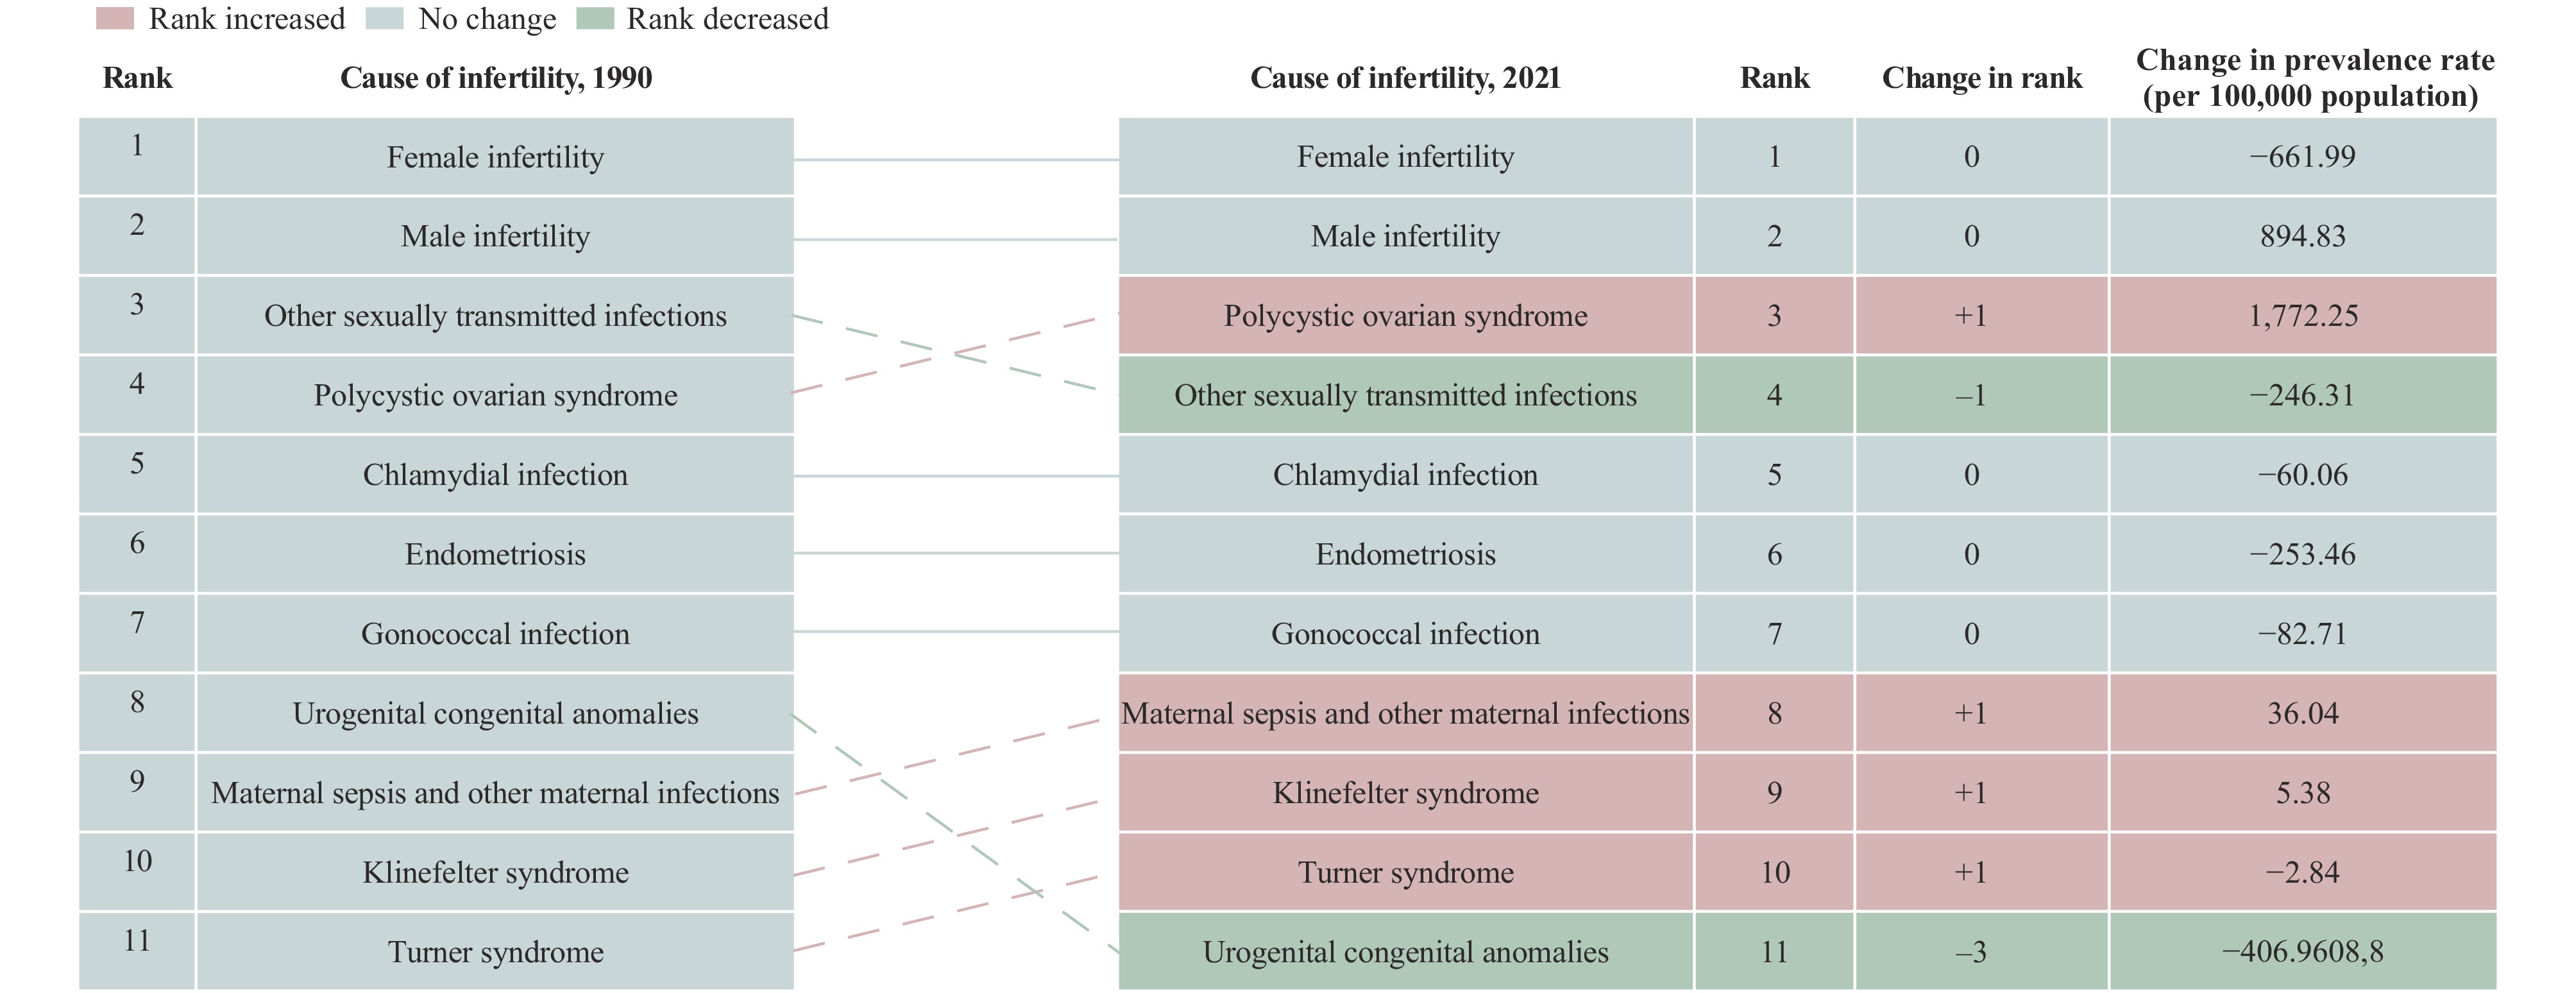 Figure 2.
Causes of infertility: prevalence rates, rank changes, and changes in infertility rates among both sexes in the Asia-Pacific region, 1990–2021.
-
Our study identified significant sex and age disparities in infertility across the Asia-Pacific region from 1990 to 2021. The results demonstrate a more rapid increase in the prevalence of female infertility compared to male infertility, with secondary infertility rising more swiftly than primary infertility. Notably, infertility attributable to PCOS has significantly increased over the last three decades. Additionally, the study exposes geographical differences in the prevalence and trends of infertility, noting that the Philippines exhibits the highest levels and fastest growth rates.
A study in India indicates that urban lifestyle risk factors — including diabetes and later age at first marriage — may contribute to increasing infertility rates (7). Furthermore, work stress and other stressful life events have been associated with menstrual irregularities, which can precipitate PCOS and, subsequently, infertility. Additionally, another study finds that obesity is a potent risk factor for PCOS, which is a leading cause of infertility (8). Cultural factors and differences in reproductive health policies, such as religious restrictions on contraception and abortion in the Philippines, also exacerbate secondary infertility by limiting access to necessary reproductive health services, increasing the risk of unintended pregnancies and unsafe abortions, thereby contributing to rising rates of secondary infertility.
Despite strides in assisted reproductive technologies, such as in vitro fertilization and artificial insemination, their limited accessibility and affordability pose challenges in addressing infertility in these regions (9). On the other hand, the decline in infertility rates related to STIs, excluding human immunodeficiency virus (HIV), such as chlamydial and gonococcal infections, may correlate with a reduction in intimate partner violence (IPV), as other studies have suggested that IPV can lead to infertility through physical, sexual, or psychological trauma, including STIs (10).
This study was subject to several limitations. First, although it highlights PCOS as a key contributor to rising female infertility rates, it does not extensively explore other potential influencers. Second, while identifying geographic variations in infertility prevalence and trends among different countries, the study fails to offer a detailed analysis of these variations due to insufficient geographic data. Additionally, the constraints of data availability regarding comprehensive socio-cultural and policy factors within the GBD data mean that the study primarily addresses observable trends and may not adequately reflect their impacts on infertility prevalence in all scenarios. This highlights the need for further research to fully understand the complex influences on infertility across various populations.
In conclusion, this study delineates the disparities and temporal trends in demographic attributes, including age and sex distributions, and geographical variances of infertility within the Asia-Pacific region from 1990 to 2021. This research offers crucial insights for shaping population fertility policies, reproductive health strategies, and health governance across the Asia-Pacific, highlighting the critical role of sexual and reproductive health services and reproductive rights in safeguarding fertility.
-
No conflicts of interest.
HTML


FootNote
| ① |
|
| Citation: |

|