

 Download:


-
Measles is an acute, highly contagious viral disease characterized by fever, rash, cough, conjunctivitis, and coryza. The measles virus is extremely transmissible, with over 90% of susceptible individuals developing symptoms upon exposure. Historically, measles has been one of the most common acute respiratory infections in children, with significant outbreak potential (1). Global efforts have been directed towards eliminating measles. In 2020, the World Health Organization (WHO) introduced the “2021–2030 Global Measles and Rubella Strategic Framework,” which aims to achieve and sustain regional measles elimination by 2030 (2). Vaccination with measles-containing vaccines (MCV) remains the most cost-effective and efficient method for preventing measles and its complications. Since the implementation of planned immunization in China in 1978, the incidence of measles has dramatically decreased. From 2017 onwards, the reported incidence rate of measles in China has been below 1 per 100,000, indicating progress towards the elimination goal (3–5). This study analyzes the epidemiological characteristics and spatiotemporal distribution of measles in China from 2005 to 2022 to provide a scientific basis for enhancing measles prevention and control measures.
-
We obtained measles reporting data from the China Disease Prevention and Control Information System to assess the epidemiological characteristics of measles based on the date of illness onset. All clinical diagnostic cases and laboratory-confirmed cases reported between 2005 and 2022 were included in our study. Incidence was calculated as the number of reported cases divided by the population size for that year, excluding Hong Kong Special Administrative Region (SAR); Macao SAR; and Taiwan, China.
We constructed an analytical database using Microsoft Excel 2019 (version 2019,Microsoft Corporation, Redmond, WA, USA) and applied joinpoint regression to evaluate trends in incidence with the Joinpoint Regression Program (version 4.9, Information Management Services, Inc., Calverton, MD, USA) by Kim and colleagues (6). Spatial autocorrelation was assessed using Moran’s I statistic in ArcGIS Desktop (version 10.6, Environmental Systems Research Institute Inc., California, USA). To identify provincial-level disease hotspots, we employed the Getis-Ord Gi* index (7). A region and its surrounding areas were considered significant hotspots if they exhibited higher values according to the index. We utilized the space-time scan statistic in SaTScan (version 9.6, Information Management Services, Maryland, USA), based on spatial dynamic window scanning, to investigate the spatial-temporal clustering of measles (8). Statistical significance was determined with a threshold (α) set at 0.05, with P values less than 0.05 considered significant.
-
From 2005 to 2022, a total of 732,218 measles cases were reported in China, comprising 431,053 males and 301,165 females, resulting in a male-to-female ratio of 1.43:1. The incidence rate varied from 0.039 to 9.95 per 100,000, with an average reported incidence of 3.00 per 100,000 (Figure 1). Joinpoint regression identified three incidence inflection points in 2008, 2011, and 2015. The annual percentage changes (APC) for the periods 2005−2008, 2008−2011, 2011−2015, and 2015−2022 were 2.13 [95% confidence interval (CI): −8.09, 22.52, P>0.05], −51.17 (95% CI: −62.35, −37.01, P<0.05), 37.59 (95% CI: 13.05, 109.94, P<0.05), and −55.28 (95% CI: −73.83, −44.01, P<0.05), respectively. The average annual percentage change (AAPC) was −31.55 (95% CI: −43.03, −27.12, P<0.05). Overall, the reported incidence of measles showed a significant decline from 2005 to 2022, with notable reductions during the periods 2008–2011 and 2015–2022.
 Figure 1.
Measles reported cases and incidence rates in China from 2005 to 2022.
Measles cases were reported monthly throughout the study period. Significant seasonal peaks in measles incidence were observed from 2005 to 2010 and again from 2013 to 2016, predominantly occurring between March and June. However, starting in 2017, the seasonality became less distinct, with cases reported sporadically year-round. The highest incidence was observed in the 0–4 year age group at 26.03 per 100,000, followed by the 5–9 year age group at 6.21 per 100,000. Among children under ten years, infants had the highest incidence at 75.41 per 100,000 (Figure 2). Overall, the majority (51.18%) of measles cases were in children under 5 years old, with very few cases in adults aged 50 years and older, excluding 14 cases with unknown ages.
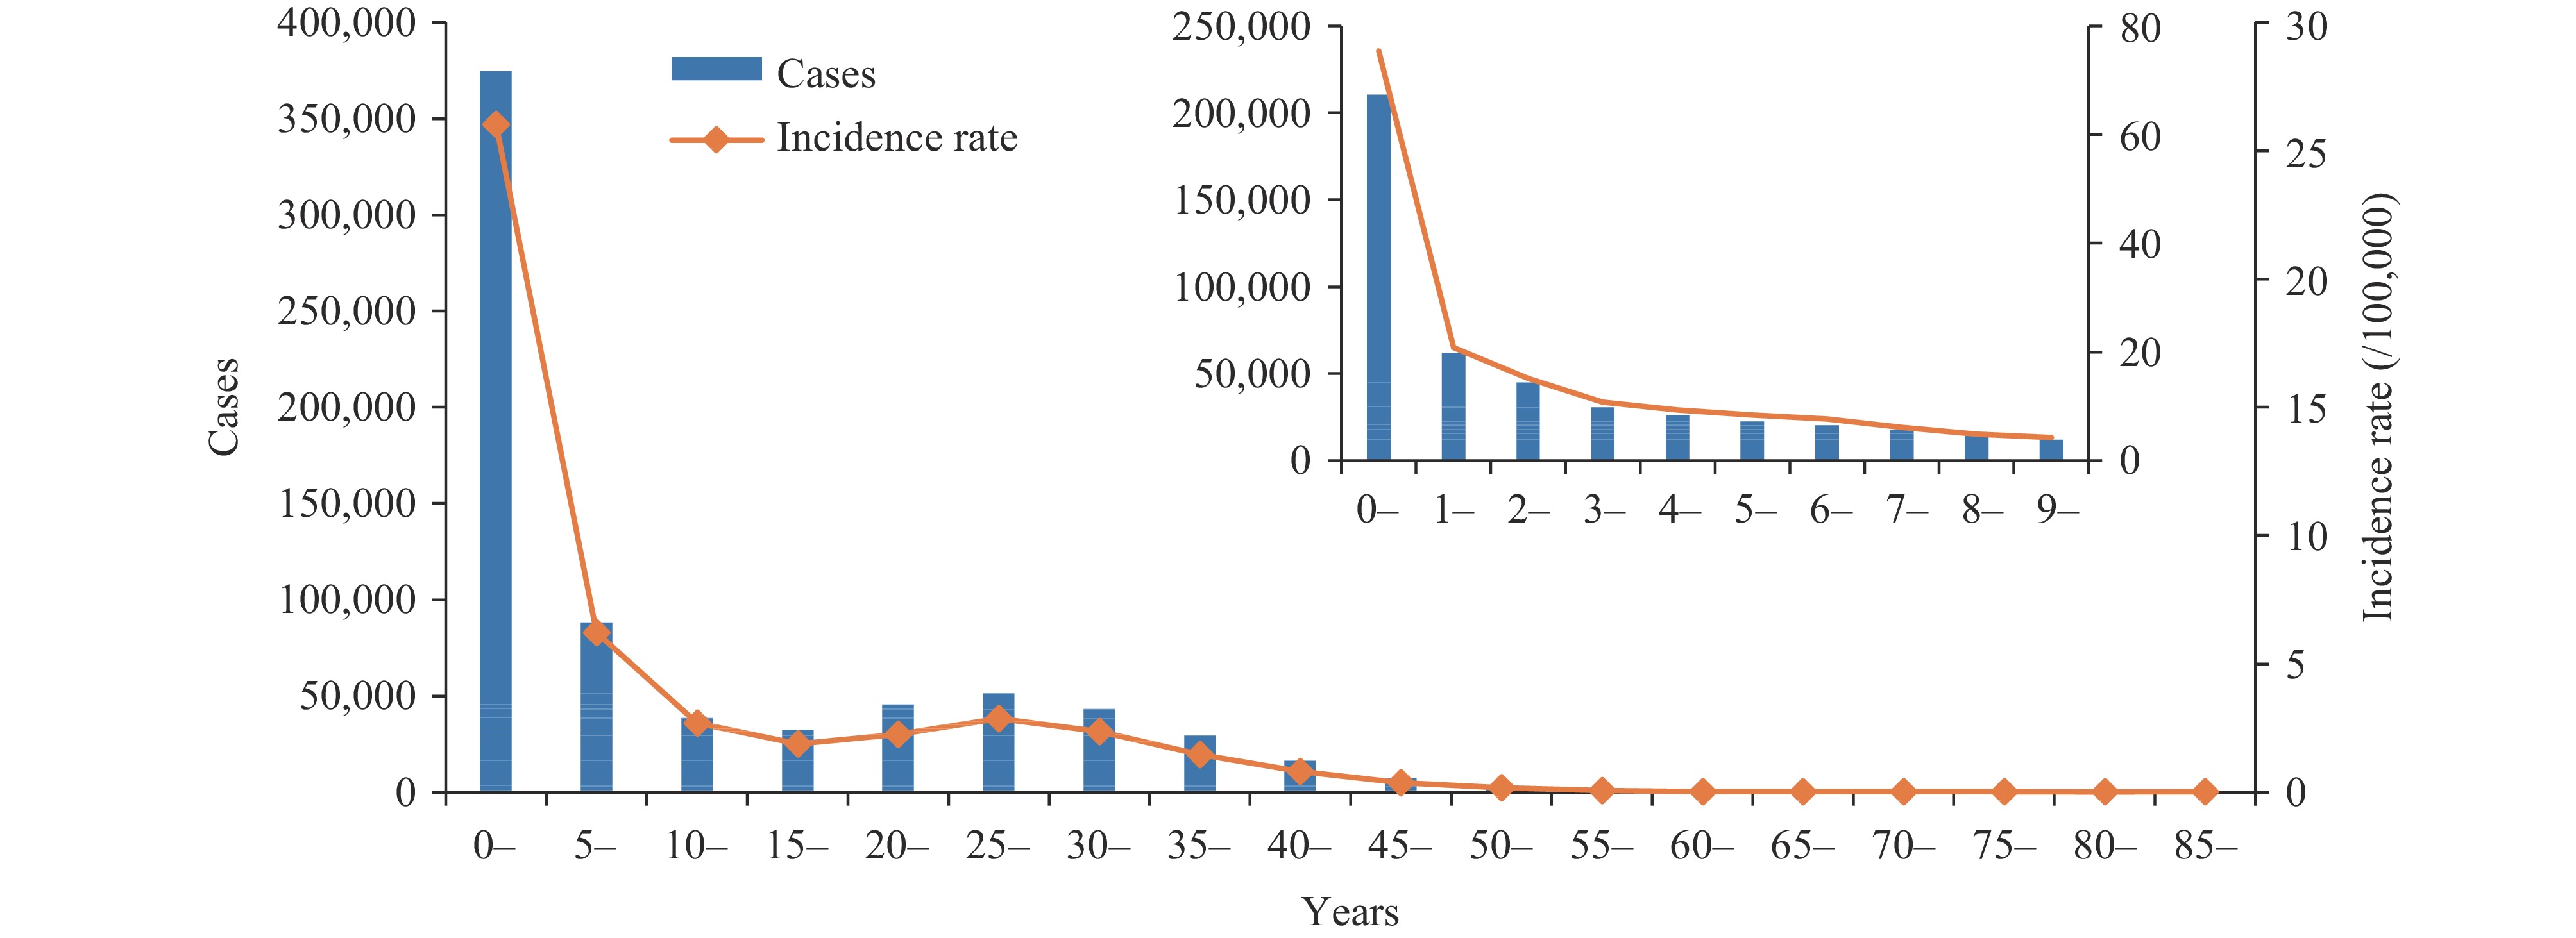 Figure 2.
Measles reported cases and incidence rates by age group in China from 2005 to 2022.
The global spatial autocorrelation analysis of measles incidence rates from 2005 to 2022 revealed that Moran’s I values varied between −0.14 and 0.55. Significant spatial clustering of measles was identified during 2010–2011 and 2014–2017, with Moran’s I values over 0 and statistically significant (P<0.05). Local spatial autocorrelation analysis indicated that the number of provincial-level administrative divisions (PLADs) with measles hotspots ranged from zero to five (P<0.05). Hotspots were predominantly found in western PLADs. Although the overall measles incidence decreased to less than 1/100,000 in 2017 and no global spatial clustering was observed subsequently, incidence hotspots were still detected in western PLADs through local spatial autocorrelation analysis. Only one cold spot was detected in Yunnan in 2009 (Table 1). Spatiotemporal scan analysis identified one high-risk cluster and one low-risk cluster, encompassing 15 and 13 provincial-level areas, respectively (Table 2). The high-risk cluster persisted from 2005 to 2008 [relative risk (RR) =4.69, log-likelihood ratio (LLR) =140,816, P<0.001)], while the low-risk cluster persisted from 2016 to 2022 (RR=0.08, LLR=113,675, P<0.001).
Year Hotspot regions Cold spot regions N PLADs N PLADs 2005 3 Xinjiang, Xizang, Qinghai 0 2006 0 0 2007 0 0 2008 2 Xinjiang, Qinghai 0 2009 0 1 Yunnan 2010 3 Beijing, Tianjin, Hebei 0 2011 4 Xinjiang, Xizang, Qinghai, Sichuan 0 2012 1 Xizang 0 2013 2 Xinjiang, Xizang 0 2014 5 Hebei, Beijing, Jilin, Liaoning Tianjin 0 2015 4 Xinjiang, Xizang, Qinghai, Sichuan 0 2016 4 Xinjiang, Xizang, Qinghai, Gansu 0 2017 5 Xinjiang, Xizang, Qinghai, Sichuan, Yunnan 0 2018 1 Xizang 0 2019 4 Xinjiang, Xizang, Qinghai, Sichuan 0 2020 5 Xinjiang, Xizang, Qinghai, Gansu, Sichuan 0 2021 5 Xinjiang, Xizang, Qinghai, Gansu, Sichuan 0 2022 5 Xinjiang, Xizang, Qinghai, Gansu, Sichuan 0 Abbreviation: PLADs=provincial-level administrative divisions. Table 1. Hot and cold spots of measles incidence in China from 2005 to 2022.
Cluster types Year PLADs High-prevalence cluster areas 2005–2008 Xinjiang, Qinghai, Xizang, Gansu, Ningxia, Inner Mongolia, Sichuan, Shaanxi, Shanxi, Chongqing, Hebei, Beijing, Henan, Yunnan, Tianjin. Low-prevalence cluster areas 2016–2022 Guangxi, Hainan, Guizhou, Guangdong, Yunnan, Hunan, Chongqing, Sichuan, Jiangxi, Hubei, Fujian, Shaanxi, Anhui. Abbreviation: PLADs=provincial-level administrative divisions. Table 2. Spatiotemporal scan analysis of measles incidence in China from 2005 to 2022.
-
Our study demonstrated a decline in the overall incidence of measles in China from 2005 to 2022, with the most significant reductions occurring during 2008–2011 and 2015–2022. In recent years, spatial clustering of measles has become considerably less evident.
Vaccination is a fundamental measure for measles eradication. In addition to maintaining high routine immunization coverage, China has conducted multiple rounds of supplementary immunization activities (SIAs) for children aged 8 months to 14 years, tailored to the epidemiology of each province. A unified nationwide SIA was implemented in 2010 to address immunization gaps (3,9). Following these efforts, the measles incidence in China exhibited a rapid decline during 2008–2011. Furthermore, China has incorporated sensitive and high-quality epidemiological and laboratory-based surveillance as key components of its comprehensive measles elimination strategy. Despite periodic fluctuations, measles incidence decreased consistently from 2015 to 2022.
In recent years, amidst a resurgence in global measles outbreaks (10–11), China has maintained high coverage with two doses of MCV. Immunization programs at all levels have made significant efforts to vaccinate children who missed their doses during the coronavirus disease 2019 (COVID-19) pandemic, preventing the accumulation of susceptible populations. As a result of these proactive measures, the COVID-19 pandemic has not led to an increase in measles incidence in China (12). Furthermore, non-pharmaceutical interventions implemented during the COVID-19 pandemic may have indirectly reduced measles transmission, supporting efforts toward measles elimination. In 2022, China achieved its lowest recorded incidence of measles, indicating substantial progress toward elimination.
Challenges remain in the quest to eliminate measles. Throughout the analysis period, hotspots were predominantly concentrated in western provinces, particularly in Xinjiang, Xizang and Qinghai. This trend suggests that although measles does not cluster nationwide, incidence rates are higher in western China compared to other regions. Western China’s vast territories, complex terrains, and large catchment areas for primary immunization services present logistical challenges for vaccine cold chain transportation and storage. These difficulties may undermine routine immunization programs and lead to renewed measles transmission (13). To address this, efforts should focus on enhancing primary immunization service capacity and strengthening weak areas of the program to ensure high routine coverage with two timely MCV doses, thereby reducing population susceptibility to measles.
Infants under eight months of age are generally susceptible to measles virus infection. In China, the first dose of the measles vaccine is administered at eight months, which is younger than the WHO-recommended age of nine months. Most infants acquire temporary passive protection from maternal measles antibodies transferred during gestation; however, maternal antibody levels significantly decrease by three months of age. This reduction results in minimal immunity in the months leading up to the first vaccine dose, placing these infants at risk of infection (14). Infants are indirectly protected when the incidence of measles is very low, but their susceptibility increases the risk of infection if measles circulates in the community. Therefore, maintaining high vaccination coverage to sustain population immunity is crucial for protecting children under eight months of age.
Recent surveillance data indicate that the majority of cases in children aged 8–23 months have a history of MCV immunization. Genotype analysis shows that the proportion of H1 genotype cases detected in 2018 was 89.8% (274/305), plummeting to 10.9% (30/275) in 2019 (9). No native H1 genotype cases were detected from 2020 onward, and all cases reported in 2021–2022 were associated with the vaccine-related A genotype (5,15). This suggests that many of these cases may be vaccine-associated rash illnesses rather than actual measles cases. This finding aligns with the absence of global spatial or temporal clustering of measles in recent years, given that the A genotype cannot transmit and cause epidemics. Therefore, it is crucial to promptly adjust and enhance the measles monitoring program, improve the diagnosis of vaccine-associated rash illnesses, and align with ongoing measles elimination efforts.
Additionally, due to the highly contagious nature of measles, any epidemic worldwide poses a threat to China's efforts to eliminate the disease. Thus, China must prevent recurring domestic outbreaks and enhance monitoring of imported cases.
The study is subject to several limitations. First, as measles is a respiratory-transmitted disease, using provincial administrative divisions as spatial units for spatial clustering analyses might underestimate the clustering and fail to identify some localized outbreaks or epidemics. Second, some data used in this study are from the years immediately following the 2004 implementation of China’s infectious disease reporting information management system. During the early stages of the system’s development, there may have been information biases such as underreporting or misreporting.
In conclusion, measles surveillance data from 2005 to 2022 indicate that China has achieved moderate success in measles control, offering valuable insights for developing countries and bolstering global confidence in measles elimination. To sustain progress, it is crucial to maintain high two-dose MCV coverage among children, enhance prevention and control measures in high-risk populations and regions, improve the diagnosis of vaccine-associated rash illnesses, and continuously advance efforts toward measles elimination.
-
No conflicts of interest.
HTML
| Citation: |

|