Advanced Search

Preplanned Studies: Pathogenic Surveillance of Foodborne Illness-Related Diarrhea — Beijing Municipality, China, 2013–2023

View author affiliation
  • Summary

    What is already known about this topic?

    Foodborne diseases present a significant public health concern, particularly in China, where they represent a significant food safety challenge. Currently, there is a need for a thorough and systematic analysis of the extended epidemiological patterns of foodborne diseases in Beijing Municipality.

    What is added by this report?

    Monitoring results show that Norovirus and diarrheagenic Escherichia coli (DEC) are the most commonly identified foodborne diarrheal pathogens. Individuals aged 19–30 are at a higher risk of foodborne diarrhea in Beijing, with Salmonella infection being associated with fever symptoms.

    What are the implications for public health practice?

    This study analyzes 11 years of consecutive monitoring data to enhance understanding of the epidemiological and clinical features of foodborne diarrhea in Beijing. It aims to identify high-risk populations, assist in clinical pathogen identification and treatment, and support the development of tailored preventive strategies.

  • loading...
  • [1] Pigott DC. Foodborne illness. Emerg Med Clin North Am 2008;26(2):475 − 97. https://doi.org/10.1016/j.emc.2008.01.009CrossRef
    [2] Liu JK, Luo BZ, Zhou YJ, Ma XC, Liang JH, Sang XL, et al. Prevalence and distribution of acute gastrointestinal illness in the community of China: a population-based face-to-face survey, 2014-2015. BMC Public Health 2023;23(1):836. https://doi.org/10.1186/s12889-023-15337-zCrossRef
    [3] Lu DL, Liu JK, Liu H, Guo YC, Dai Y, Liang JH, et al. Epidemiological features of foodborne disease outbreaks in catering service facilities-China, 2010-2020. China CDC Wkly 2023;5(22):479 − 84. https://doi.org/10.46234/ccdcw2023.091CrossRef
    [4] Gong XH, Wu HY, Li J, Xiao WJ, Zhang X, Chen M, et al. Epidemiology, aetiology and seasonality of infectious diarrhoea in adult outpatients through active surveillance in Shanghai, China, 2012-2016: a cross-sectional study. BMJ Open 2018;8(9):e019699. https://doi.org/10.1136/bmjopen-2017-019699CrossRef
    [5] Qi XJ, Alifu X, Chen J, Luo WL, Wang JK, Yu YX, et al. Descriptive study of foodborne disease using disease monitoring data in Zhejiang Province, China, 2016-2020. BMC Public Health 2022;22(1):1831. https://doi.org/10.1186/s12889-022-14226-1CrossRef
    [6] Zhu X, Jin M, Duan ZJ. Research progress on the epidemiology and disease burden of norovirus. Dis Surveill 2021;36(8):769 − 73. https://doi.org/10.3784/jbjc.202106230362CrossRef
    [7] Ray LC, Collins JP, Griffin PM, Shah HJ, Boyle MM, Cieslak PR, et al. Decreased incidence of infections caused by pathogens transmitted commonly through food during the COVID-19 pandemic-foodborne diseases active surveillance network, 10 U.S. Sites, 2017-2020. MMWR Morb Mortal Wkly Rep 2021;70(38):1332-6. http://dx.doi.org/10.15585/mmwr.mm7038a4.
    [8] Chang ZR, Zhang J, Ran L, Sun JL, Liu FF, Luo L, et al. The changing epidemiology of bacillary dysentery and characteristics of antimicrobial resistance of Shigella isolated in China from 2004-2014. BMC Infect Dis 2016;16(1):685. https://doi.org/10.1186/s12879-016-1977-1CrossRef
    [9] Li J, Pan H, Xiao WJ, Gong XH, Zhuang Y, Kuang XZ, et al. Epidemiological and etiological surveillance study of infectious diarrhea in Shanghai in 2013-2015. Chin J Prev Med 2017;51(12):1113 − 7. https://doi.org/10.3760/cma.j.issn.0253-9624.2017.12.012CrossRef
    [10] Dewey-Mattia D, Manikonda K, Hall AJ, Wise ME, Crowe SJ. Surveillance for foodborne disease outbreaks-United States, 2009-2015. MMWR Surveill Summ 2018;67(10):1 − 11. https://doi.org/10.15585/mmwr.ss6710a1CrossRef
  • FIGURE 1.  Changes in the numbers of positive pathogens and detection rates by pathogen and season in Beijing Municipality, China, from 2013 to 2023. (A) Norovirus; (B) DEC; (C) Salmonella; (D) Vibrio parahaemolyticus; (E) Shigella.

    Abbreviation: DEC=diarrhoeagenic Escherichia coli.

    FIGURE 2.  Distribution of suspicious food categories by pathogens in Beijing Municipality, China, 2013–2023.

    Abbreviation: DEC=diarrhoeagenic Escherichia coli.

    TABLE 1.  Variations in demographic characteristics of foodborne diarrhea patients over select time periods in Beijing Municipality, China, 2013–2023, n (%).

    Variables Total Norovirus P value DEC P value Salmonella P value Vibrio parahaemolyticus P value
    2013–
    2023
    2013–
    2017
    2018–
    2023
    2013–
    2017
    2018–
    2023
    2013–
    2017
    2018–
    2023
    2013–
    2017
    2018–
    2023
    Total 10,469 888 1,590 1,671 2,353 948 1,312 1,140 671
    Age, years 0.003 <0.001 <0.001 <0.001
    ≤3 873
    (8.34)
    98
    (11.04)
    156
    (9.81)
    131
    (7.84)
    214
    (9.09)
    73
    (7.70)
    219
    (16.70)
    4
    (0.35)
    2
    (0.36)
    4–18 674
    (6.44)
    61
    (6.87)
    83
    (5.22)
    77
    (4.61)
    176
    (7.48)
    63
    (6.65)
    131
    (9.98)
    39
    (3.42)
    21
    (3.13)
    19–30 2,971
    (28.38)
    292
    (32.89)
    466
    (29.31)
    498
    (29.80)
    571
    (24.27)
    236
    (24.90)
    236
    (17.99)
    467
    (40.96)
    239
    (35.62)
    31–40 2,303
    (22.00)
    179
    (20.16)
    405
    (25.47)
    325
    (19.45)
    565
    (24.01)
    179
    (18.89)
    212
    (16.16)
    268
    (23.51)
    223
    (33.23)
    41–50 1,100
    (10.51)
    75
    (8.45)
    156
    (9.81)
    165
    (9.87)
    246
    (10.45)
    129
    (13.61)
    132
    (10.06)
    147
    (12.89)
    75
    (11.18)
    51–60 1,038
    (9.91)
    98
    (11.04)
    113
    (7.11)
    214
    (12.81)
    213
    (9.05)
    101
    (10.65)
    144
    (10.98)
    97
    (8.51)
    61
    (9.09)
    ≥60 1,510
    (14.42)
    85
    (9.57)
    211
    (13.27)
    261
    (15.62)
    368
    (15.64)
    167
    (17.62)
    238
    (18.14)
    118
    (10.35)
    50
    (7.45)
    Sex 0.934 0.210 0.492 0.535
    Male 5,759
    (55.00)
    492
    (55.41)
    913
    (57.42)
    887
    (53.08)
    1,296
    (55.08)
    497
    (52.43)
    707
    (55.89)
    644
    (56.49)
    369
    (55.00)
    Female 4,710
    (45.00)
    396
    (44.59)
    677
    (42.58)
    784
    (46.92)
    1,057
    (44.92)
    451
    (47.57)
    605
    (46.11)
    496
    (43.51)
    302
    (45.00)
    Area <0.001 0.262 0.003 0.005
    Urban 4,250
    (40.81)
    314
    (35.36)
    706
    (45.23)
    716
    (42.85)
    953
    (40.69)
    355
    (37.45)
    583
    (44.54)
    474
    (41.58)
    257
    (38.36)
    Suburbs 4,018
    (38.59)
    403
    (45.38)
    637
    (40.81)
    557
    (33.33)
    784
    (33.48)
    400
    (42.19)
    486
    (37.13)
    444
    (38.95)
    310
    (46.27)
    Outskirts 2,145
    (20.60)
    171
    (19.26)
    218
    (13.97)
    398
    (23.82)
    605
    (25.83)
    193
    (20.36)
    240
    (18.33)
    222
    (19.47)
    103
    (15.37)
    Occupation 0.002 <0.001 <0.001 0.022
    Official staff 2,438
    (23.29)
    222
    (25.00)
    471
    (29.62)
    367
    (21.96)
    515
    (21.89)
    181
    (19.09)
    159
    (15.59)
    295
    (25.88)
    188
    (28.02)
    Unemployed 2,262
    (21.61)
    151
    (17.00)
    303
    (19.06)
    388
    (23.22)
    450
    (19.12)
    224
    (23.63)
    219
    (21.47)
    328
    (28.77)
    175
    (26.08)
    Student 987
    (9.43)
    97
    (10.92)
    169
    (10.63)
    139
    (8.32)
    259
    (11.01)
    71
    (7.49)
    79
    (7.75)
    80
    (7.02)
    33
    (4.92)
    Children 1,048
    (10.01)
    102
    (11.49)
    176
    (11.07)
    137
    (8.20)
    255
    (10.84)
    102
    (10.76)
    279
    (21.27)
    14
    (1.23)
    2
    (0.35)
    Worker 663
    (6.33)
    55
    (6.19)
    77
    (4.84)
    102
    (6.10)
    149
    (6.33)
    57
    (6.01)
    69
    (5.26)
    102
    (8.95)
    71
    (10.58)
    Retirees 1,168
    (11.16)
    83
    (9.35)
    169
    (10.63)
    253
    (15.14)
    284
    (12.07)
    113
    (11.92)
    159
    (12.19)
    85
    (7.46)
    38
    (5.67)
    Others 1,903
    (18.18)
    178
    (20.05)
    225
    (14.15)
    285
    (17.06)
    441
    (18.74)
    200
    (21.10)
    195
    (14.86)
    236
    (20.70)
    164
    (24.44)
    Abbreviation: DEC=diarrhoeagenic Escherichia coli.
    Download: CSV

    TABLE 2.  Reported signs and symptoms of patients infected with different pathogens in Beijing Municipality, China, 2013–2023, n (%).

    Variables Total Norovirus DEC Salmonella Vibrio parahaemolyticus P value*
    2013–
    2023
    Total 2013–
    2017
    2018–
    2023
    Total 2013–
    2017
    2018–
    2023
    Total 2013–
    2017
    2018–
    2023
    Total 2013–
    2017
    2018–
    2023
    Total 10,469 2,478 888 1,590 4,024 1,671 2,353 2,260 948 1,312 1,811 1,140 671
    Clinical symptom
    Nausea 4,778
    (45.64)
    1,265
    (51.05)
    487
    (54.84)
    778
    (48.93)
    1,654
    (41.10)
    779
    (46.62)
    875
    (37.19)
    856
    (37.88)
    401
    (42.30)
    455
    (34.68)
    1,143
    (63.11)
    727
    (63.77)
    416
    (62.00)
    <0.001
    Vomiting 3,023
    (28.88)
    965
    (38.94)
    354
    (39.86)
    611
    (38.43)
    936
    (23.26)
    414
    (24.78)
    522
    (22.18)
    469
    (20.75)
    208
    (21.94)
    261
    (19.89)
    771
    (42.57)
    493
    (43.25)
    278
    (41.43)
    <0.001
    Abdominal cramps 5,542
    (52.94)
    1,123
    (45.32)
    477
    (53.72)
    646
    (40.63)
    2,123
    (53.76)
    1,061
    (63.49)
    1,062
    (45.13)
    1,142
    (50.53)
    603
    (63.61)
    539
    (41.08)
    1,224
    (67.59)
    842
    (73.86)
    382
    (56.93)
    <0.001
    Fever
    (≥37.5 °C)
    2,481
    (23.70)
    452
    (18.24)
    201
    (22.64)
    251
    (15.79)
    783
    (19.46)
    424
    (25.37)
    359
    (15.26)
    814
    (36.02)
    357
    (37.66)
    457
    (34.83)
    400
    (22.09)
    281
    (24.65)
    119
    (17.73)
    <0.001
    Dehydration 785
    (7.50)
    223
    (9.00)
    88
    (9.91)
    135
    (8.49)
    208
    (5.17)
    102
    (6.10)
    106
    (4.50)
    188
    (8.32)
    89
    (9.39)
    99
    (7.55)
    176
    (9.72)
    119
    (10.44)
    57
    (8.49)
    <0.001
    Thirsty 1,365
    (13.04)
    245
    (9.89)
    143
    (16.10)
    102
    (6.42)
    288
    (7.16)
    169
    (10.11)
    119
    (5.06)
    196
    (8.67)
    136
    (14.35)
    60
    (4.57)
    207
    (11.43)
    163
    (14.30)
    44
    (6.56)
    <0.001
    Fatigue 1,253
    (13.67)
    302
    (12.19)
    118
    (13.29)
    184
    (11.57)
    453
    (11.26)
    212
    (12.69)
    241
    (10.24)
    291
    (12.88)
    159
    (16.77)
    132
    (10.06)
    326
    (18.00)
    236
    (20.70)
    90
    (13.41)
    <0.001
    Chills 54
    (0.52)
    8
    (0.32)
    5
    (0.56)
    3
    (0.19)
    9
    (0.22)
    2
    (0.12)
    7
    (0.30)
    13
    (0.58)
    4
    (0.42)
    9
    (0.69)
    26
    (1.44)
    17
    (1.49)
    9
    (1.34)
    <0.001
    Diarrhea frequency ≥10/24 h 2,037
    (19.46)
    433
    (17.48)
    144
    (16.22)
    289
    (18.18)
    683
    (16.97)
    277
    (16.58)
    406
    (17.25)
    583
    (25.80)
    227
    (23.95)
    356
    (27.13)
    341
    (18.83)
    202
    (17.72)
    139
    (20.72)
    <0.001
    Diarrhea
    Watery stool 5,936
    (56.70)
    1,464
    (59.08)
    510
    (57.43)
    954
    (60.00)
    2,082
    (51.74)
    951
    (56.91)
    1,131
    (48.07)
    1,324
    (58.58)
    584
    (61.60)
    740
    (56.40)
    1,159
    (64.00)
    773
    (67.81)
    386
    (57.53)
    <0.001
    Loose stool 3,335
    (31.86)
    824
    (33.25)
    251
    (28.27)
    573
    (36.04)
    1,468
    (36.48)
    388
    (23.22)
    1,080
    (45.90)
    650
    (28.76)
    175
    (18.46)
    475
    (36.20)
    428
    (23.63)
    191
    (16.75)
    237
    (35.32)
    0.690
    Mucus stool 518
    (4.95)
    88
    (3.56)
    54
    (6.08)
    34
    (2.14)
    175
    (4.35)
    108
    (6.46)
    67
    (2.85)
    146
    (6.46)
    88
    (9.28)
    58
    (4.42)
    94
    (5.19)
    68
    (5.96)
    26
    (3.87)
    0.990
    Rice-water stool 75
    (0.72)
    12
    (0.48)
    9
    (1.01)
    3
    (0.19)
    50
    (1.24)
    47
    (2.81)
    3
    (0.13)
    6
    (0.27)
    5
    (0.53)
    1
    (0.08)
    7
    (0.39)
    5
    (0.44)
    2
    (0.30)
    <0.001
    Pus and blood stool 66
    (0.63)
    5
    (0.20)
    1
    (0.11)
    4
    (0.25)
    24
    (0.60)
    14
    (0.84)
    10
    (0.42)
    17
    (0.75)
    9
    (0.95)
    8
    (0.61)
    18
    (1.00)
    11
    (0.96)
    7
    (1.04)
    0.137
    Abbreviation: DEC=diarrhoeagenic Escherichia coli.
    Download: CSV

Citation:

通讯作者: 陈斌, bchen63@163.com
  • 1. 

    沈阳化工大学材料科学与工程学院 沈阳 110142

  1. 本站搜索
  2. 百度学术搜索
  3. 万方数据库搜索
  4. CNKI搜索
Turn off MathJax
Article Contents

Article Metrics

Article views(470) PDF downloads(9) Cited by()

Share

Related

Pathogenic Surveillance of Foodborne Illness-Related Diarrhea — Beijing Municipality, China, 2013–2023

View author affiliation

Summary

What is already known about this topic?

Foodborne diseases present a significant public health concern, particularly in China, where they represent a significant food safety challenge. Currently, there is a need for a thorough and systematic analysis of the extended epidemiological patterns of foodborne diseases in Beijing Municipality.

What is added by this report?

Monitoring results show that Norovirus and diarrheagenic Escherichia coli (DEC) are the most commonly identified foodborne diarrheal pathogens. Individuals aged 19–30 are at a higher risk of foodborne diarrhea in Beijing, with Salmonella infection being associated with fever symptoms.

What are the implications for public health practice?

This study analyzes 11 years of consecutive monitoring data to enhance understanding of the epidemiological and clinical features of foodborne diarrhea in Beijing. It aims to identify high-risk populations, assist in clinical pathogen identification and treatment, and support the development of tailored preventive strategies.

  • 1. Institute for Nutrition and Food Hygiene, Beijing Center for Disease Prevention and Control, Beijing, China
  • Corresponding author:

    Xiaochen Ma, xiaoch-ma@126.com

    Online Date: June 14 2024
    Issue Date: June 14 2024
    doi: 10.46234/ccdcw2024.111
  • Foodborne illnesses caused by various microorganisms, such as viruses, bacteria, and parasites (1), pose a significant global public health threats, leading to widespread illness and mortality. A survey conducted on the burden of acute gastrointestinal infections (AGI) in China between 2014 and 2015 revealed a population prevalence of 2.3% with an annual incidence of 0.3 episodes per person (2). Over the decade from 2010 to 2020, there were 18,331 reported outbreaks in Chinese catering facilities, resulting in 206,718 illnesses, 68,561 hospitalizations, and 201 fatalities (3). The Beijing CDC initiated a foodborne disease surveillance system in 2013, gradually implementing city-wide population-based surveillance. This study examined data from 36 actively monitored hospitals (25 tertiary-level and 11 secondary-level hospitals) selected through probability proportional to size (PPS) sampling from all hospitals with enteric disease clinics across 16 districts in Beijing Municipality, China.

    Patients included in the surveillance were those who visited the sentinel hospital with symptoms of suspected foodborne diarrhea, presenting with over three bowel movements in 24 hours and abnormal stool consistency (e.g., loose, liquid, mucous, or bloody stools), excluding cases linked to antibiotic use or chemical exposure. Surveillance was carried out year-round, with each district aiming to collect a minimum of 330 samples annually.

    Fresh stool specimens were collected either in fecal containers or rectal swabs, which were then placed in Cary-Blair transport medium for testing within 24 hours at 4°C (samples for Vibrio parahaemolyticus were stored at room temperature). Virus detection samples not immediately sent were stored at −20 °C. Bacterial specimens were enriched, inoculated onto suitable media for culture, and then isolated. Virus detection was conducted through nucleic acid amplification using reverse transcription-polymerase chain reaction (RT-PCR).

    The 36 sentinel hospitals were responsible for gathering demographic information, food history, clinical characteristics, and biological samples from individuals under surveillance. A total of 16 district CDC laboratories tested these specimens for major foodborne pathogens: Salmonella, Vibrio parahaemolyticus, diarrheagenic Escherichia coli (DEC), Shigella, and Norovirus. The detection results were then sent to higher authorities for confirmation. Surveillance data indicated that Norovirus and DEC were the predominant pathogens, individuals between 19 and 30 years old had the highest infection rates, and patients with Salmonella infections were more likely to experience fever symptoms.

    Summary statistics, including frequencies and proportions, were computed for categorical variables. The study period was stratified into two time frames, 2013–2017 and 2018–2023, due to changes in testing practices at sentinel hospitals in 2018. The chi-square test was employed to compare demographic characteristics (age, sex, area, and occupation) for four pathogens (Salmonella, Norovirus, Vibrio parahaemolyticus, and DEC); Shigella was excluded due to a limited sample size. Fisher’s exact test was used if the conditions for the chi-square test were not met. All tests were two-sided, and a significance level of P<0.05 was considered statistically significant.

    From January 1, 2013, to December 31, 2023, a total of 60,223 patients were included in the Beijing Foodborne Disease Active Surveillance System. After excluding non-infectious diarrhea cases and those without biological samples, 57,021 specimens were analyzed for Salmonella, Shigella, Vibrio parahaemolyticus, DEC, and Norovirus. The detection rates for Salmonella, Shigella, Vibrio parahaemolyticus, and DEC were 3.96% (2,260/57,021), 0.18% (101/57,021), 3.18% (1,811/57,021), and 7.06% (4,024/57,021), respectively. Among the 23,506 specimens tested for Norovirus, the detection rate was 10.54% (2,478/23,506). The prevalent Salmonella serotypes were Salmonella Enteritidis (864/2,260) and Salmonella Typhimurium (340/2,260). Enteroaggregative Escherichia coli (EAEC) and enterotoxigenic Escherichia coli (ETEC) were the most common DEC types, constituting 34.57% (1,391/4,026) and 34.09% (1,372/4,026) of the detected DEC, respectively.

    The trends in detection rates of various pathogens from 2013 to 2023 were analyzed and shown in Figure 1. From 2013 to 2019, Salmonella, DEC, and Norovirus infection rates increased annually, while Shigella infections decreased. Vibrio parahaemolyticus peaked in 2016, followed by a yearly decline. During 2020–2022, all pathogen infection rates decreased due to the impact of the COVID-19 pandemic. However, in 2023, detection rates increased for all pathogens except Shigella. Notably, pathogenic bacteria were most prevalent in summer, with Norovirus causing winter and spring outbreaks.
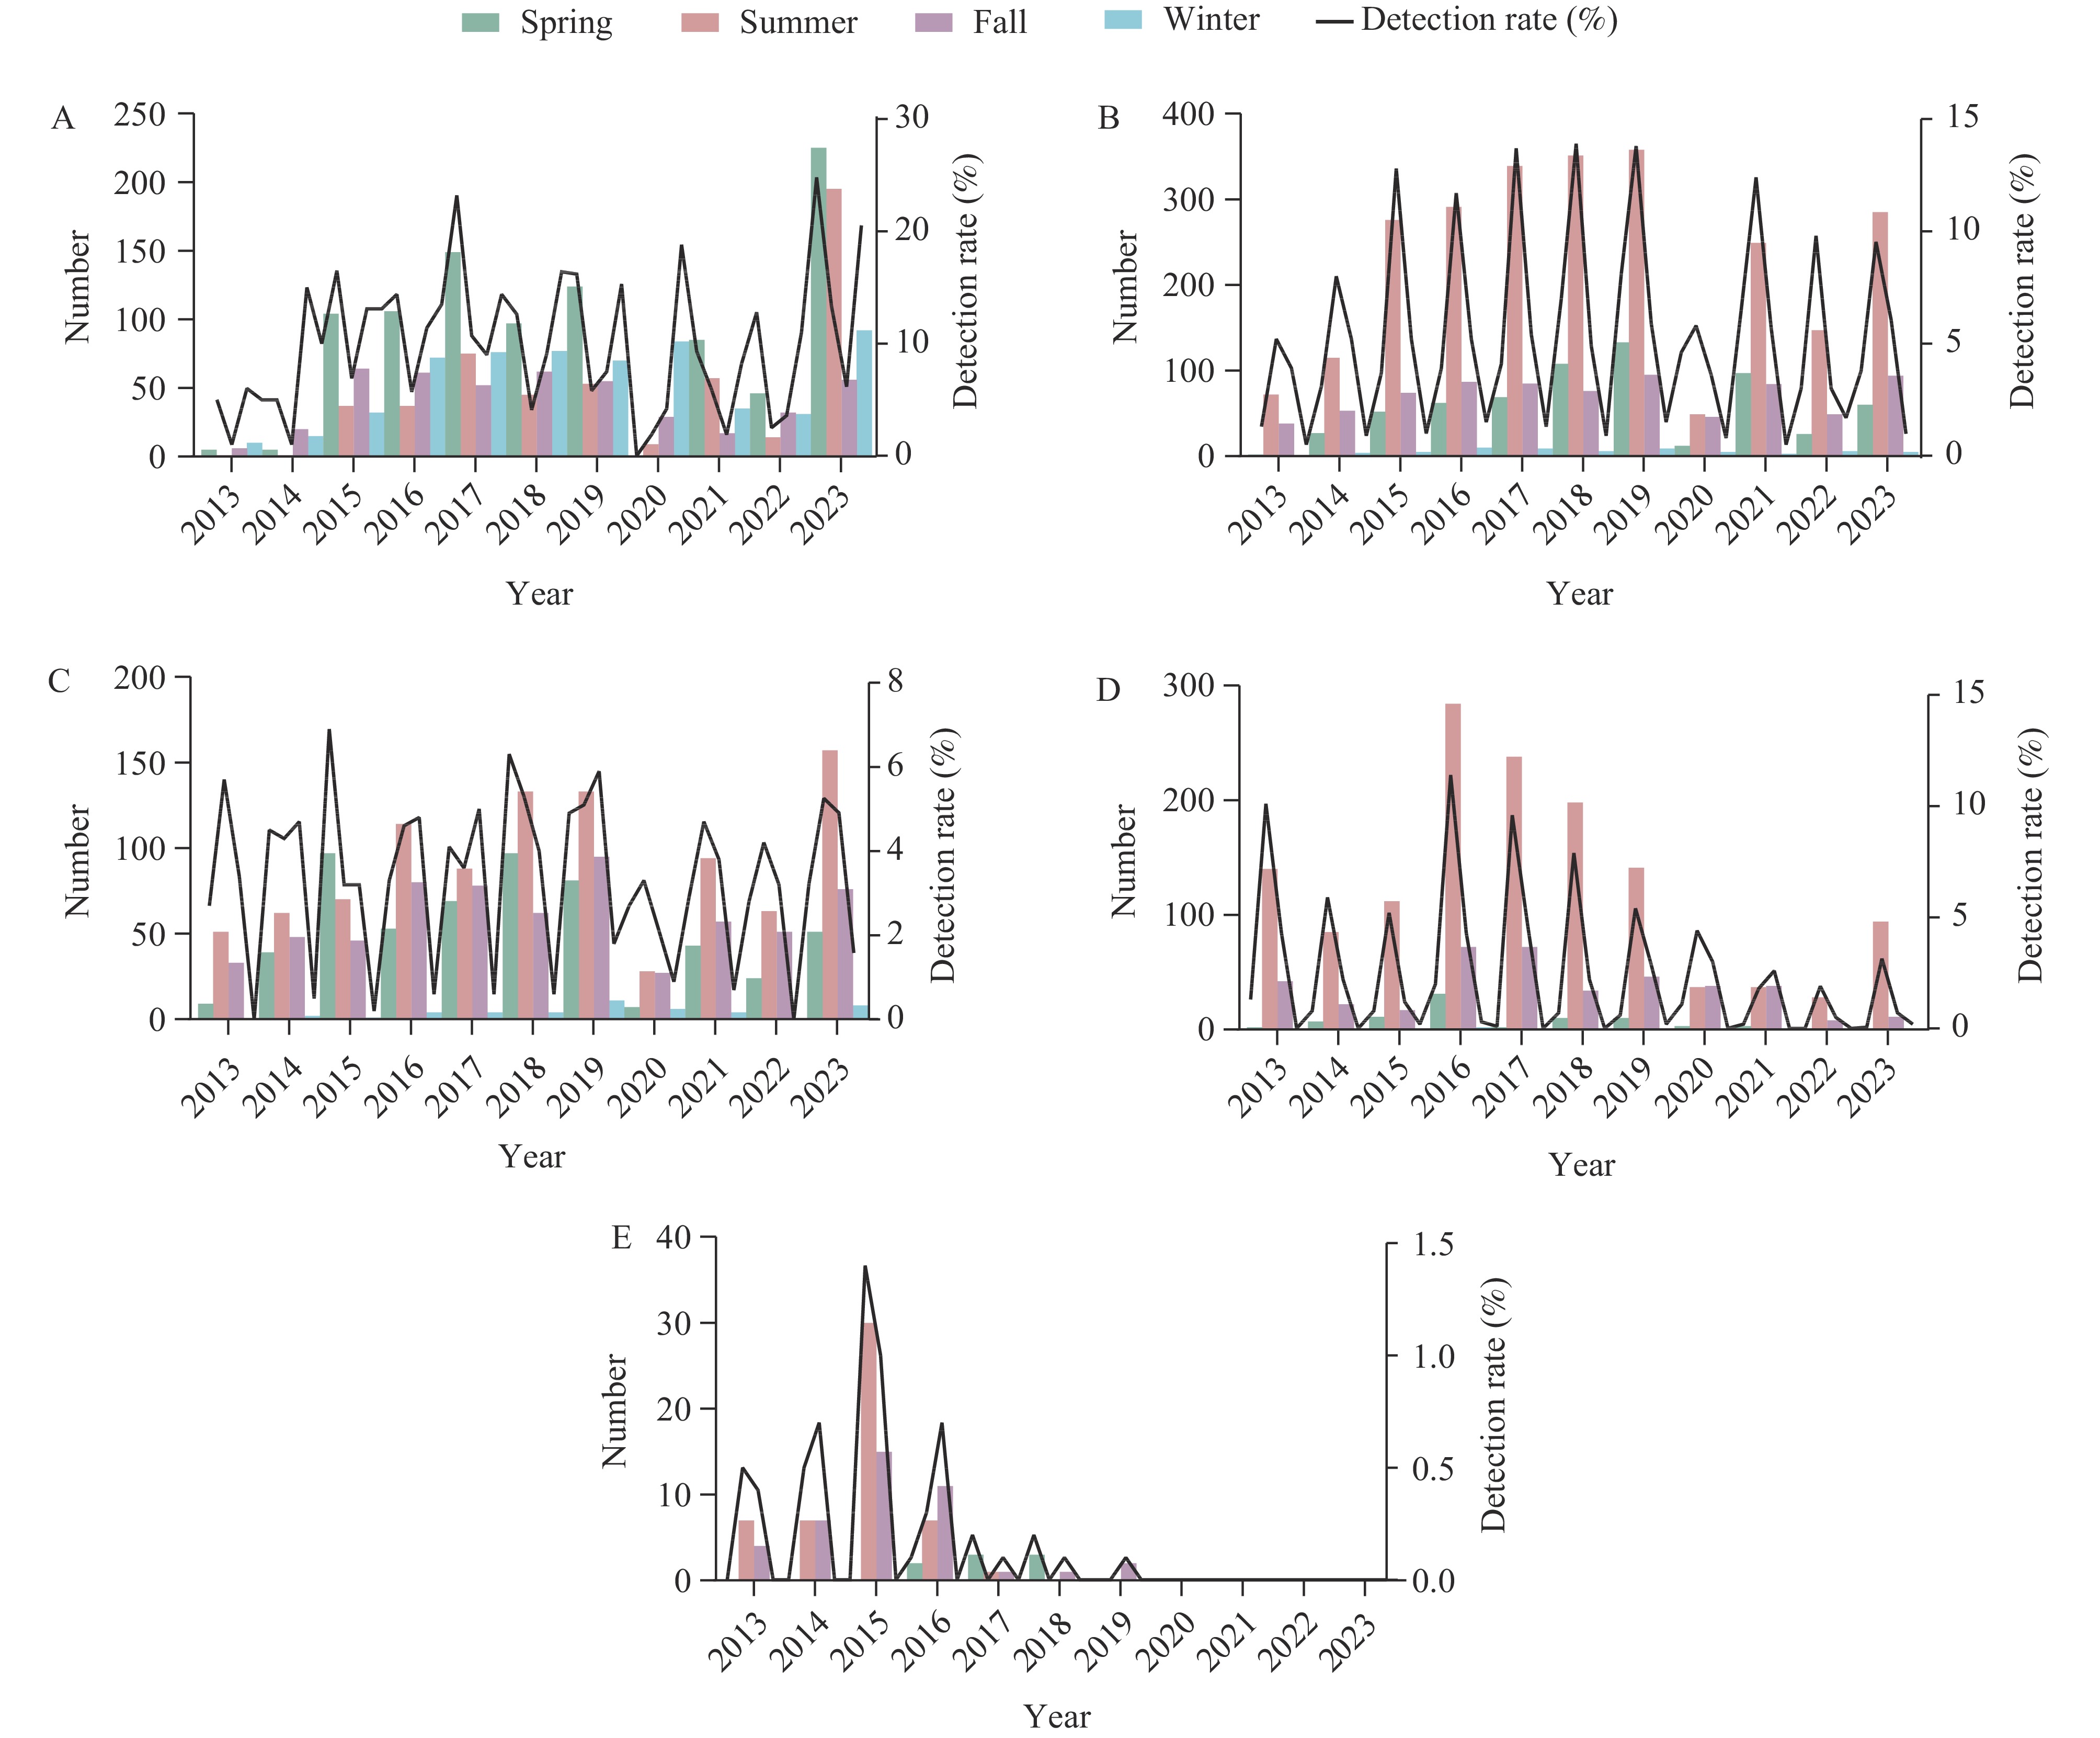
    Figure 1. 

    Changes in the numbers of positive pathogens and detection rates by pathogen and season in Beijing Municipality, China, from 2013 to 2023. (A) Norovirus; (B) DEC; (C) Salmonella; (D) Vibrio parahaemolyticus; (E) Shigella.

    Abbreviation: DEC=diarrhoeagenic Escherichia coli.

    The study provides a summary and comparison of the epidemiological characteristics of pathogens over time (Table 1). A high percentage of patients, 28.38% (2,971/10,469), are aged 19–30 years. The incidence of Vibrio parahaemolyticus infection is significantly lower in children under 3 years old compared to other age groups (P<0.001). Gender ratios of individuals infected with Norovirus, DEC, Salmonella, and Vibrio parahaemolyticus show no significant differences between the periods 2013–2017 and 2018–2023 (P>0.05). However, there are notable disparities in the regional distribution of Norovirus (P<0.001) and Salmonella (P=0.003) infections between these time frames, with urban infections being more common in 2018–2023 compared to 2013–2017. The majority of Norovirus cases involve official staff (25.00%–29.62%), while cases of DEC, Salmonella, and Vibrio parahaemolyticus predominantly affect unemployed individuals (17.00%–28.77%). Significant differences exist in the occupational distribution of infection rates for different pathogens in different periods (P<0.001).

    Variables Total Norovirus P value DEC P value Salmonella P value Vibrio parahaemolyticus P value
    2013–
    2023
    2013–
    2017
    2018–
    2023
    2013–
    2017
    2018–
    2023
    2013–
    2017
    2018–
    2023
    2013–
    2017
    2018–
    2023
    Total 10,469 888 1,590 1,671 2,353 948 1,312 1,140 671
    Age, years 0.003 <0.001 <0.001 <0.001
    ≤3 873
    (8.34)
    98
    (11.04)
    156
    (9.81)
    131
    (7.84)
    214
    (9.09)
    73
    (7.70)
    219
    (16.70)
    4
    (0.35)
    2
    (0.36)
    4–18 674
    (6.44)
    61
    (6.87)
    83
    (5.22)
    77
    (4.61)
    176
    (7.48)
    63
    (6.65)
    131
    (9.98)
    39
    (3.42)
    21
    (3.13)
    19–30 2,971
    (28.38)
    292
    (32.89)
    466
    (29.31)
    498
    (29.80)
    571
    (24.27)
    236
    (24.90)
    236
    (17.99)
    467
    (40.96)
    239
    (35.62)
    31–40 2,303
    (22.00)
    179
    (20.16)
    405
    (25.47)
    325
    (19.45)
    565
    (24.01)
    179
    (18.89)
    212
    (16.16)
    268
    (23.51)
    223
    (33.23)
    41–50 1,100
    (10.51)
    75
    (8.45)
    156
    (9.81)
    165
    (9.87)
    246
    (10.45)
    129
    (13.61)
    132
    (10.06)
    147
    (12.89)
    75
    (11.18)
    51–60 1,038
    (9.91)
    98
    (11.04)
    113
    (7.11)
    214
    (12.81)
    213
    (9.05)
    101
    (10.65)
    144
    (10.98)
    97
    (8.51)
    61
    (9.09)
    ≥60 1,510
    (14.42)
    85
    (9.57)
    211
    (13.27)
    261
    (15.62)
    368
    (15.64)
    167
    (17.62)
    238
    (18.14)
    118
    (10.35)
    50
    (7.45)
    Sex 0.934 0.210 0.492 0.535
    Male 5,759
    (55.00)
    492
    (55.41)
    913
    (57.42)
    887
    (53.08)
    1,296
    (55.08)
    497
    (52.43)
    707
    (55.89)
    644
    (56.49)
    369
    (55.00)
    Female 4,710
    (45.00)
    396
    (44.59)
    677
    (42.58)
    784
    (46.92)
    1,057
    (44.92)
    451
    (47.57)
    605
    (46.11)
    496
    (43.51)
    302
    (45.00)
    Area <0.001 0.262 0.003 0.005
    Urban 4,250
    (40.81)
    314
    (35.36)
    706
    (45.23)
    716
    (42.85)
    953
    (40.69)
    355
    (37.45)
    583
    (44.54)
    474
    (41.58)
    257
    (38.36)
    Suburbs 4,018
    (38.59)
    403
    (45.38)
    637
    (40.81)
    557
    (33.33)
    784
    (33.48)
    400
    (42.19)
    486
    (37.13)
    444
    (38.95)
    310
    (46.27)
    Outskirts 2,145
    (20.60)
    171
    (19.26)
    218
    (13.97)
    398
    (23.82)
    605
    (25.83)
    193
    (20.36)
    240
    (18.33)
    222
    (19.47)
    103
    (15.37)
    Occupation 0.002 <0.001 <0.001 0.022
    Official staff 2,438
    (23.29)
    222
    (25.00)
    471
    (29.62)
    367
    (21.96)
    515
    (21.89)
    181
    (19.09)
    159
    (15.59)
    295
    (25.88)
    188
    (28.02)
    Unemployed 2,262
    (21.61)
    151
    (17.00)
    303
    (19.06)
    388
    (23.22)
    450
    (19.12)
    224
    (23.63)
    219
    (21.47)
    328
    (28.77)
    175
    (26.08)
    Student 987
    (9.43)
    97
    (10.92)
    169
    (10.63)
    139
    (8.32)
    259
    (11.01)
    71
    (7.49)
    79
    (7.75)
    80
    (7.02)
    33
    (4.92)
    Children 1,048
    (10.01)
    102
    (11.49)
    176
    (11.07)
    137
    (8.20)
    255
    (10.84)
    102
    (10.76)
    279
    (21.27)
    14
    (1.23)
    2
    (0.35)
    Worker 663
    (6.33)
    55
    (6.19)
    77
    (4.84)
    102
    (6.10)
    149
    (6.33)
    57
    (6.01)
    69
    (5.26)
    102
    (8.95)
    71
    (10.58)
    Retirees 1,168
    (11.16)
    83
    (9.35)
    169
    (10.63)
    253
    (15.14)
    284
    (12.07)
    113
    (11.92)
    159
    (12.19)
    85
    (7.46)
    38
    (5.67)
    Others 1,903
    (18.18)
    178
    (20.05)
    225
    (14.15)
    285
    (17.06)
    441
    (18.74)
    200
    (21.10)
    195
    (14.86)
    236
    (20.70)
    164
    (24.44)
    Abbreviation: DEC=diarrhoeagenic Escherichia coli.

    Table 1.  Variations in demographic characteristics of foodborne diarrhea patients over select time periods in Beijing Municipality, China, 2013–2023, n (%).

    Figure 2 displays patient self-reports, indicating that meat products were the most commonly reported source of suspected exposure among the four pathogens analyzed, accounting for 22.64%. However, there were differences in the distribution of suspicious food categories across the various pathogens. For Vibrio parahaemolyticus infections, aquatic products were the primary food source at 26.06%, followed by meat products at 24.74% and vegetables at 15.74%. Conversely, patients infected with Norovirus, Salmonella, and DEC identified meat products and vegetables as the top two food sources.
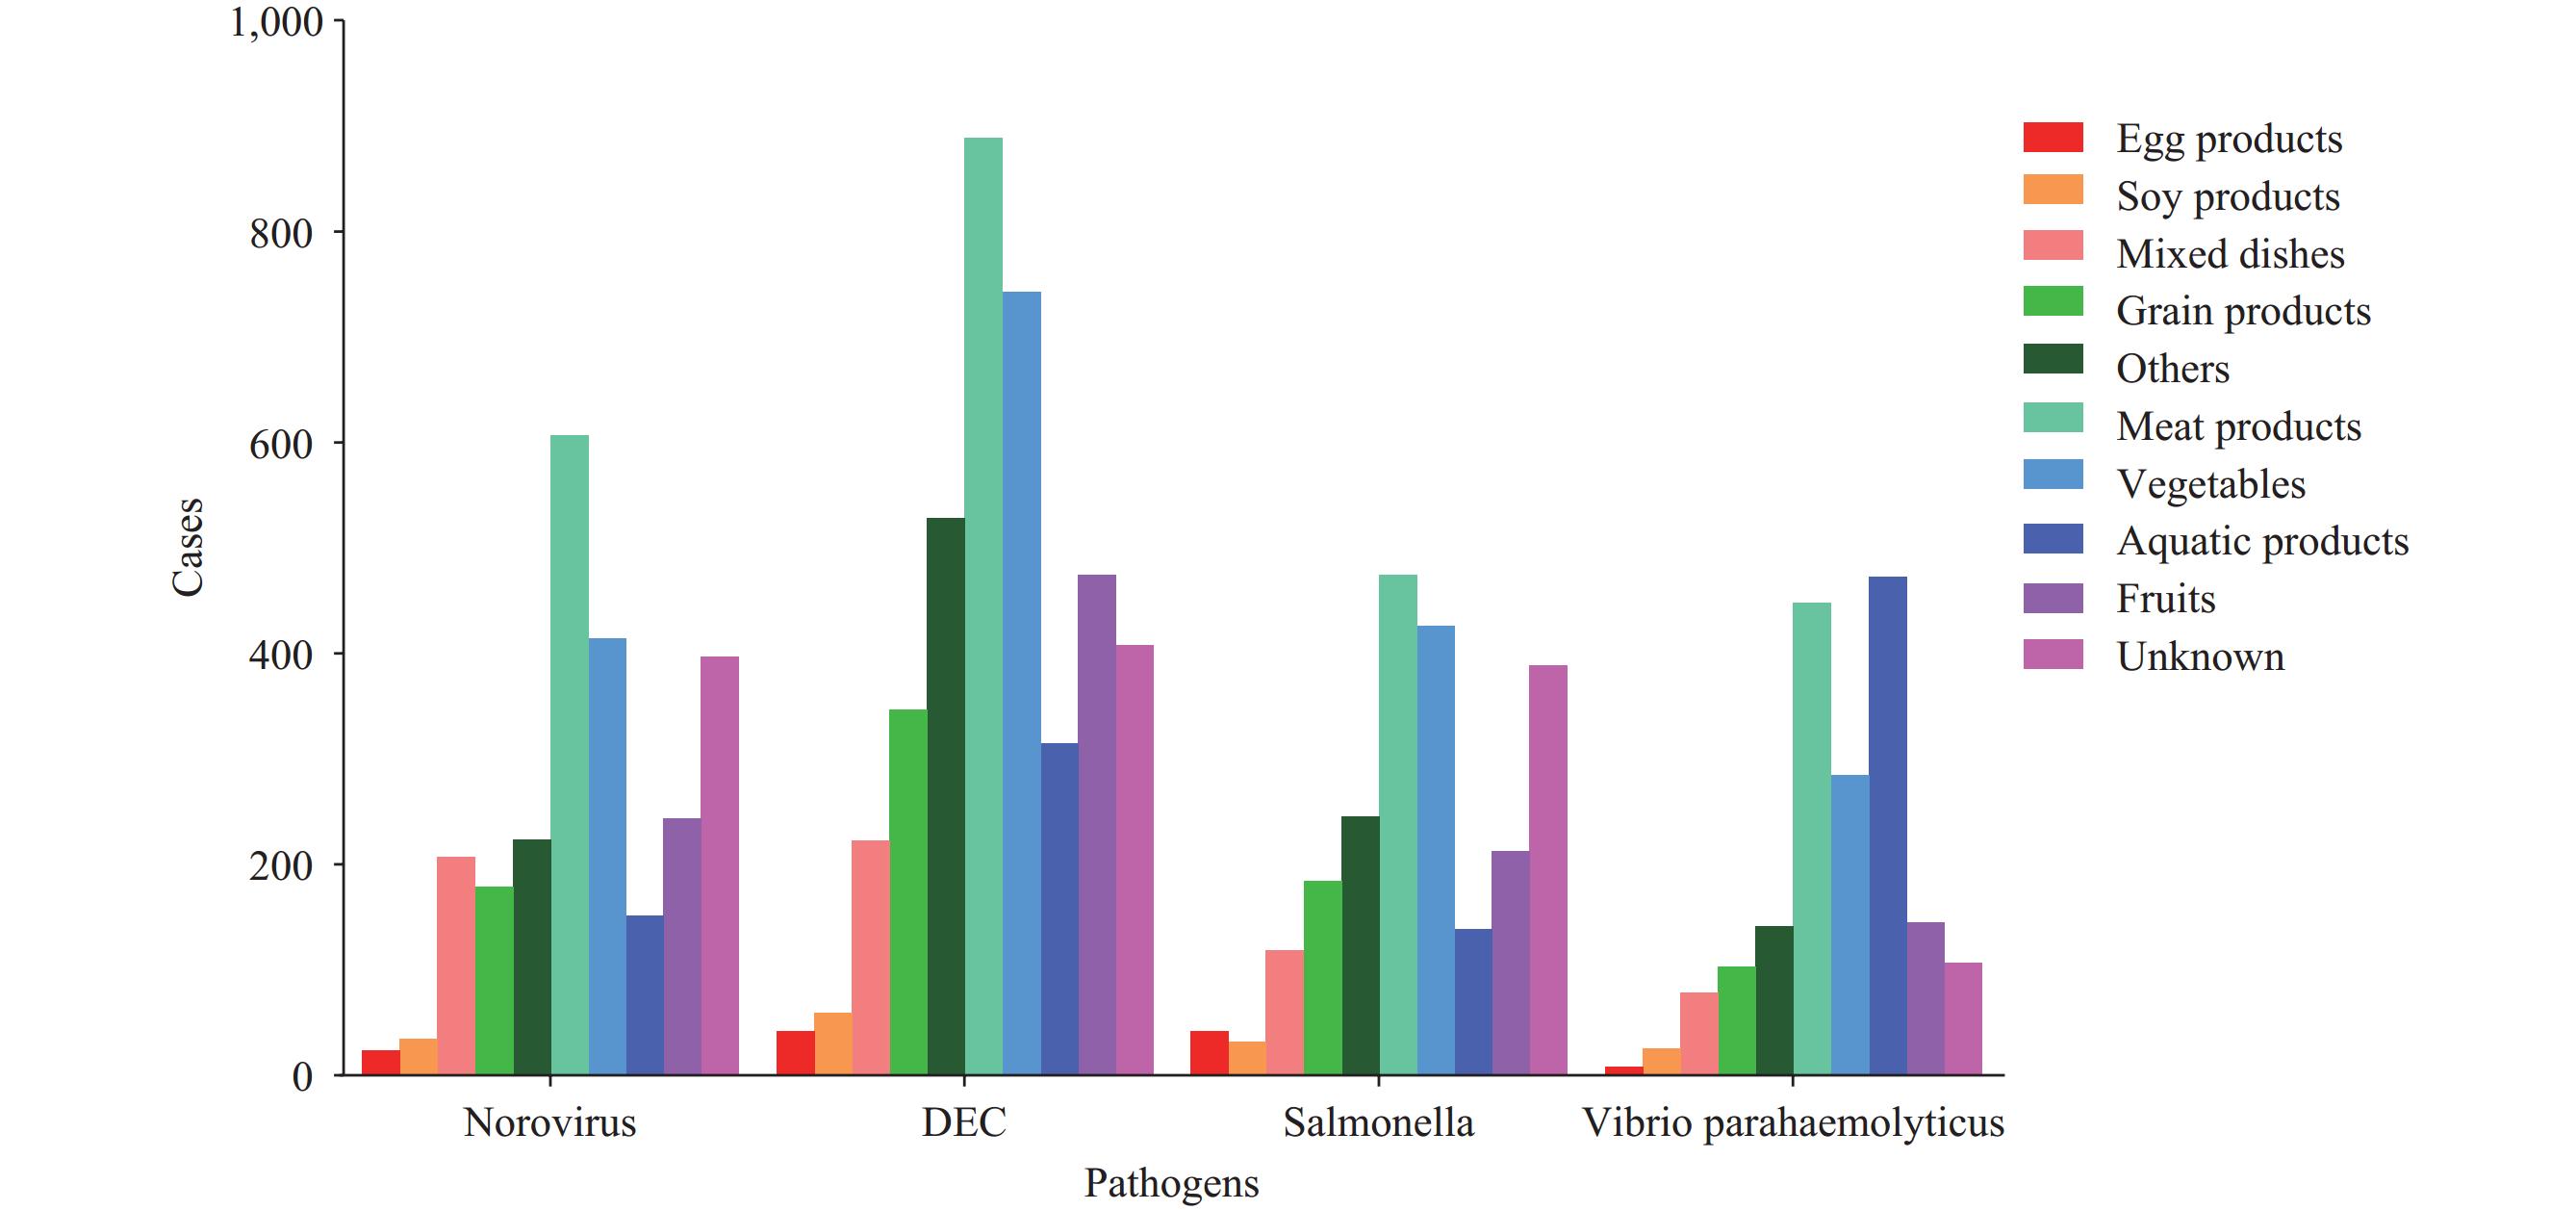
    Figure 2. 

    Distribution of suspicious food categories by pathogens in Beijing Municipality, China, 2013–2023.

    Abbreviation: DEC=diarrhoeagenic Escherichia coli.

    The clinical characteristics of the pathogens are outlined (Table 2). Nausea was the most common symptom, affecting 51.05% (1,265/2,478) of Norovirus-infected patients. Abdominal cramps were prevalent in DEC, Salmonella, and Vibrio parahaemolyticus infections, ranging from 41.08% to 73.86%. Salmonella infections showed a significantly higher fever prevalence (36.02%) compared to other pathogens during 2013–2023. Across eleven years, the proportion of abdominal cramps from these infections decreased notably from 53.72%–73.86% (2013–2017) to 40.63%–56.93% (2018–2023). The projected trend suggests an increase in patients experiencing loose stools due to pathogens, expected to rise from 16.75%–28.27% (2013–2017) to 35.32%–45.90% (2018–2023).

    Variables Total Norovirus DEC Salmonella Vibrio parahaemolyticus P value*
    2013–
    2023
    Total 2013–
    2017
    2018–
    2023
    Total 2013–
    2017
    2018–
    2023
    Total 2013–
    2017
    2018–
    2023
    Total 2013–
    2017
    2018–
    2023
    Total 10,469 2,478 888 1,590 4,024 1,671 2,353 2,260 948 1,312 1,811 1,140 671
    Clinical symptom
    Nausea 4,778
    (45.64)
    1,265
    (51.05)
    487
    (54.84)
    778
    (48.93)
    1,654
    (41.10)
    779
    (46.62)
    875
    (37.19)
    856
    (37.88)
    401
    (42.30)
    455
    (34.68)
    1,143
    (63.11)
    727
    (63.77)
    416
    (62.00)
    <0.001
    Vomiting 3,023
    (28.88)
    965
    (38.94)
    354
    (39.86)
    611
    (38.43)
    936
    (23.26)
    414
    (24.78)
    522
    (22.18)
    469
    (20.75)
    208
    (21.94)
    261
    (19.89)
    771
    (42.57)
    493
    (43.25)
    278
    (41.43)
    <0.001
    Abdominal cramps 5,542
    (52.94)
    1,123
    (45.32)
    477
    (53.72)
    646
    (40.63)
    2,123
    (53.76)
    1,061
    (63.49)
    1,062
    (45.13)
    1,142
    (50.53)
    603
    (63.61)
    539
    (41.08)
    1,224
    (67.59)
    842
    (73.86)
    382
    (56.93)
    <0.001
    Fever
    (≥37.5 °C)
    2,481
    (23.70)
    452
    (18.24)
    201
    (22.64)
    251
    (15.79)
    783
    (19.46)
    424
    (25.37)
    359
    (15.26)
    814
    (36.02)
    357
    (37.66)
    457
    (34.83)
    400
    (22.09)
    281
    (24.65)
    119
    (17.73)
    <0.001
    Dehydration 785
    (7.50)
    223
    (9.00)
    88
    (9.91)
    135
    (8.49)
    208
    (5.17)
    102
    (6.10)
    106
    (4.50)
    188
    (8.32)
    89
    (9.39)
    99
    (7.55)
    176
    (9.72)
    119
    (10.44)
    57
    (8.49)
    <0.001
    Thirsty 1,365
    (13.04)
    245
    (9.89)
    143
    (16.10)
    102
    (6.42)
    288
    (7.16)
    169
    (10.11)
    119
    (5.06)
    196
    (8.67)
    136
    (14.35)
    60
    (4.57)
    207
    (11.43)
    163
    (14.30)
    44
    (6.56)
    <0.001
    Fatigue 1,253
    (13.67)
    302
    (12.19)
    118
    (13.29)
    184
    (11.57)
    453
    (11.26)
    212
    (12.69)
    241
    (10.24)
    291
    (12.88)
    159
    (16.77)
    132
    (10.06)
    326
    (18.00)
    236
    (20.70)
    90
    (13.41)
    <0.001
    Chills 54
    (0.52)
    8
    (0.32)
    5
    (0.56)
    3
    (0.19)
    9
    (0.22)
    2
    (0.12)
    7
    (0.30)
    13
    (0.58)
    4
    (0.42)
    9
    (0.69)
    26
    (1.44)
    17
    (1.49)
    9
    (1.34)
    <0.001
    Diarrhea frequency ≥10/24 h 2,037
    (19.46)
    433
    (17.48)
    144
    (16.22)
    289
    (18.18)
    683
    (16.97)
    277
    (16.58)
    406
    (17.25)
    583
    (25.80)
    227
    (23.95)
    356
    (27.13)
    341
    (18.83)
    202
    (17.72)
    139
    (20.72)
    <0.001
    Diarrhea
    Watery stool 5,936
    (56.70)
    1,464
    (59.08)
    510
    (57.43)
    954
    (60.00)
    2,082
    (51.74)
    951
    (56.91)
    1,131
    (48.07)
    1,324
    (58.58)
    584
    (61.60)
    740
    (56.40)
    1,159
    (64.00)
    773
    (67.81)
    386
    (57.53)
    <0.001
    Loose stool 3,335
    (31.86)
    824
    (33.25)
    251
    (28.27)
    573
    (36.04)
    1,468
    (36.48)
    388
    (23.22)
    1,080
    (45.90)
    650
    (28.76)
    175
    (18.46)
    475
    (36.20)
    428
    (23.63)
    191
    (16.75)
    237
    (35.32)
    0.690
    Mucus stool 518
    (4.95)
    88
    (3.56)
    54
    (6.08)
    34
    (2.14)
    175
    (4.35)
    108
    (6.46)
    67
    (2.85)
    146
    (6.46)
    88
    (9.28)
    58
    (4.42)
    94
    (5.19)
    68
    (5.96)
    26
    (3.87)
    0.990
    Rice-water stool 75
    (0.72)
    12
    (0.48)
    9
    (1.01)
    3
    (0.19)
    50
    (1.24)
    47
    (2.81)
    3
    (0.13)
    6
    (0.27)
    5
    (0.53)
    1
    (0.08)
    7
    (0.39)
    5
    (0.44)
    2
    (0.30)
    <0.001
    Pus and blood stool 66
    (0.63)
    5
    (0.20)
    1
    (0.11)
    4
    (0.25)
    24
    (0.60)
    14
    (0.84)
    10
    (0.42)
    17
    (0.75)
    9
    (0.95)
    8
    (0.61)
    18
    (1.00)
    11
    (0.96)
    7
    (1.04)
    0.137
    Abbreviation: DEC=diarrhoeagenic Escherichia coli.

    Table 2.  Reported signs and symptoms of patients infected with different pathogens in Beijing Municipality, China, 2013–2023, n (%).

    • This continuous pathogenic surveillance study examined the incidence of foodborne diseases among outpatients with diarrhea in Beijing. Through comprehensive laboratory testing for four intestinal pathogens and one virus, the study revealed the epidemiological and pathogenic characteristics of foodborne diarrhea in the population, contributing valuable data to the understanding of such diseases in China. Over the past eleven years, 57,021 biological samples were tested for four common intestinal pathogens, while 23,506 samples were specifically tested for a single virus. Norovirus emerged as the most frequently detected pathogen, with a detection rate of 10.54%, aligning with studies conducted in Shanghai Municipality and Zhejiang Province, confirming that norovirus infection is the leading cause of diarrhea in these regions (45). Noroviruses are the primary etiological agents responsible for sporadic cases and outbreaks of acute gastroenteritis globally, imposing a substantial disease burden in both developed and developing nations. Currently, most outbreaks under surveillance in China are large-scale, while smaller clusters also constitute a significant proportion. Therefore, there is a need for further enhancement in their monitoring and analysis (6). Regarding temporal distributions, the detection rates of all five pathogens decreased in 2020 due to the coronavirus disease 2019 (COVID-19) pandemic, mirroring similar observations reported in the US (7). The detection rate of Shigella decreased annually from 2013 to 2023, consistent with a study on Shigella infection in China (8). This decline is likely due to various factors, including rapid economic growth, improved water supply systems, upgraded sanitation facilities, and heightened awareness of hygiene practices. Regarding seasonality, the detection rates of the four bacterial pathogens peaked in spring and summer, while norovirus was the main cause of winter outbreaks, consistent with previous reports (9). Among cases of Salmonella infection, meat products and vegetables were the most commonly implicated foods, contrary to a study in the US (10) that reported eggs as the most commonly implicated food. The most common clinical symptoms were nausea, vomiting, and abdominal cramps. Patients infected with Salmonella were more likely to have a fever. The research on clinical symptoms provides valuable insights for clinical diagnosis. Given the atypical clinical manifestations of various pathogens, differentiating them from non-infectious diarrhea remains challenging. Therefore, there is an urgent need to establish rapid pathogen monitoring methods to enable targeted treatment strategies when patients seek medical care.

      The study is subject to some limitations. The surveillance data from 36 medical institutions may not provide an accurate estimate of the overall prevalence of foodborne diseases in Beijing. While efforts were made to adhere to national standards and provide regular training, variations in results among hospitals and laboratories are possible. Moreover, reliance on self-reported food exposure information by patients can introduce recall bias, as there are no valid laboratory methods to confirm these reports.

      The advancement of our economy has led to significant lifestyle transformations. The rising popularity of ready-to-eat or pre-cooked meals highlights the need for a comprehensive strategy to safeguard the entire food supply chain, from production to consumption, to safeguard consumers against foodborne diseases. Thus, we advocate for improved food safety education for at-risk groups and the implementation of proactive and efficient control measures tailored to the epidemiological patterns of foodborne diarrhea cases in Beijing.

    • No conflicts of interest.

    • All members from the participating CDCs for their contributions.

Reference (10)

Citation:

Catalog

    /

    DownLoad:  Full-Size Img  PowerPoint
    Return
    Return