
 Download:


-
During positron emission tomography/computed tomography (PET/CT) testing, it is crucial to administer radioactive isotopes. The γ radiation from these isotopes poses risks to nearby individuals, including medical staff, patients’ families, and other nuclear medicine patients. Therefore, assessing the dose rate is essential for ensuring the safety of these individuals in close proximity.
Various methods are employed to calculate dose rates in radiation scenarios, including the Monte Carlo method, the discrete ordinate method, and the point kernel integration method. Each method has its strengths and limitations. The Monte Carlo method uses probability and statistics but can be computationally slow and occasionally unsolvable (1). The discrete ordinate method offers fast calculations but struggles with complexity in large systems. The point kernel integration method uses a uniform grid for radiation sources but lacks real-time capabilities (2–4). To address these limitations, the “cylinder integration” method was developed to create a spatial-temporal model for radiation dose rates around nuclear medicine patients (5), offering a simplified and innovative approach to calculations.
-
Upon injection, 18F-FDG rapidly dispersed throughout the body, achieving nearly complete distribution across organs within about 30 seconds (6). Gray-scale physical models were generated for each organ, correlating with their respective gray-scale values (Figure 1). Post-injection, gray-scale imaging was calibrated at three time points: 350–360 seconds (A1), 1,770–1,800 seconds (B1), and 3,480–3,600 seconds (C1), with radionuclide activity represented in charts A2, B2, and C2. For example, the radioactivity levels in different body regions at time points B2 and C2 can be illustrated by assigning values a1 to the head, a2 to the trunk, a3 to the heart, a4 to the bladder, and a5 to the legs. Detailed methodology for determining these values is provided in
Supplementary Materials .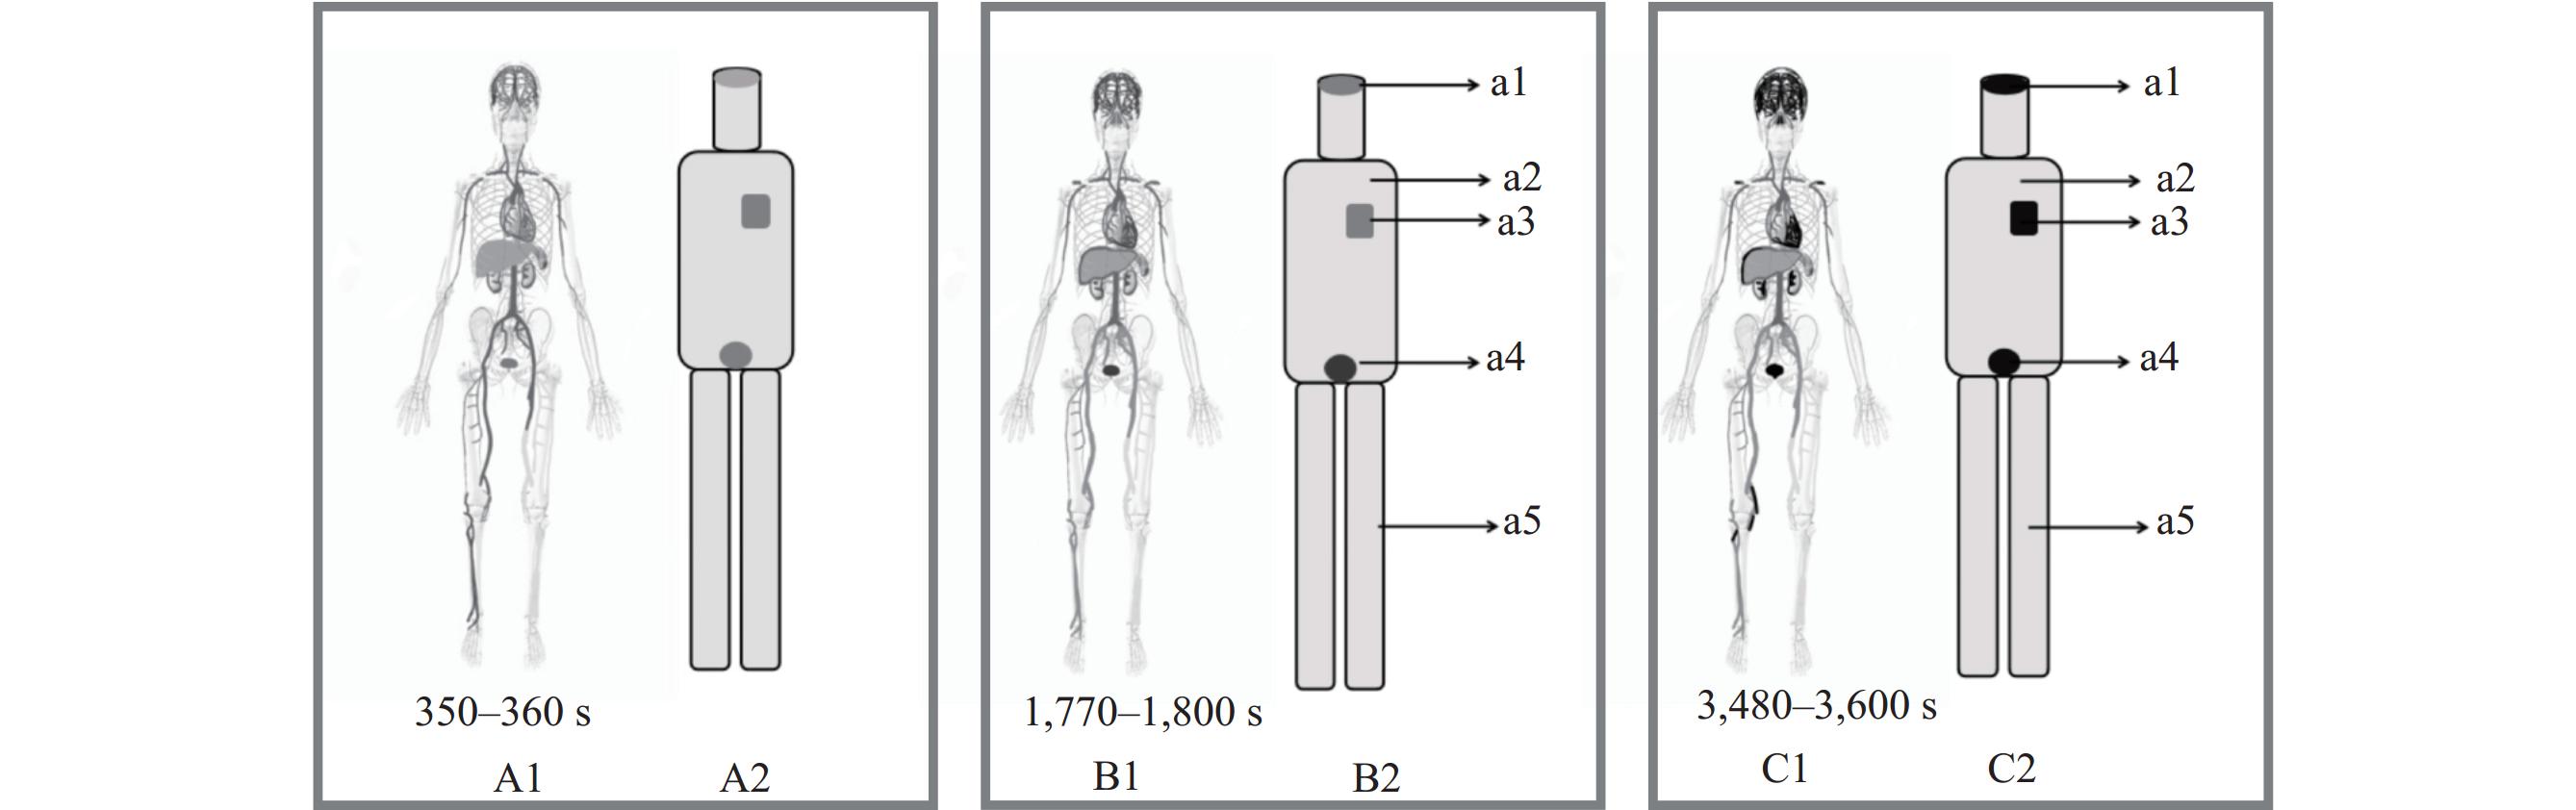 Figure 1.
Schematic diagram of the grayscale values and corresponding specific activity of PET/CT or PET images. (A1) Gamma-ray imaging of the human body 350 to 360 seconds after radiopharmaceuticals are injected into the patient; (A2) Grayscale image of its corresponding organ; (B1) Gamma-ray imaging of the human body between 1,770 and 1,800 seconds after radiopharmaceutical injection into the patient; (B2) Grayscale image of its corresponding organ; (C1) Gamma-ray imaging of the human body 3,480 to 3,600 seconds after the injection of radiopharma into the patient; (C2) Grayscale image of its corresponding organ.
Abbreviation: PET/CT=positron emission tomography/computed tomography.The methodology for calculating the radiation dose rate around organs that are symmetric along a common axis in the body is provided in the Supplementary Materials. To assess the radiation dose distribution from organs such as the heart, tumor, and legs, which are not aligned with the Z-axis of the cylinder, a translation technique was utilized to align them with the Z-axis using the equation OP=O′P′ (Figure 2). This method ensured that the radiation dose rates at points P and P′ were equal. Additional information on the derivation process is available in the
Supplementary Materials .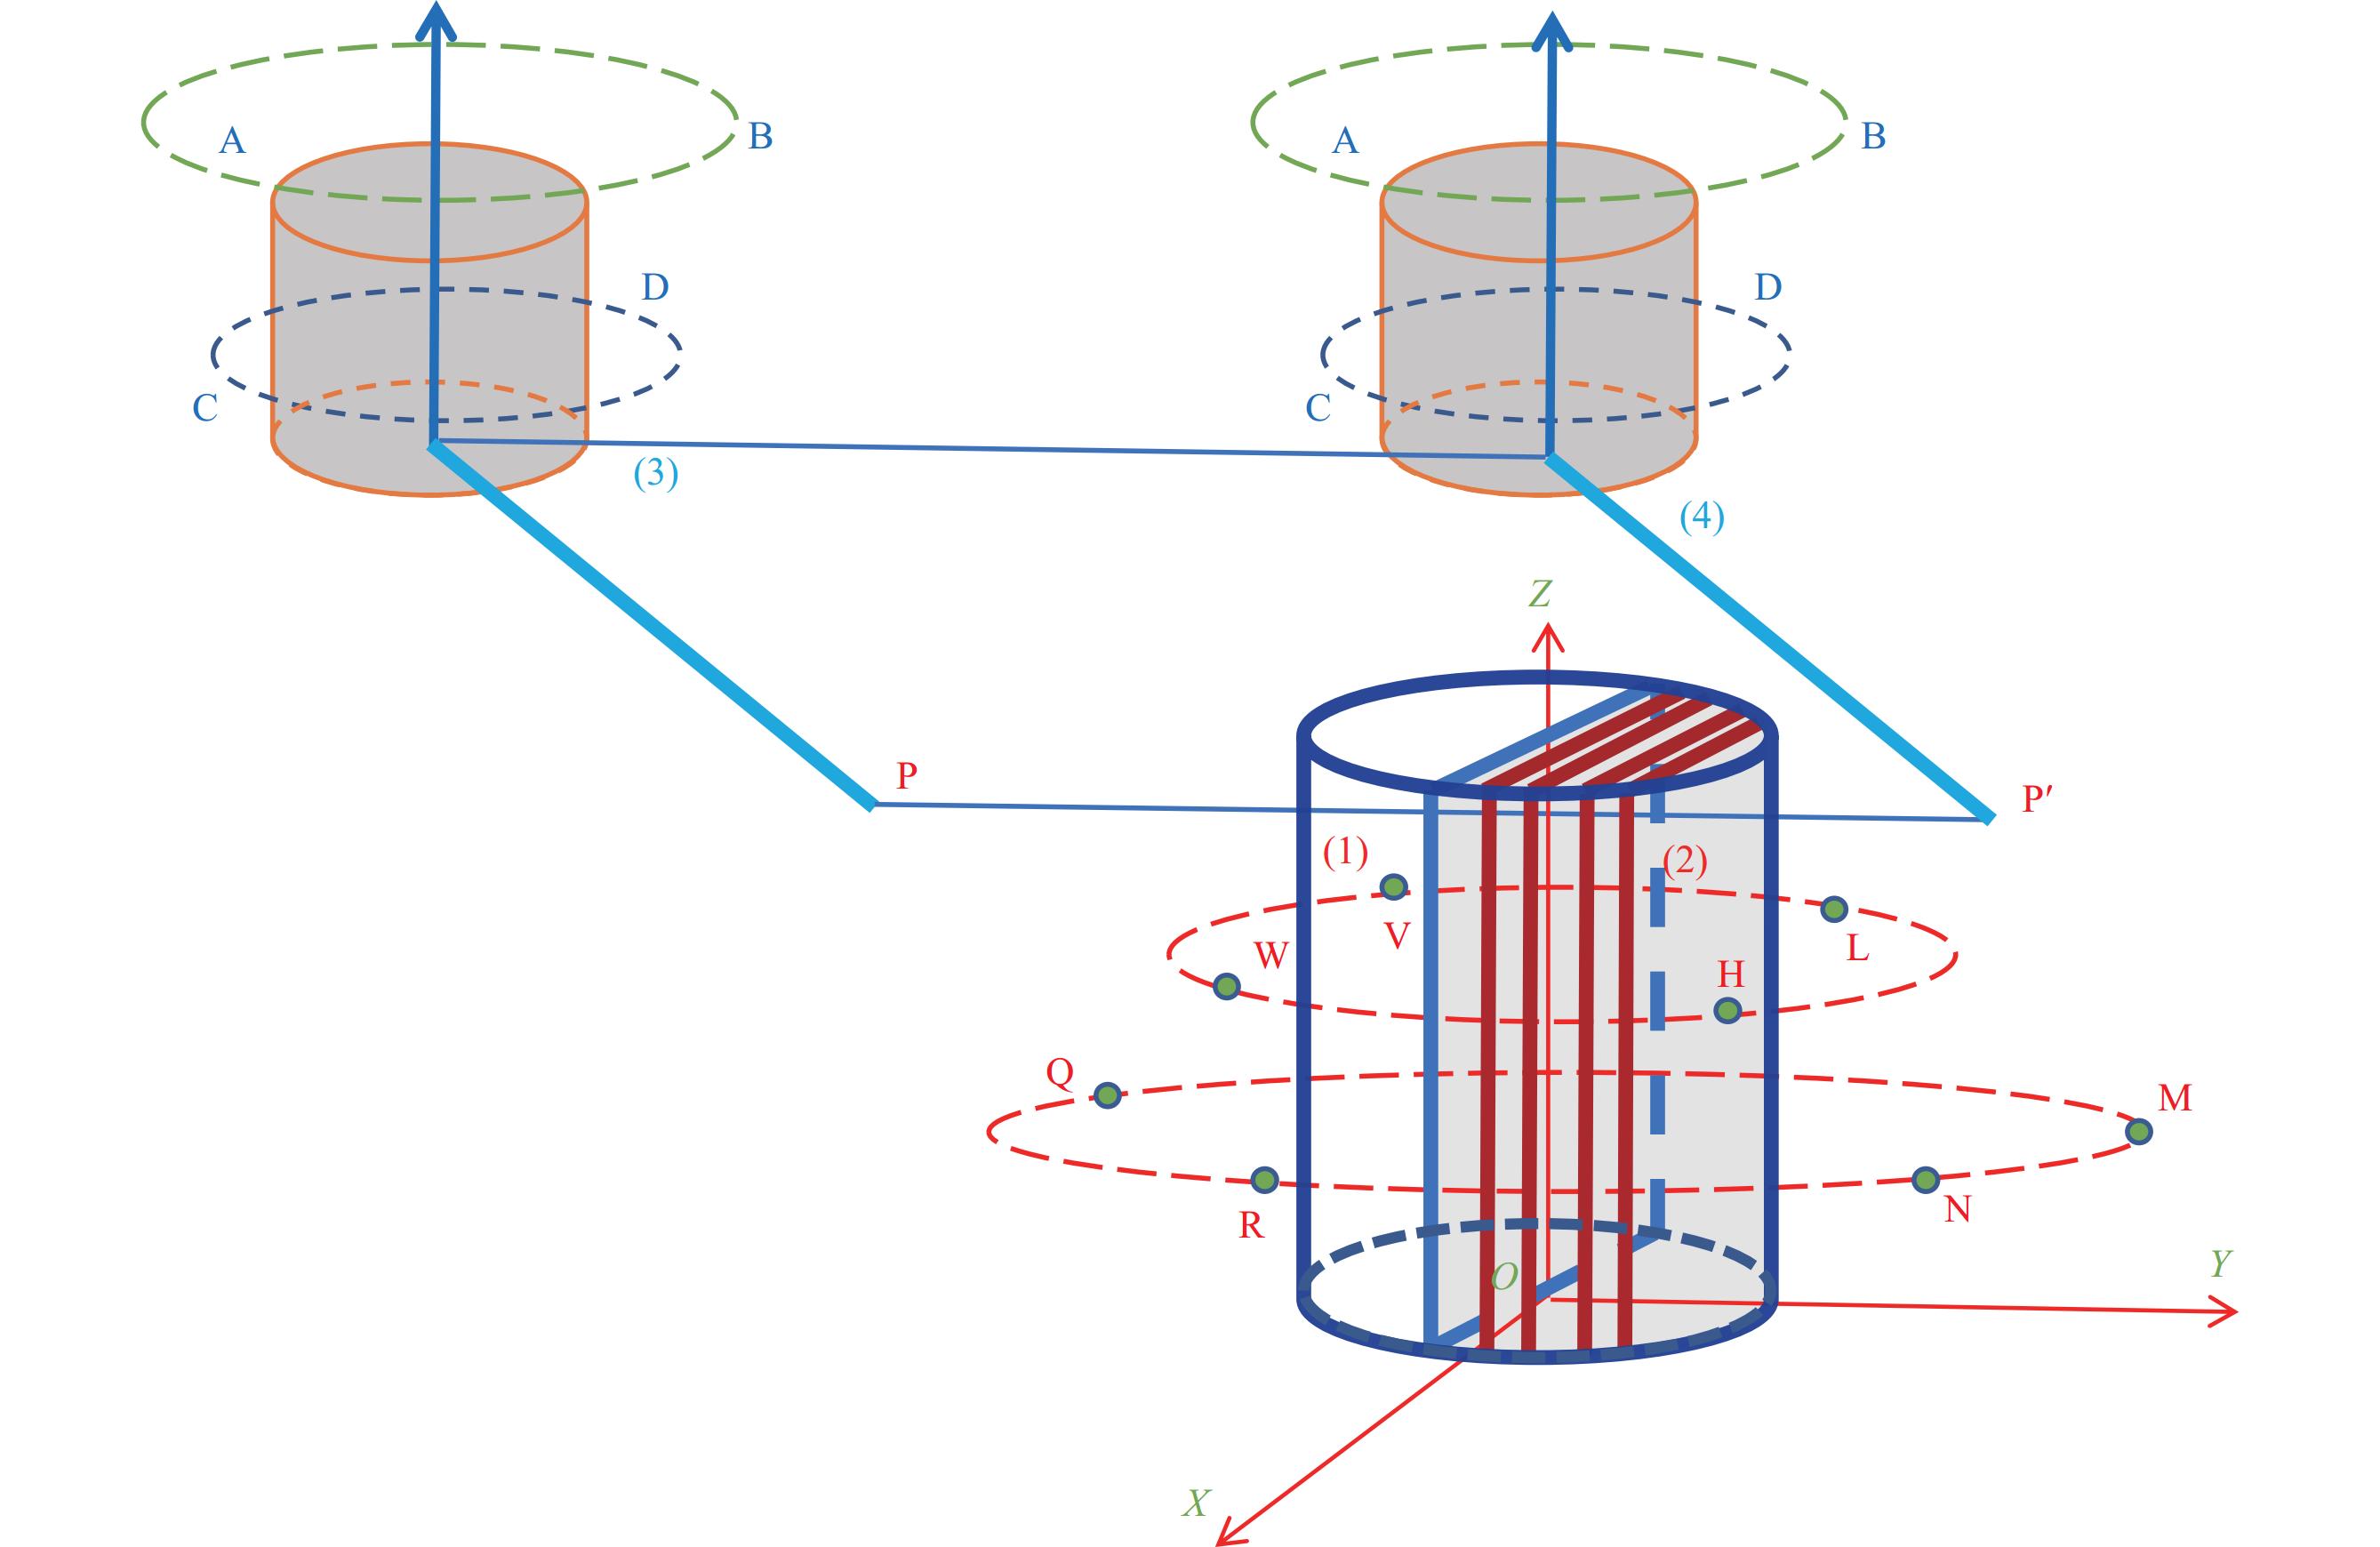 Figure 2.
Schematic diagram illustrating the calculation of radiation dose rates around organs with non-axisymmetric axes.
Note: In the same way that P is translated to P ', (3) is translated to (4), coaxial with (1) and (2) below.
The four points W, V, H and L mean that the four points are coaxial and on the same plane at the same height, so the radiation dose rate is the same; The four points, N, M, Q, R, are coaxial and on the same plane at the same height, so the radiation dose rate is the same.
The method used for calculation assumes a uniform distribution of radioactive activity in the body, which may not always hold true. To improve accuracy, we introduced a “radiation dose rate correction factor” (ω) by comparing measured radiation dose rates near the body. ω was determined as the average of theoretical and observed dose rates at different distances. Despite metabolic differences in radioactive pharmaceuticals, the corrected relative error remained below 11%, indicating the general applicability of the correction factor ω.
The patient was injected with 127.4 MBq of 18F-FDG imaging agent through the median elbow vein at a hospital. The imaging agent, supplied by Beijing Atomic High Tech Co., Ltd., had a radiochemical purity of over 95%. Portable model 6,150 by Automes from Germany γ Peripheral dose equivalent rate instrument was used to measure the dose equivalent rate of radiation. Measurements were taken while the patient stood with hands naturally hanging down, the detector placed at the center of the patient’s chest facing forward. Measurements began 99 minutes post-injection, with distances ranging from 0.1 m to 3.0 m from the patient’s body surface. Each measurement, lasting 30 seconds, was repeated three times, recorded after stabilization, and averaged after background dose subtraction.
-
The method used to calculate the spatiotemporal distribution of radiation dose around a single cylindrical model can be found in the Supplementary Materials. Different body parts such as the head, trunk, legs, heart, bladder, and tumor were represented by cylinders in the mathematical model to estimate the radiation dose rate. The spatiotemporal radiation dose distribution around an individual was determined using the superposition method of coaxial and non-coaxial cylinder values.
To account for variations in height, weight, stance, and timing of radiopharmaceutical administration among subjects, standardization within a consistent coordinate system was essential, achieved through our computational model. The model’s unique aspect is the use of position translation to achieve a uniform spatiotemporal distribution of radiation dose rates. We harmonized horizontal discrepancies by aligning the subjects’ positions using horizontal translation (Figure 3). For individuals with different leg lengths, vertical height translation aligned their origin within the coordinate system, enabling precise dose rate comparisons. Additionally, we synchronized temporal variations in radiopharmaceutical administration by adjusting the starting times in the temporal parameter t, ensuring consistent dose rate calculation regardless of injection schedule differences.
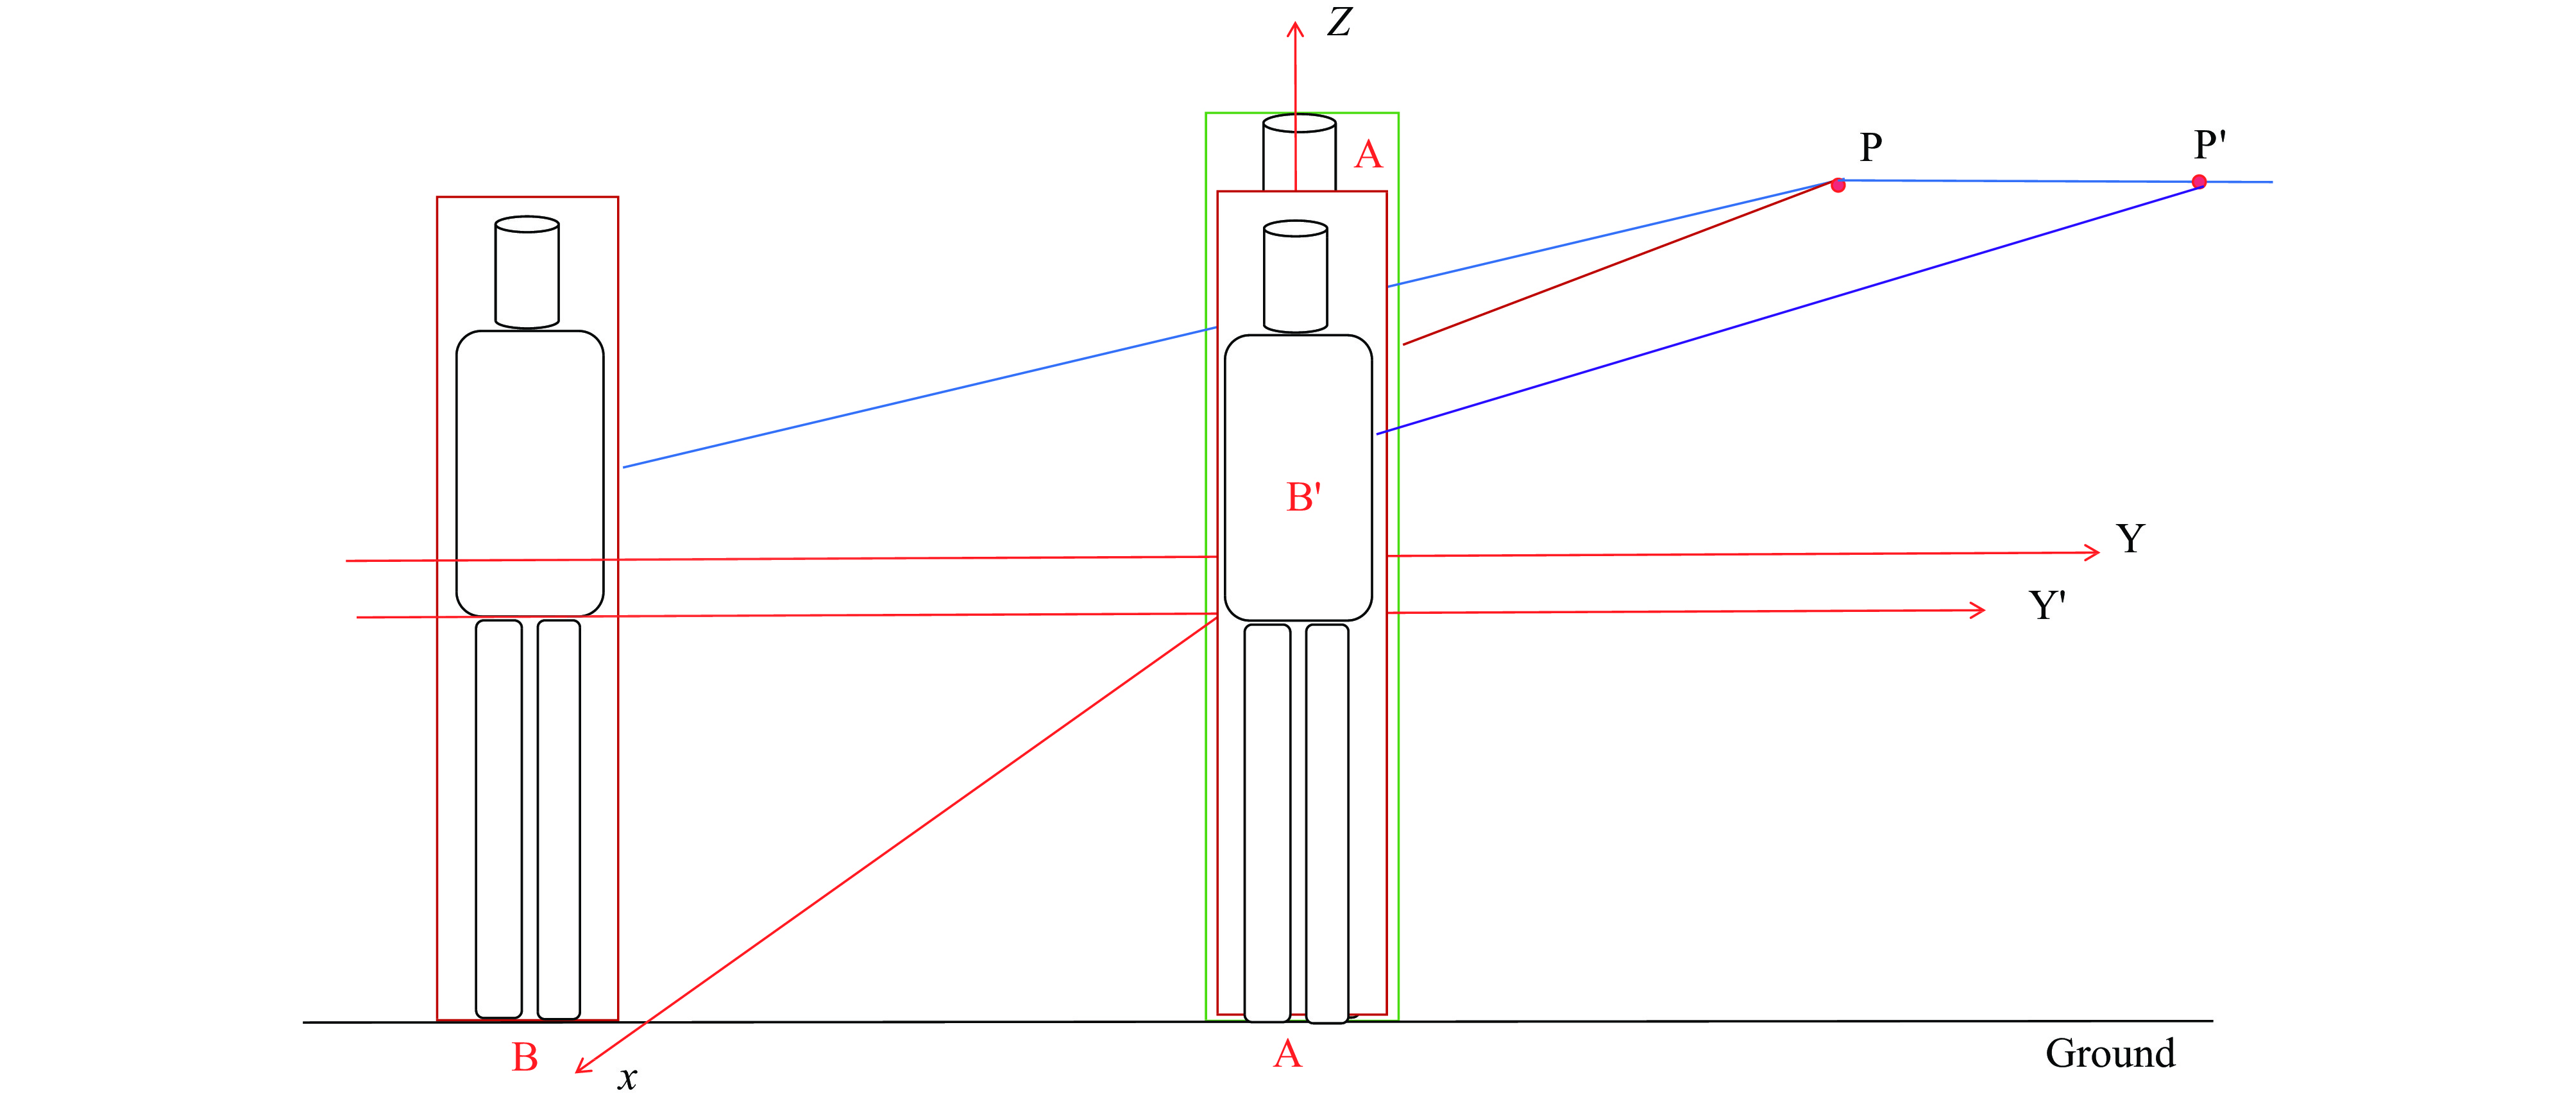 Figure 3.
The standing positions of subjects A and B within the same space.
Using the “cylinder” model and its associated algorithm, we estimated the radiation dose rate for the subject. We then compared this estimate to the actual measured data, allowing us to ascertain the deviation and calculate the mean discrepancy, denoted as ω. Table 1 presents the relative differences between the theoretical and measured dose rates. After applying the model’s corrections for distances spanning from 0.1 to 3.0 meters, we found that the estimated dose rates consistently correlated with the measured values, exhibiting variances of less than 11%.
Distance between the point
and the body surface (m)Theoretical rate
(μGy·h −1)Measured rate
(μGy·h −1)Difference
(μGy·h −1)ω
(μGy·h −1)Uncorrected relative
error (%)Corrected relative
error (%)0.1 242.48 238.78 3.70 0.626 1.55 1.81 0.5 44.56 41.02 3.54 8.63 10.16 1.0 14.50 16.65 −2.15 −12.91 −9.15 2.0 4.14 5.33 −1.19 −22.33 −10.58 3.0 1.92 2.69 −0.77 −28.62 −5.35 Table 1. Comparison of calculated and measured radiation dose rates.
-
Using a sophisticated human body model based on cylindrical elements, we have developed an integral solution that evolves from “point” to “line” and then to “surface” infinitesimals, allowing us to accurately compute the spatiotemporal distribution of radiation dose rates in the vicinity of nuclear medicine patients. The strength of this algorithm is rooted in its sound scientific principles and meticulous mathematical framework. Importantly, the model moves beyond the overly simplistic “point” or “line” representations of the human body and incorporates a more complex, layered cylindrical approach. This enhancement significantly improves the fidelity of simulations across various clinical situations, whether assessing radiation dose distribution around a single patient or multiple patients located on the same plane following radiopharmaceutical administration. The flexibility of the algorithm confirms its wide-ranging clinical utility. Through comparative calculations and validations, we have demonstrated that the estimated radiation dose rates at distances ranging from 0.1 to 3.0 meters are consistent with actual measurements. While some deviations exceeded 5 percent, they remained below the acceptable dose variation threshold of 15 percent, affirming the algorithm's suitability for clinical use. These results validate that the integration of a comprehensive computational strategy with a cylindrical superposition model of the human body considerably improves the accuracy of predicted dose rate distributions, thereby more closely reflecting the real radiation exposure levels around patients.
This study is subject to some limitations. First, the necessity of computational software development is crucial to expedite the application process due to the complex calculations involved. Second, there is a discrepancy of 10.58% between measured and calculated values, attributed to the human body being simplified as a “cylinder”. To reduce this error, measurements should be taken with a human body model utilizing "cylinder superposition". Third, it is essential to increase the radiation dose rate measurements around more participants to obtain an accurate correction factor for the radiation dose rate (ω).
-
No conflicts of interest.
-
Shixi Zheng, Shuyuan Liu, Ziwei Lu, and Lei Qu for their contributions in preparing the figures.
HTML
| Citation: |

|