

 Download:


-
Antimony (Sb) has been identified as a novel neurotoxin that affects neurocognition in previous animal studies. However, there is limited research on the association between Sb exposure and cognitive impairment in humans. Given the increasing aging population, it is crucial to investigate the relationship between Sb and cognitive impairment in older adults. In this study, we utilized data from the Healthy Aging and Biomarkers Cohort Study (HABCS), a prospective cohort study. A total of 1,333 participants aged 65 years and older were recruited in 2017–2018 and followed up in 2020–2021. Blood Sb (B-Sb) and urine Sb (U-Sb) concentrations were measured using inductively coupled plasma mass spectrometry. Cognitive function was assessed using the validated Mini-Mental State Examination. During the follow-up period of 4,972.1 person-years, 241 cases of cognitive impairments were recorded. Cox regression models, adjusted for potential covariates, showed that the risk of cognitive impairment increased by 56.5% for each e-fold increase in U-Sb. Similar results were observed for B-Sb, with a 52.3% increase in the risk of cognitive impairment for each e-fold increase. Our findings suggest that reducing Sb exposure may help mitigate the burden of cognitive impairment, particularly in regions with high Sb pollution.
The participants were selected from the HABCS study (1), which was conducted in nine regions known for longevity between 2017 and 2018. Follow-up of participants took place between 2020 and 2021. Detailed information about the nine longevity regions can be found in the
Supplementary Material . A total of 3,016 participants were initially recruited, but after excluding those under 65 years old, individuals without blood or urine Sb information, those with missing data on cognitive function, and those who were lost to follow-up or died, a final sample size of 1,333 participants was included (Supplementary Figure S1 andSupplementary Material ). Cognitive function was assessed using the Chinese version of the Mini-Mental State Examination (MMSE). Participants completed a face-to-face interview involving 24 items on the MMSE questionnaire, with a maximum score of 30. Cognitive impairment was defined as follows: uneducated individuals with an MMSE score of less than 18, individuals with 1–6 years of education and an MMSE score of less than 20, and individuals with 6 or more years of education and an MMSE score of less than 24 (2). Furthermore, standardized questionnaires were used to collect sociodemographic characteristics, frequency of food consumption, and health-related information. Information on exposure to Sb and other metals was obtained through biological sample collection. Please refer to the supplementary material for details on Sb detection and covariate definitions (Supplementary Table S1 andSupplementary Material ). Ethical approval for the study was obtained from the Ethics Review Committee of the National Institute of Environmental Health, Chinese Center for Disease Control and Prevention (No. 2017018).The study participants were divided into two groups based on their cognitive function. Continuous variables with a normal distribution were presented as mean±standard deviation (SD), while those with a skewed distribution were described as median (P25–P75). The t-test or rank sum test was used to analyze continuous variables, while categorical variables were described as frequencies (percentages) and analyzed using the χ2-test. A correlation map was used to represent the relationship between the independent variable and the covariable. A strong correlation was defined as |r|>0.7, indicating the possibility of multicollinearity. However, no statistically significant correlations were observed between variables in the correlation map (
Supplementary Figure S2 ). The associations between Sb exposure and the incidence of cognitive impairment were assessed using Cox proportional hazard models. The survival time for participants was calculated from the baseline survey to either the date of cognitive impairment or the end of the survey. Sb exposure levels were modeled as continuous variables using ln-transformed values or categorical variables stratified by high, medium, and low concentrations. Please refer to the Supplementary Material for specific methods used to divide concentration categories. To ensure the accuracy of the study, covariates were included in the Cox proportional hazard models. More details about the models can be found in the eMethods section in theSupplementary Material . The association between Sb exposure and cognitive function was flexibly modeled using restricted cubic splines (RCS). Subgroup analysis was conducted to explore the effects of the association in different populations, and sensitivity analysis was performed to assess the robustness of the observations. Additional information can be found in the supplementary materials. All statistical tests were two-tailed, and P values <0.05 were considered statistically significant. Statistical analyses were performed using SAS software (version 9.4, SAS Institute Inc., Cary, USA).A total of 1,333 participants were enrolled in the study from 2020 to 2021, with an average follow-up duration of 3.73±0.21 years. Among these participants, 1,092 (81.9%) had normal cognitive function, while 241 (18.1%) had cognitive impairment. The median (P25–P75) levels of B-Sb and U-Sb exposure were 2.98 (2.45–3.72) μg/L and 0.05 (0.05–0.19) μg/L, respectively (
Supplementary Table S2 ).After controlling for all covariates, we observed that the risk of cognitive impairment increased by 56.5% with each e-fold increase in U-Sb [hazard ratio (HR)=1.565, 95% confidence interval (CI): 1.230, 1.991]. Compared to the low U-Sb group, the HR (95% CI) for cognitive impairment in the high U-Sb group was 2.456 (1.536, 3.927) (Table 1, Model 4). The non-linear relationship between U-Sb and the risk of cognitive impairment in older adults was confirmed by restricted cubic spline analysis (Pnonlinear<0.05) (Figure 1A). Furthermore, the risk of cognitive impairment in older adults increased linearly with B-Sb exposure, with a 52.3% increased risk for each e-fold increase in B-Sb (HR=1.523, 95% CI: 1.100, 2.109) (Figure 1B, Table 1).
Antimony HR (95% CI) Crude model Model 1 Model 2 Model 3 Model 4 Ln-transformed B-Sb§ 1.189 (0.906, 1.559) 1.179 (0.866, 1.605) 1.121 (0.830, 1.515) 1.235 (0.865, 1.765) 1.523 (1.100, 2.109)* Categorical by concentration Low group 1.000 reference 1.000 reference 1.000 reference 1.000 reference 1.000 reference Medium group 1.086 (0.789, 1.496) 1.045 (0.752, 1.451) 1.031 (0.735, 1.447) 1.128 (0.788, 1.613) 1.183 (0.822, 1.704) High group 1.229 (0.891, 1.694) 1.239 (0.890, 1.726) 1.140 (0.810, 1.604) 1.213 (0.844, 1.745) 1.300 (0.890, 1.899) P for trend 0.209 0.204 0.452 0.296 0.174 Ln-transformed U-Sb¶ 1.323 (1.127, 1.553)† 1.312 (1.100, 1.565)† 1.309 (1.084, 1.580)† 1.353 (1.105, 1.658)† 1.565 (1.230, 1.991)† Categorical by concentration Low group 1.000 reference 1.000 reference 1.000 reference 1.000 reference 1.000 reference Medium group 1.476 (1.060, 2.056)* 1.392 (0.970, 1.996) 1.363 (0.932, 1.993) 1.495 (0.989, 2.259) 1.403 (0.913, 2.156) High group 1.683 (1.216, 2.330)† 1.774 (1.238, 2.542)† 1.708 (1.173, 2.488)† 1.874 (1.243, 2.825)† 2.456 (1.536, 3.927)† P for trend <0.001 0.002 0.005 0.002 <0.001 Abbreviation: B-Sb=blood antimony; U-Sb=urine antimony; HR=hazard ratio; CI=confidence interval.
* Denotes statistical significance at P<0.05.
† Denotes statistical significance at P<0.01.
§ low group (0.04≤B-Sb≤2.45 μg/L), medium group (2.45<B-Sb≤2.98 μg/L), high group (2.98<B-Sb≤3.72 μg/L); Model 1 was adjusted for age, sex, ethnicity, marriage status, and residence; Model 2 was further adjusted for cigarette smoking, alcohol drinking, the consumption of fruit, fish, milk, and nuts; Model 3 was further adjusted for BMI, CVD, hypertension, diabetes and CKD; Model 4 was further adjusted for blood As, blood Cd, blood Se, blood Hg, blood Pb and blood Mn.
¶ low group (U-Sb≤0.05 μg/L), medium group (0.05<U-Sb≤0.19 μg/L), high group (0.19<U-Sb≤2.17 μg/L); Model 1 was adjusted for urine creatinine, age, sex, ethnicity, marriage status, and residence; Model 2 was further adjusted for cigarette smoking, alcohol drinking, and the consumption of fruit, fish, milk, and nuts; Model 3 was further adjusted for BMI, CVD, hypertension, diabetes and CKD; Model 4 was further adjusted for urine As, urine Cd, urine Se, urine Hg, urine Pb and urine Mn.Table 1. Association of antimony with cognitive impairment among Chinese older adults from 2017 to 2021.
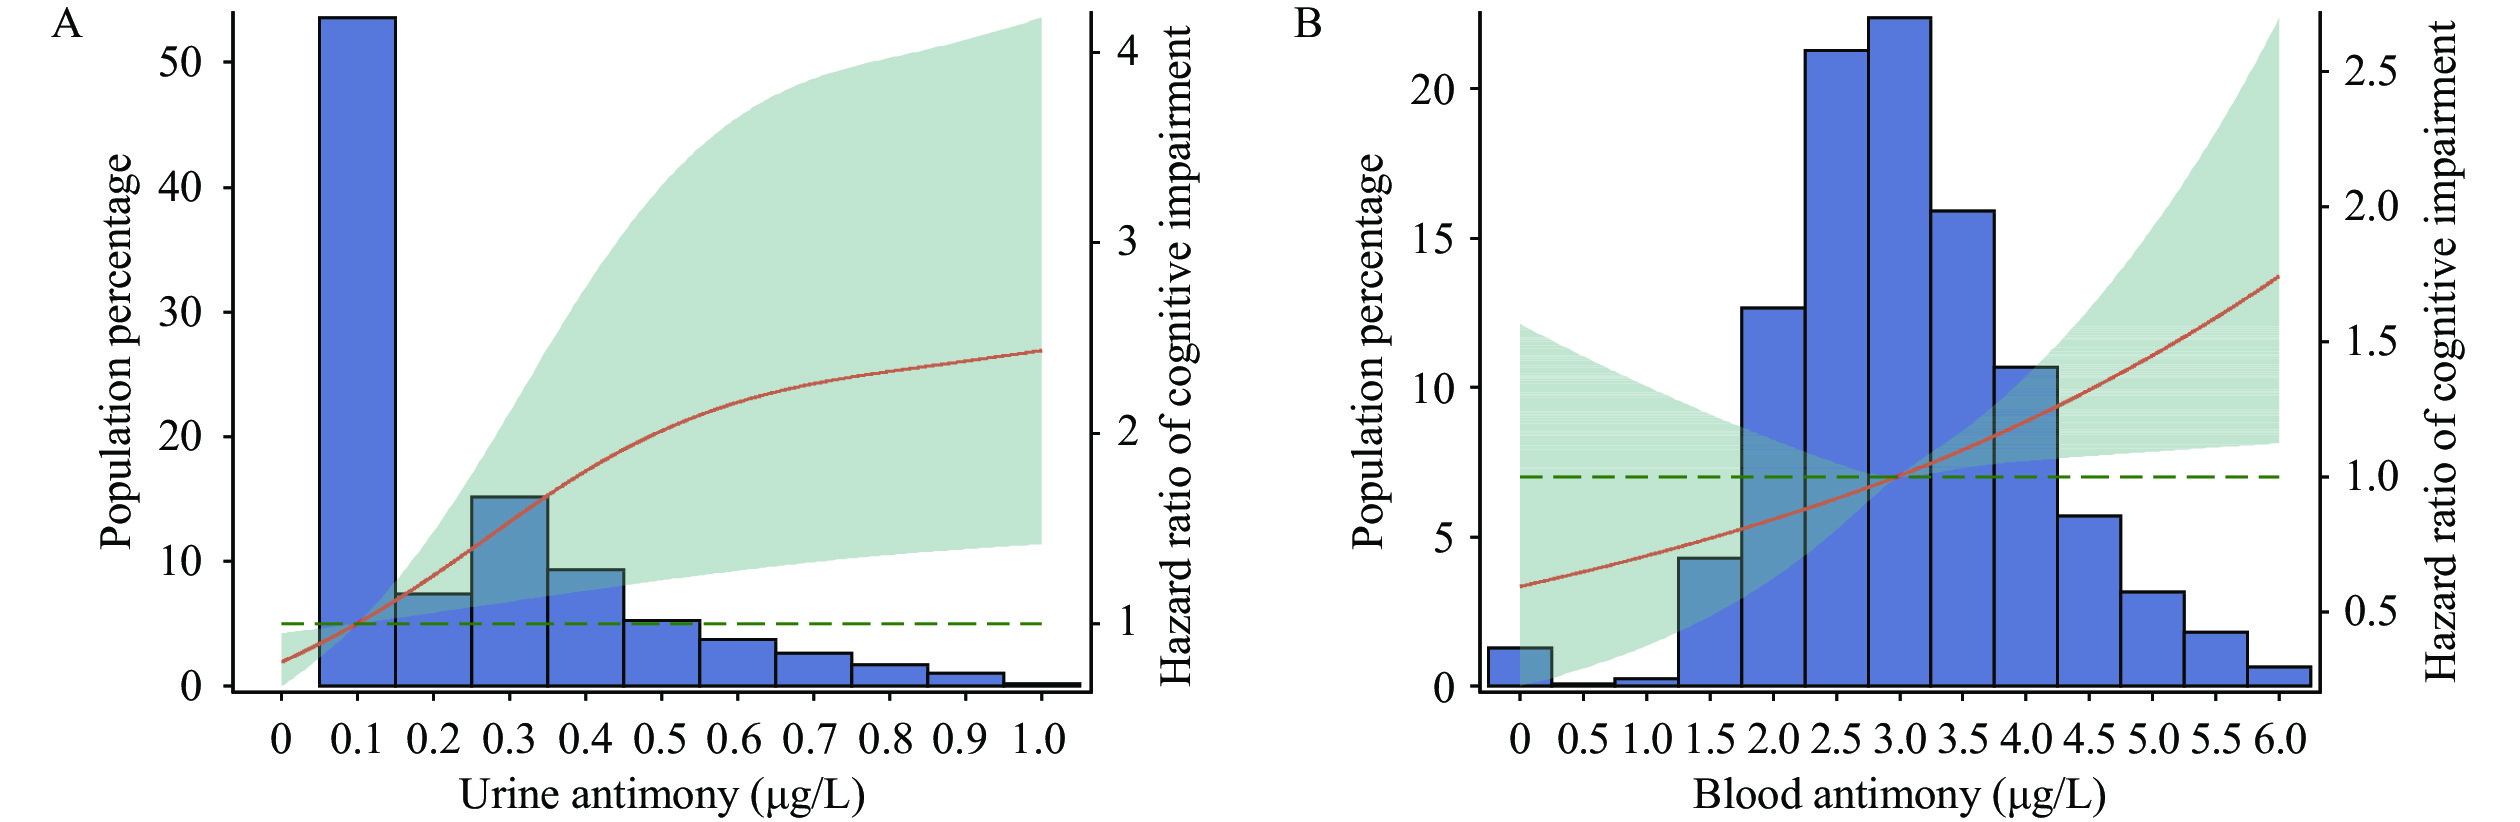 Figure 1.
Association of antimony with cognitive impairment among Chinese older adults from 2017 to 2021 in Cox models with restricted cubic spline. (A) the dose-response relationship between urine antimony levels and cognitive impairment; (B) the dose-response relationship between blood antimony levels and cognitive impairment.
Note: In Figure 1A, the plot contains three knots located at the 50th, 75th, and 95th centiles; the red line represents the estimated effect of urine antimony on the risk of cognitive impairment, while the green areas indicate the corresponding 95% confidence interval; the effect estimates were adjusted for several covariates, including urine creatinine, age, sex, ethnicity, marital status, residence, cigarette smoking, alcohol drinking, dietary intake of fruit, fish, milk, and nuts, BMI, CVD, hypertension, diabetes, CKD, urine As, urine Cd, urine Se, urine Hg, urine Pb, and urine Mn. In Figure 1B, three knots were observed at the 25th, 50th, and 75th centiles; the estimated effect of blood antimony on the risk of cognitive impairment in older adults is represented by the red line, while the green areas indicate the 95% confidence interval; Adjusted covariates include age, sex, ethnicity, marital status, place of residence, cigarette smoking, alcohol drinking, fruit, fish, milk, and nuts, BMI, CVD, hypertension, diabetes, CKD, blood As, blood Cd, blood Se, blood Hg, blood Pb, and blood Mn.In the subgroup analysis, we observed a stronger impact of Sb exposure on cognitive impairment in individuals aged 65–79 years, men, and individuals who consume alcohol. Among smokers, the effect of U-Sb on cognitive impairment was higher compared to non-smokers. We found a significant interaction effect between B-Sb and sex, but no significant interactions were observed between age, cigarette smoking, alcohol drinking, and Sb exposure (Table 2). The results of four sensitivity analyses further supported the robustness of our findings (
Supplementary Tables S3 –S6 ).Subgroup Ln-transformed B-Sb (HR, 95% CI)§ Pinteraction Ln-transformed U-Sb (HR, 95% CI) Pinteraction Age, years 0.433 0.072 65–79 (n=759) 2.577 (1.235, 5.377)* 1.859 (1.106, 3.125)* ≥80 (n=574) 1.242 (0.829, 1.861) 1.557 (1.174, 2.064)† Sex 0.048 0.666 Men (n=703) 2.458 (1.416, 4.267)† 1.733 (1.243, 2.416)† Women (n=630) 1.041 (0.681, 1.592) 1.293 (0.899, 1.860) Cigarette smoking 0.375 0.175 Smoker (n=423) 2.015 (0.974, 4.169) 2.099 (1.345, 3.278)† Non-smoker (n=904) 1.445 (0.972, 2.147) 1.536 (1.116, 2.116)† Alcohol drinking 0.123 0.653 Drinker (n=390) 2.705 (1.075, 6.807)* 1.891 (1.145, 3.123)* Non-drinker (n=934) 1.346 (0.964, 1.881) 1.431 (1.046, 1.957)* Abbreviation: B-Sb=blood antimony; U-Sb=urine antimony; HR=hazard ratio; CI=confidence interval.
* Denotes statistical significance at P<0.05.
† Denotes statistical significance at P<0.01.
§ Model was adjusted for age, sex, ethnicity, marriage status, residence, cigarette smoking, alcohol drinking, the consumption of fruit, fish, milk, and nuts, BMI, CVD, hypertension, diabetes, CKD, blood As, blood Cd, blood Se, blood Hg, blood Pb, and blood Mn.
¶ Model was adjusted for urine creatinine, age, sex, ethnicity, marriage status, residence, cigarette smoking, alcohol drinking, the consumption of fruit, fish, milk, and nuts, BMI, CVD, hypertension, diabetes, CKD, urine As, urine Cd, urine Se, urine Hg, urine Pb, and urine Mn.Table 2. Association of antimony with cognitive impairment among Chinese older adults in selected population subgroups from 2017 to 2021.
-
To the best of our knowledge, this study represents the first attempt to examine the impact of Sb exposure on cognitive impairment in older adults in China. Using data from the HABCS, a 3-year prospective cohort study, we identified a significant association between Sb exposure and an elevated risk of cognitive impairment.
Previous epidemiological studies have not extensively examined the association between Sb exposure and cognition in older adults. One cross-sectional study (n=631) conducted using National Health and Nutrition Examination Survey (NHANES) data found a non-linear relationship between U-Sb and cognitive function in older adults. Lower doses of U-Sb were associated with better cognitive function, while higher doses may be linked to cognitive impairment (3). In contrast, our study is a larger cohort study that considers other cognition-related metals as covariates, in line with previous literature. A 5-year cohort study in Portuguese older adults found no association between Sb levels in fingernails and cognitive decline (4). However, the inconsistent findings may be due to the small sample size and different exposure assessment methods. Another case-control study reported higher B-Sb levels in the healthy group compared to the dementia group, suggesting a potential protective effect of Sb on cognitive function (5). Differences in study design and adjustments for covariates may explain the inconsistencies between studies. Animal studies support our findings. Tanu et al. demonstrated the toxic effect of Sb on memory changes in mice (6). Xu et al. assessed the risk of Sb-associated dementia (AD) and found that Sb contributed to amyloid-beta accumulation and hyperphosphorylation of tau protein in the mouse brain, indicating an association between Sb exposure and AD risk (7). Although the exact cellular and molecular mechanisms of Sb-related neurotoxicity remain unclear, there is evidence suggesting that Sb can damage cognitive function. For instance, Sb inhibits protein kinase B (Akt), which leads to abnormal activation of the Wnt/β-catenin pathway, causing neuronal apoptosis and neurotoxicity (8). Additionally, Sb induces autophagic cell death by suppressing the Akt/mammalian target of the rapamycin (mTOR) pathway through reactive oxygen species, resulting in cognitive impairment (9).
Subgroup analysis revealed a stronger association between Sb exposure and cognitive impairment in men compared to women. This difference in association may be attributed to variations in lifestyle factors, such as higher rates of smoking and alcohol consumption among men, which increase their likelihood of Sb exposure.
There are several limitations in this study. First, the findings of our study may not be generalized to the general population as our research participants consisted exclusively of older adults. Second, the follow-up period of this study was limited to three years, which necessitates further investigation through long-term observational studies to establish a causal relationship between Sb and cognitive impairment. Third, there may be incomplete or inaccurate data regarding the collected covariates. For instance, information on smoking, drinking, diabetes, and cardiovascular disease relied on self-reporting, which may be subject to recall bias. Additionally, although oxidative stress and psychological stress could potentially act as confounding factors, our study did not measure these indicators. Lastly, the loss of follow-up bias is an unavoidable limitation in this study.
In conclusion, our study findings from a prospective cohort of older adults in China reveal a significant association between Sb exposure and an increased risk of cognitive impairment, particularly in men. This suggests that Sb may act as a novel neurotoxicant, adversely affecting the neurocognitive function of older individuals. Food, particularly seafood and dairy products, is considered the primary source of Sb intake among the population (10). Therefore, reducing Sb exposure could potentially delay or prevent the onset of cognitive impairment in older adults. Future research should include longer follow-up studies to provide a more comprehensive understanding of the relationship between Sb exposure and cognition, allowing for a better exploration of causality.
-
Xiaoming Shi is a editorial board member of the journal China CDC Weekly. He was not involved in the peer-review or handling of the manuscript. The authors have no other competing interests to disclose.
HTML
| Citation: |

|