

 Download:


-
Tobacco use and exposure to secondhand smoke are the most preventable risk factors for adverse health outcomes. In children and adolescents, the initiation of smoking is linked with increased risks of nicotine dependence and subsequent mortality from tobacco-related diseases (1–2). Furthermore, there is no safe level of exposure to secondhand smoke (3), which not only heightens the likelihood of smoking initiation (4) but also adversely affects cardiovascular health and increases cancer mortality among non-smokers (5–6). The China CDC conducted the China National Youth Tobacco Survey (NYTS) targeting students in junior high school (JHS), senior high school (SHS), and vocational senior high school (VSHS) in 2019 and 2021, with a subsequent survey implemented in 2023. This study provides national-level data on experimental, current, frequent, and daily cigarette use, along with secondhand smoke exposure, from the 2023 China NYTS. Additionally, it examines provincial variations in current cigarette usage and secondhand smoke exposure within school environments.
The 2023 China NYTS adopted a design analogous to that used in the 2019 and 2021 iterations, incorporating a three-stage stratified cluster sampling method across Mainland China’s 31 provincial-level administrative divisions (PLADs). This approach ensures both national and provincial representativeness. Initially, five urban districts and five rural counties were selected from each PLAD using proportional population size (PPS) sampling. Within each chosen district or county, three JHSs, two SHSs, and one VSHS were selected using a student-based PPS sampling method. Subsequently, in the selected schools, one class comprising over 40 students from each grade level was randomly chosen to participate in the survey (7). A total of 261,455 students — comprising 134,769 JHS, 87,088 SHS, and 39,598 VSHS students — were ultimately surveyed, achieving an overall response rate of 95.7%. The survey protocol was approved by the Institutional Review Board of the China CDC under approval number 202301.
Experimental cigarette use was evaluated by inquiring whether participants had ever tried smoking cigarettes, even if only taking one or two puffs. Those who answered affirmatively were categorized as experimental users. Current users were defined as individuals who reported smoking at least once in the past 30 days. Within this group, frequent users were identified as those who smoked on 20 or more days, and daily users were defined as those who smoked every day. The study further investigated exposure to secondhand smoke across various environments, including homes, indoor and outdoor public places, and public transportation. Participants were asked to report the number of days in the preceding week during which they were in the presence of someone smoking in each of these environments. Exposure to secondhand smoke was characterized by the presence of a smoker at least one day during the prior week. Additionally, the study assessed secondhand smoke exposure in school environments by asking participants whether they had observed smoking on school premises, both inside buildings and on other property, within the last month. Regular occurrences of teachers smoking in both indoor and outdoor school settings were examined by querying the frequency of such instances over the last 30 days.
Data were adjusted to accommodate the complex sampling design. Prevalence estimates, accompanied by their 95% confidence intervals (CIs), were calculated. The Rao-Scott χ2 test was employed to assess differences between subgroups, with a 2-tailed P value of <0.01 deemed statistically significant. All analyses were conducted using SAS software (version 9.4, SAS Institute Inc., Cary, NC, USA).
In 2023, the prevalence of experimental cigarette use among secondary school students was reported at 13.7%, with 4.2% of students currently smoking, 1.2% smoking frequently, and 0.8% reporting daily smoking. Male students exhibited higher rates of smoking (19.1%, 6.4%, 2.0%, and 1.4%, respectively) compared to their female counterparts (7.8%, 1.8%, 0.3%, and 0.2%, respectively). The highest rates of smoking were observed among VSHS students (22.3%, 9.6%, 3.6%, and 2.6%, respectively), followed by SHS students (14.7%, 3.8%, 1.3%, and 0.9%, respectively), and the lowest in JHS students (11.2%, 3.1%, 0.6%, and 0.4%, respectively). In JHS, the prevalence of experimental and current smoking was higher in rural areas (12.3% and 3.8%) compared to urban areas (9.9% and 2.3%) (Table 1). Variability in current cigarette use among PLADs ranged from 0.9% in Zhejiang to 12.6% in Xizang, with higher prevalence rates observed in the southwestern (Xizang, Yunnan, Guizhou, and Chongqing PLADs) and the southern-central regions (Hainan and Henan PLADs), as well as in Qinghai Province. For JHS, the prevalence ranged from 0.4% in Zhejiang to 10.7% in Xizang; in SHS, it ranged from 0.8% in Zhejiang to 12.5% in Xizang; and in VSHS, it ranged from 2.6% in Jiangxi to 25.4% in Yunnan, with over 10% prevalence in 17 out of 31 PLADs (Figure 1).
Characteristic Sample size Experimental use* Current use* Frequent use* Daily use* N (%) weighted% (95% CI) Secondary school students Total 261,455 (100.0) 13.7 (12.9, 14.5) 4.2 (3.8, 4.6) 1.2 (1.1, 1.4) 0.8 (0.7, 0.9) Gender Boys 136,859 (52.4) 19.1 (18.0, 20.1) 6.4 (5.8, 6.9) 2.0 (1.8, 2.3) 1.4 (1.2, 1.5) Girls 124,596 (47.6) 7.8 (7.3, 8.3) 1.8 (1.6, 2.0) 0.3 (0.3, 0.4) 0.2 (0.2, 0.3) Rao-scott x2 2890.689 1317.688 688.301 449.735 P value <0.001 <0.001 <0.001 <0.001 Residence Urban 141,280 (54.0) 13.0 (12.1, 13.9) 3.8 (3.4, 4.2) 1.2 (1.0, 1.4) 0.8 (0.7, 1.0) Rural 120,175 (46.0) 14.4 (13.2, 15.7) 4.6 (4.0, 5.2) 1.2 (0.9, 1.4) 0.8 (0.6, 1.0) Rao-scott x2 3.508 4.707 0.012 0.135 P value 0.061 0.030 0.912 0.713 Junior high school students Total 134,769 (51.6) 11.2 (10.2, 12.1) 3.1 (2.7, 3.5) 0.6 (0.5, 0.7) 0.4 (0.3, 0.4) Gender Boys 70,480 (52.3) 14.7 (13.5, 15.9) 4.3 (3.7, 4.9) 0.9 (0.7, 1.1) 0.6 (0.5, 0.7) Girls 64,289 (47.7) 7.2 (6.4, 7.9) 1.7 (1.4, 2.0) 0.2 (0.2, 0.3) 0.1 (0.1, 0.2) Rao-scott x2 833.659 324.593 82.207 59.494 P value <0.001 <0.001 <0.001 <0.001 Residence Urban 72,577 (53.9) 9.9 (9.0, 10.8) 2.3 (1.9, 2.8) 0.5 (0.3, 0.6) 0.3 (0.2, 0.4) Rural 62,192 (46.1) 12.3 (10.7, 13.9) 3.8 (3.1, 4.5) 0.7 (0.5, 0.9) 0.4 (0.3, 0.6) Rao-scott x2 7.463 12.717 4.551 5.349 P value 0.006 <0.001 0.033 0.021 Senior high school students Total 87,088 (33.3) 14.7 (13.8, 15.7) 3.9 (3.4, 4.3) 1.3 (1.1, 1.5) 0.9 (0.7, 1.0) Gender Boys 43,953 (50.5) 22.1 (20.8, 23.5) 6.5 (5.7, 7.3) 2.3 (2.0, 2.7) 1.5 (1.3, 1.8) Girls 43,135 (49.5) 7.2 (6.6, 7.9) 1.2 (1.0, 1.4) 0.2 (0.2, 0.3) 0.2 (0.1, 0.2) Rao-scott x2 1394.077 552.871 496.929 324.796 P value <0.001 <0.001 <0.001 <0.001 Residence Urban 47,547 (54.6) 13.5 (12.4, 14.6) 3.3 (2.8, 3.8) 1.2 (1.0, 1.5) 0.8 (0.7, 1.0) Rural 39,541 (45.4) 15.8 (14.3, 17.3) 4.3 (3.6, 5.1) 1.3 (1.0, 1.6) 0.9 (0.7, 1.1) Rao-scott x2 6.320 5.687 0.261 0.375 P value 0.012 0.017 0.610 0.540 Vocational senior high school students Total 39,598 (15.1) 22.3 (20.6, 24.0) 9.6 (8.4, 10.9) 3.6 (3.0, 4.3) 2.6 (2.1, 3.1) Gender Boys 22,426 (56.6) 31.0 (28.8, 33.1) 14.7 (12.9, 16.5) 6.1 (5.0, 7.1) 4.3 (3.6, 5.1) Girls 17,172 (43.4) 12.0 (10.8, 13.2) 3.7 (3.0, 4.4) 0.8 (0.5, 1.0) 0.6 (0.3, 0.8) Rao-scott x2 1356.103 828.215 539.123 240.460 P value <0.001 <0.001 <0.001 <0.001 Residence Urban 21,156 (53.4) 23.2 (20.7, 25.8) 9.9 (8.2, 11.6) 3.9 (3.1, 4.8) 2.9 (2.2, 3.5) Rural 18,442 (46.6) 21.2 (19.0, 23.5) 9.3 (7.3, 11.3) 3.3 (2.2, 4.4) 2.3 (1.5, 3.1) Rao-scott x2 1.399 0.219 0.758 1.228 P value 0.237 0.640 0.384 0.268 * The difference between junior high school, senior high school and vocational senior high shcool students was statistically significangt (P<0.01). Table 1. Prevalence of cigarette use among secondary school students in China, 2023.
 Figure 1.
Provincial disparities in the prevalence of current cigarette use among secondary school students in China by school type, 2023.
In the same year, 54.5% of secondary school students reported exposure to secondhand smoke within the preceding seven days across four distinct locations. The highest incidences were observed in outdoor public places (40.2%) and indoor public spaces (37.5%). Exposure rates were comparatively lower at home (29.4%) and on public transportation (20.2%). Boys experienced higher rates of exposure than girls in all settings, and urban areas exhibited increased exposure rates at home and in both indoor and outdoor public spaces relative to rural areas (Table 2).
Characteristic Four types of places* School† Home Indoor
public places§Outdoor
public places§Public transportation§ Any places§ School§ Seeing teachers smoking at school almost every day§ Secondary school students Total 29.4 (28.3, 30.6) 37.5 (36.2, 38.9) 40.2 (38.8, 41.6) 20.2 (19.4, 21.0) 54.5 (52.9, 56.1) 35.4 (33.9, 36.9) 8.3 (7.6, 9.1) Gender Boys 31.0 (29.8, 32.2) 39.4 (38.0, 40.8) 41.8 (40.4, 43.3) 22.0 (21.1, 23.0) 56.6 (54.9, 58.2) 40.7 (39.0, 42.3) 11.1 (10.1, 12.0) Girls 27.7 (26.5, 28.9) 35.4 (34.0, 36.8) 38.4 (37.0, 39.8) 18.1 (17.2, 19.0) 52.1 (50.5, 53.8) 29.5 (28.1, 31.0) 5.3 (4.7, 5.9) Rao-scott x2 113.129 109.795 82.105 92.557 131.077 672.555 635.081 P value <0.001 <0.001 <0.001 <0.001 <0.001 <0.001 <0.001 Residence Urban 31.2 (29.9, 32.5) 39.7 (38.2, 41.2) 43.6 (42.1, 45.1) 19.6 (18.7, 20.6) 58.0 (56.3, 59.6) 34.4 (32.5, 36.3) 7.1 (6.3, 7.9) Rural 27.8 (25.9, 29.6) 35.5 (33.3, 37.7) 37.0 (34.8, 39.3) 20.8 (19.5, 22.1) 51.2 (48.6, 53.8) 36.3 (33.9, 38.7) 9.5 (8.3, 10.7) Rao-scott x2 9.135 10.074 23.105 1.939 19.539 1.592 12.259 P value 0.003 0.002 <0.001 0.164 <0.001 0.207 <0.001 Junior high school students Total 30.0 (28.6, 31.4) 33.6 (32.1, 35.0) 37.3 (35.7, 38.8) 19.0 (18.0, 20.0) 52.4 (50.7, 54.2) 30.2 (28.6, 31.9) 6.9 (6.1, 7.8) Gender Boys 31.4 (30.0, 32.8) 34.7 (33.2, 36.2) 38.3 (36.7, 39.8) 21.0 (19.9, 22.1) 54.2 (52.4, 56.0) 34.0 (32.2, 35.7) 8.9 (7.9, 9.9) Girls 28.4 (27.0, 29.9) 32.3 (30.8, 33.8) 36.1 (34.5, 37.7) 16.6 (15.5, 17.6) 50.4 (48.6, 52.3) 25.9 (24.3, 27.6) 4.6 (4.0, 5.3) Rao-scott x2 58.450 32.447 28.851 72.530 65.483 269.049 339.694 P value <0.001 <0.001 <0.001 <0.001 <0.001 <0.001 <0.001 Residence Urban 31.7 (30.3, 33.1) 36.3 (34.9, 37.7) 41.6 (40.0, 43.1) 18.8 (17.7, 19.8) 56.7 (55.1, 58.3) 28.9 (27.0, 30.7) 5.7 (5.0, 6.5) Rural 28.5 (26.3, 30.8) 31.1 (28.8, 33.5) 33.4 (30.9, 35.9) 19.2 (17.6, 20.9) 48.6 (45.6, 51.6) 31.4 (28.8, 34.1) 8.0 (6.6, 9.4) Rao-scott x2 5.314 13.362 30.5797 0.234 24.140 2.521 9.212 P value 0.021 <0.001 <0.001 0.629 <0.001 0.112 0.002 Senior high school students Total 28.3 (27.0, 29.6) 44.5 (42.6, 46.4) 46.0 (44.1, 47.9) 23.4 (22.2, 24.5) 59.0 (57.0, 61.1) 42.0 (39.9, 44.1) 10.9 (9.7, 12.0) Gender Boys 29.5 (28.2, 30.9) 47.7 (45.6, 49.8) 48.5 (46.5, 50.5) 25.1 (23.8, 26.4) 61.6 (59.5, 63.7) 49.4 (47.1, 51.7) 15.0 (13.3, 16.6) Girls 27.0 (25.7, 28.4) 41.3 (39.4, 43.3) 43.5 (41.5, 45.5) 21.5 (20.2, 22.9) 56.4 (54.3, 58.6) 34.5 (32.4, 36.6) 6.8 (5.9, 7.7) Rao-scott x2 23.822 95.477 69.425 31.612 75.061 362.097 243.445 P value <0.001 <0.001 <0.001 <0.001 <0.001 <0.001 <0.001 Residence Urban 30.4 (28.8, 32.0) 46.1 (43.9, 48.3) 48.7 (46.5, 50.9) 22.1 (20.8, 23.5) 62.0 (59.6, 64.3) 40.1 (37.4, 42.7) 9.5 (7.8, 11.1) Rural 26.4 (24.6, 28.3) 43.1 (40.2, 46.1) 43.7 (40.6, 46.7) 24.6 (22.7, 26.5) 56.5 (53.3, 59.6) 43.6 (40.4, 46.8) 12.2 (10.6, 13.7) Rao-scott x2 10.502 2.536 7.031 4.512 7.724 2.880 5.222 P value 0.001 0.111 0.008 0.034 0.006 0.090 0.022 Vocational senior high school students Total 29.4 (27.6, 31.2) 38.5 (36.4, 40.6) 39.5 (37.5, 41.6) 18.9 (17.3, 20.4) 52.8 (50.5, 55.2) 42.5 (40.0, 45.0) 8.5 (7.4, 9.7) Gender Boys 32.2 (30.2, 34.3) 41.9 (39.3, 44.6) 42.6 (40.1, 45.1) 20.5 (18.6, 22.4) 56.0 (53.1, 58.8) 50.5 (47.5, 53.5) 11.8 (10.3, 13.4) Girls 26.0 (24.1, 28.0) 34.3 (32.1, 36.6) 35.9 (33.6, 38.1) 17.0 (15.1, 18.9) 49.1 (46.5, 51.7) 32.9 (30.5, 35.3) 4.6 (3.6, 5.7) Rao-scott x2 40.052 32.374 29.161 9.906 23.501 248.415 116.142 P value <0.001 <0.001 <0.001 0.002 <0.001 <0.001 <0.001 Residence Urban 31.1 (28.5, 33.7) 40.0 (37.0, 42.9) 41.3 (38.5, 44.2) 18.5 (16.3, 20.8) 54.9 (51.5, 58.3) 43.6 (40.0, 47.2) 7.4 (6.1, 8.7) Rural 27.4 (25.1, 29.7) 36.7 (33.7, 39.8) 37.4 (34.4, 40.5) 19.4 (17.4, 21.3) 50.4 (47.2, 53.6) 41.2 (37.6, 44.7) 9.8 (7.9, 11.8) Rao-scott x2 4.529 2.230 3.432 0.315 3.633 0.909 4.902 P value 0.033 0.135 0.064 0.575 0.057 0.340 0.027 * In the seven days preceding the investigation date.
† In the thirty days preceding the investigation date.
§ The difference between the junior high school, senior high school and vocational senior high school students was statistically significant (P<0.01).Table 2. Prevalence of secondhand smoke exposure among secondary school students in China in 2023, weighted% (95% CI).
Approximately 35.4% of secondary school students reported exposure to secondhand smoke on school premises over the past 30 days, with prevalence higher among boys (40.7%) than girls (29.5%). Students in SHS and VSHS reported significantly higher rates of exposure (42.0% and 42.5%, respectively) compared to those in JHS (30.2%), without marked differences between urban and rural areas. Notably, 8.3% of students observed teachers smoking in schools almost every day during the past 30 days; this incidence was higher among boys (11.1%) than girls (5.3%), and more common in rural areas (9.5%) compared to urban locations (7.1%). Among student categories, SHS attendees (10.9%) reported higher rates compared to JHS peers (6.9%). Significant geographical disparities were observed in the prevalence of secondhand smoke exposure within schools across different PLADs, ranging from 23.3% in Shanghai to 51.0% in Chongqing. A higher prevalence was noted particularly in the southwestern (Chongqing, Xizang, and Yunnan PLADs) and central regions (Hubei, Hunan, and Anhui PLADs). For JHS students, exposure rates varied from 18.4% in Inner Mongolia to 46.8% in Chongqing; for SHS students, they ranged from 25.2% in Shanghai to 58.0% in Hubei; and for VSHS students, from 26.7% in Xinjiang to 54.3% in Chongqing. It is significant that the prevalence exceeded 40% in 13 out of the 31 PLADs among VSHS students, a figure substantially higher than those observed for JHS and SHS students (Figure 2).
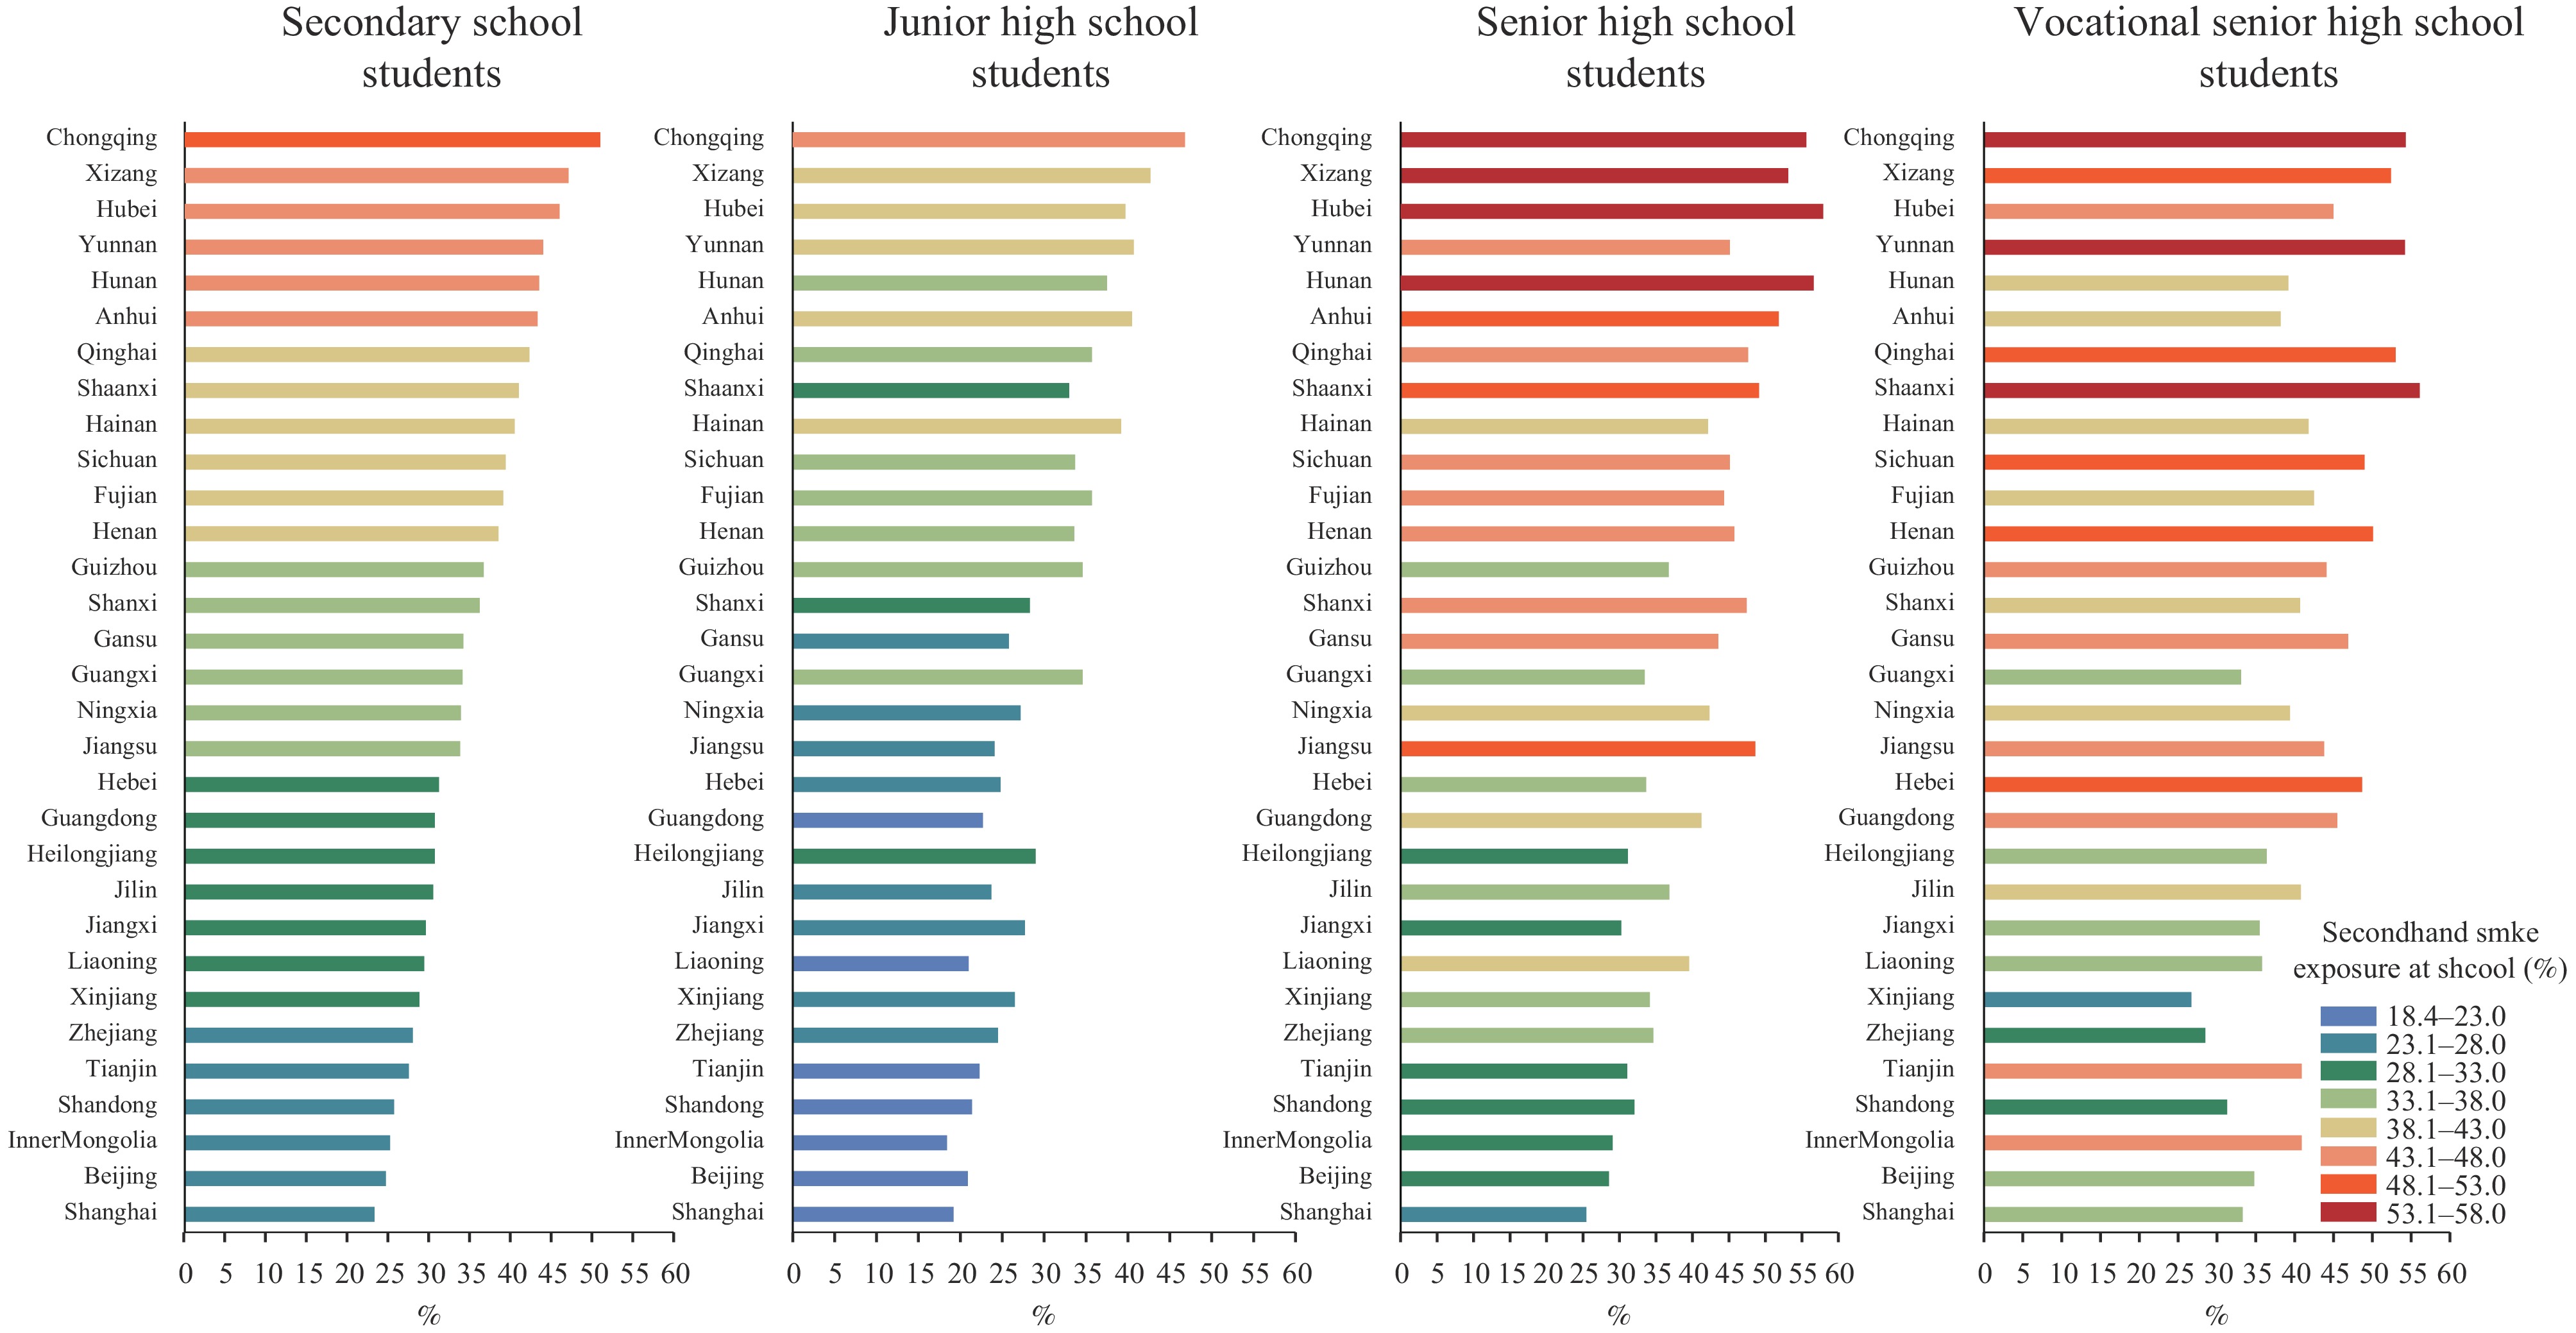 Figure 2.
Provincial disparities in the prevalence of secondhand smoke exposure at schools among secondary school students in China by school type, 2023.
-
Experimental cigarette use is an important marker for the onset of smoking behaviors. In 2023, the prevalence of experimental cigarette use among secondary school students decreased by 18.0%, from 16.7% in 2021 to 13.7%. Specifically, there was a reduction of 22.2% among SHS students (from 18.9% to 14.7%) and a 22.8% decline among VSHS students (from 28.9% to 22.3%). However, rates remained unchanged among JHS students (8). This decline may be attributed to enhanced tobacco control measures, including anti-tobacco campaigns, health education programs, and bans on tobacco advertising aimed at youth.
The prevalence of current cigarette use among secondary school students in China remained stable at 4.2% in 2023, unchanged from 2021, with an estimated 3.76 million students reporting active cigarette consumption. Among JHS students aged 13–15 years, the prevalence was 3.1%, which is significantly lower than the global average of 4.8% and the 4.3% prevalence observed in the Western Pacific region (9). In contrast, VSHS students exhibited significantly higher rates of cigarette use compared to both SHS and JHS students. Specifically, the prevalence of current cigarette use among VSHS students was three times that of JHS and SHS students, with the rates of frequent and daily use being six times and three times higher, respectively. Additionally, significant geographic variations in cigarette use were noted across PLADs in China. PLADs in the eastern and southeastern regions reported lower prevalence rates compared to those in the southwestern regions, aligning with the epidemiological patterns of tobacco use observed among Chinese adults.
The rigorous implementation and enforcement of anti-smoking laws have been proven to significantly reduce exposure to secondhand smoke in indoor public spaces. As of 2023, an alarming 37.5% of secondary school students reported exposure to secondhand smoke in such environments, highlighting the urgent need for national legislation prohibiting smoking in these areas to protect the health of adolescents. Additionally, in 2023, approximately 29.4% of secondary school students reported exposure to secondhand smoke at home. Notably, this exposure rate was markedly higher among students with parents who smoke (47.6%), compared to those with non-smoking parents (9.6%). These findings indicate that a significant number of parents continue to smoke in the presence of their children, underscoring the need for increased educational and regulatory efforts to mitigate secondhand smoke exposure in domestic settings.
Establishing smoke-free environments in schools is imperative for curtailing the onset of smoking among adolescents (10). As of 2023, 35.4% of secondary school students reported being exposed to secondhand smoke on school premises, reflecting an 11.3% decrease from the 39.9% reported in 2021. This reduction was noted across various educational levels: exposure among JHS students declined from 34.6% to 30.2% (a 12.7% decrease), and among SHS students from 47.8% to 41.9% (a 12.3% decrease). Notably, no improvement was observed among VSHS students, underscoring the necessity for intensified efforts to establish smoke-free environments, specifically within VSHS settings. Additionally, PLADs in southwestern China, known for higher cigarette consumption rates, reported increased exposure to secondhand smoke in schools compared to areas in the eastern and southeastern regions, where cigarette usage is typically lower. Moreover, 8.3% of students reported frequently observing teachers smoking on school grounds, almost daily. This behavior not only sets a negative example but also directly subjects students to secondhand smoke, highlighting the critical need for the inclusion of smoking cessation programs for teachers in the implementation of smoke-free school policies.
This study is subject to some limitations. First, the data collection was dependent on self-reports, which are vulnerable to recall and reporting biases, potentially leading to underreporting. Additionally, the classification of areas as urban or rural relied exclusively on terms such as “district or QU” and “county, XIAN, MENG, or QI.” Despite this, our classification approach is consistent with that used in the majority of research conducted within China.
In conclusion, the prevalence of cigarette smoking was notably higher among VSHS students compared to those in SHS and JHS levels. There was a stable trend in current smoking rates and a decrease in experimental smoking from 2021 to 2023. Additionally, the exposure to secondhand smoke within schools experienced a decline among secondary school students during the same period. This reduction was significant in JHS and SHS cohorts, but no significant change was noted among VSHS students. These findings underscore the urgent need for targeted tobacco control policies for secondary school students, particularly those at the VSHS level, with a focus on creating smoke-free school environments.
-
No conflicts of interest.
-
All colleagues and local staff from CDCs and health education institutions.
HTML
| Citation: |

|