

 Download:


-
Typhoid/paratyphoid fever are globally pervasive infectious diseases that present similar clinical symptoms, such as fever and diarrhea, and may precipitate severe complications in advanced cases. Clinically, it is challenging to distinguish between the two without the aid of laboratory testing, leading to their joint categorization as enteric fever. As reported in 2019, there are an estimated 9 million annual cases of enteric fever worldwide (1). Nevertheless, this figure could be an underestimate given the potential for higher prevalence in underdeveloped regions lacking comprehensive surveillance data (2). In China, the incidence of enteric fever surpasses the global average — a statistic that has persisted since an estimate was made a decade ago — positioning it as a significant public health concern (3). This elevated incidence in China is attributed to distinctive regional features of the disease (4), with notably higher rates reported in the southwestern and southern regions, likely influenced by the specific geographic and culinary practices in these areas (5).
Most research on typhoid/paratyphoid fever has been conducted within the context of developed nations or select developing countries, which may not accurately reflect the situation in China (6-8). Consequently, there is a pressing demand for the development of tailored estimation models and strategies that address China’s distinct public health landscape. In this study, we endeavor to assess the prevalence of typhoid/paratyphoid fever across China over a period of 12 years and explore its associated risk factors. Our primary objective is to discern the epidemic trends and offer data-driven prevention and control measures for typhoid/paratyphoid fever, with implications for both China and the international community.
-
Data regarding weekly and annual cases of typhoid/paratyphoid fever were acquired from the Infectious Disease Reporting System. Provincial data for annual average precipitation and temperature were sourced from the National Meteorological Information Center. Furthermore, information on the annual per capita gross domestic product was collected from the Cities’ Statistical Yearbook, while the annual average nighttime light index data were procured from the National Oceanic and Atmospheric Administration. Data on the prevalence of sanitary toilets and the utilization of safe drinking water were gathered from the Environmental Statistical Yearbook. These datasets pertained to Chinese provincial-level administrative divisions (PLADs) and spanned the period from 2011 to 2022.
-
Geographical distribution maps illustrating the incidence and cases of typhoid/paratyphoid fever in China were created through ArcGIS Pro (version 3.0.0, ESRI, Inc., 2018, CA, USA).
To investigate the spatial patterns and inter-provincial correlations of typhoid/paratyphoid fever incidence, we employed both global and local spatial autocorrelation analyses. Utilizing R software (version 4.3.2, R Core Team, 2023, Vienna, Austria), our aim was to calculate the Moran’s I coefficient to evaluate the extent of spatial clustering of the disease incidence rates at a national level (global spatial autocorrelation) and within particular provincial-level administrative division (PLAD, local spatial autocorrelation). The global Moran’s I coefficient was first computed, followed by the creation of a scatterplot that succinctly depicted the nationwide spatial clustering trends of typhoid/paratyphoid fever incidence rates. To further delineate the spatial clustering within specific regions, we executed local spatial autocorrelation analysis and determined the local Moran’s I coefficients. These coefficients illuminated the spatial correlations of each PLAD relative to its neighbors, aiding in pinpointing concentrated areas of disease incidence or anomalies. Ultimately, we utilized ArcGIS Pro to map the local Moran’s I coefficients geographically. This map clearly illustrated the spatial autocorrelation between regions using a color gradient, thereby providing an intuitive visual representation of the data.
To assess the geographical center and temporal variations of typhoid/paratyphoid fever incidence, centroid transfer analysis was employed. This analysis involved calculating the weighted average position of the incidence rates for each PLAD annually to determine the centroid location for that year. By comparing centroid positions between consecutive years, trends in spatial shifts over time were identified. The centroid’s position in 2015–2016 served as the reference point, demarcating the spatial distribution center for that timeframe. China was divided into western, central, and eastern parts based on the centroid’s longitude, with the centroid acting as the dividing line. The region to the west, east, and center of the centroid was categorized as the western, eastern, and central parts, respectively.
A heatmap was created using the pheatmap package in R software to analyze the seasonal variations of typhoid and paratyphoid fever cases across different PLADs in China.
-
To investigate the potential determinants of typhoid/paratyphoid fever incidence at the provincial level, we constructed a Generalized Estimation Equation (GEE) model leveraging the geepack package in R. We employed a Poisson regression approach within the GEE framework, with the incidence rate serving as the response variable. The explanatory variables encompassed sanitation, socioeconomic, and meteorological factors. The study employed a “Year-over-Year” comparison method, which involves assessing a specific indicator for a given year relative to its value in the preceding year. To detect multicollinearity among these variables, we utilized the variance inflation factor, setting the cut-off threshold at 10 to account for practical intervention strategies against typhoid/paratyphoid fever. In the factor analysis, we established a significance level of 0.05 to mitigate the risk of Type-II errors.
-
Between 2011 and 2022, the incidence of typhoid/paratyphoid fever in China decreased from 11,247 cases to 5,900 cases, with a reduction in the incidence rate from 0.844 to 0.443 per 100,000 individuals (Figure 1A). The southern, central, and northwestern regions of China had higher numbers of cases compared to other areas, particularly the southern region (Figure 1B). The highest incidence rate was observed in the southwestern region. Despite relatively more cases in the central and northwestern regions, their large population size resulted in relatively lower calculated incidence rates (Figure 2A).
 Figure 1.
Prevalence and spatial clustering of typhoid/paratyphoid fever incidence in China. (A) Number of cases and incidence of typhoid/paratyphoid fever in China from 2011 to 2022. (B) Number of cases of typhoid/paratyphoid fever by PLAD in China from 2011 to 2022. (C) A Moran plot illustrating the global spatial autocorrelation. (D) A geographic distribution map of China’s PLADs according to the local Moran’s I coefficients, demonstrating local spatial autocorrelation.
Map approval number: GS京 (2024)0679号.
Abbreviation: PLADs=provincial-level administrative divisions; SAR=special administrative region.
 Figure 2.
The shift in the centroid of typhoid/paratyphoid fever incidence. (A) Incidence and the shift of typhoid/paratyphoid fever centroid by PLAD in China from 2011 to 2022. (B) Incidence rate in the Eastern, Central, and Western China from 2011 to 2022.
Note: Eastern region includes PLADs of Jiangsu, Hebei, Beijing, Tianjin, Shanxi, Liaoning, Jilin, Heilongjiang, Shanghai, Zhejiang, Anhui, Fujian, Jiangxi, Shandong, Henan, Hubei, Hunan, Guangdong; Central region includes PLADs of Inner Mongolia, Guangxi, Hainan, Chongqing, Guizhou, Shaanxi, Ningxia; and Western region includes PLADs of Yunnan, Xizang, Xinjiang, Sichuan, Gansu, Qinghai.
Map approval number: GS京 (2024)0679号.
Abbreviation: PLADs=provincial-level administrative divisions; SAR=special administrative region.
Preliminary observations indicated a potential clustering trend in the spatial distribution of typhoid/paratyphoid fever. To confirm this hypothesis, the study employed global and local spatial autocorrelation analyses. The global spatial autocorrelation analysis utilized Moran’s I coefficients; the results, which were statistically significant (P<0.05), revealed a positive spatial autocorrelation nationally. This indicated a clear spatial clustering pattern in the disease incidence rates among neighboring regions. Subsequently, a local spatial autocorrelation analysis was performed. PLADs like Yunnan Province and Guangxi Zhuang Autonomous Region exhibited a strong positive spatial correlation, suggesting similar patterns in disease incidence. In contrast, Xizang Autonomous Region and Sichuan Province showed dissimilar patterns, indicating varying disease incidence rates. While most PLADs demonstrated some level of similarity in their incidence rates, there were also noticeable differences (Figure 1D).
Between 2011 and 2015, the geographical center (centroid) of typhoid/paratyphoid fever cases was predominantly in the western region. However, since 2016, there has been a noticeable shift of this centroid toward the east (Figure 2A). Consequently, for analytical purposes, we categorized the PLADs into three regional groups — western, central, and eastern — based on the transition of the centroid between 2015 and 2016. This migration of the centroid eastward may be attributable to varying trends in incidence rates by region: there was a marked decrease in the western region, a gradual reduction in the central region, and in the eastern region, the incidence rate exhibited minor fluctuations with an overall downward trend (Figure 2B).
-
We examined the seasonal trends of typhoid/paratyphoid fever by analyzing the distribution of weekly cases in different PLADs and generating a heatmap. The incidence peaked during summer and fall in PLADs with moderate to high temperatures. Conversely, PLADs with lower temperatures did not display distinct seasonal patterns. Notably, in the Xizang Autonomous Region, there were sporadic peaks in typhoid/paratyphoid fever cases, indicating possible outbreaks (Figure 3).
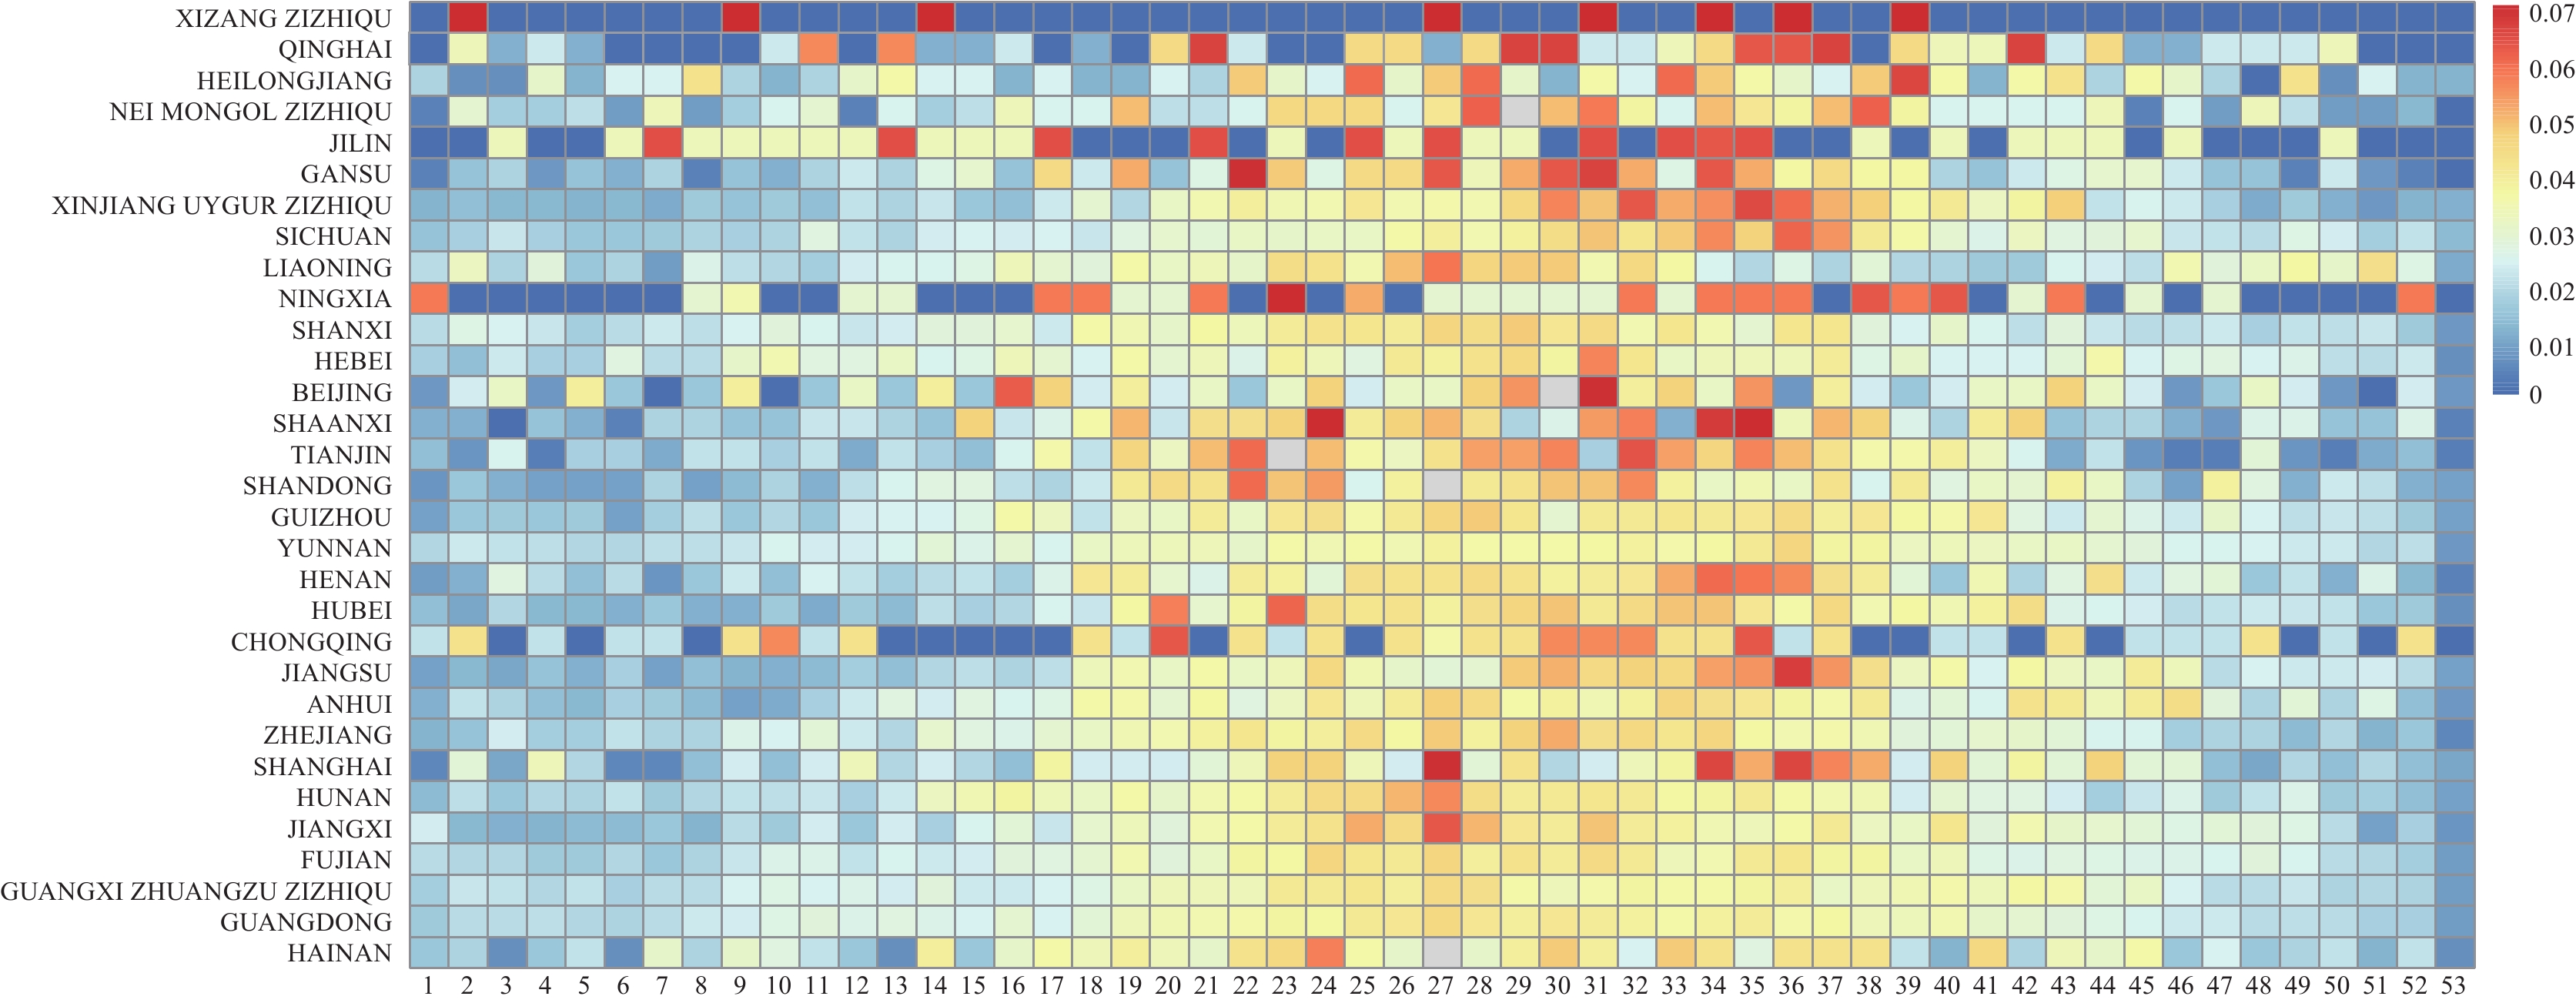 Figure 3.
Heatmap depicting the proportion of weekly typhoid/paratyphoid fever cases in Chinese PLADs from 2011 to 2022.
Note: The PLADs are sorted based on the average temperatures from the years 2011 to 2022, showcasing the seasonal variations in typhoid/paratyphoid fever across the regions.
Abbreviation: PLADs=provincial-level administrative divisions.
-
Based on the analysis above, the incidence of typhoid/paratyphoid fever in China has shown a decrease, with varying prevalence among different PLADs. To explore the influencing factors behind this trend, we utilized a GEE model that accounted for spatial autocorrelation lag effects. Parameters such as annual average temperature, annual average precipitation, comparison of night-time light index, and annual average temperature were found to influence the occurrence of typhoid/paratyphoid fever. This indicates a correlation between typhoid/paratyphoid fever and socioeconomic and meteorological indicators (Figure 4).
 Figure 4.
Analysis of potential influencing factors of typhoid/paratyphoid fever.
Abbreviation: Coef=regression coefficient; CI=confidence interval.
* represents P<0.05.
-
In China, the prevalence of typhoid/paratyphoid fever decreased from 2011 to 2022. This study examined the spatial patterns, seasonal variations, and potential influencing factors of these fevers across China. The research revealed that meteorological and socioeconomic factors might influence the occurrence of these diseases. Previous studies have also shown a connection between meteorological conditions, socioeconomic factors, and the incidence of these fevers (9–10). Particularly in the southwestern region, a high spatial autocorrelation and incidence rate were observed, designating it as a high-risk cluster for outbreaks that require targeted prevention measures. Improving economic conditions could aid in reducing the spread of these diseases. Notably, prior large-scale health initiatives in China, such as enhancing water supply and sanitation facilities before 2011, produced significant outcomes, potentially explaining why health indicators have not played a crucial role in recent trends of typhoid/paratyphoid fever incidence. Analyzing the geographic distribution and trends of these fevers indicates that while incidence rates decreased in central and eastern regions, the decline was more rapid in western PLADs, resulting in an eastward shift after 2015.
Our study introduced innovative insights into the spatiotemporal patterns of typhoid/paratyphoid fever in China, addressing a gap in the existing literature (11–12) by examining these patterns through spatial autocorrelation and sequential comparison methods. The analysis revealed heightened seasonality of typhoid/paratyphoid fever in PLADs with higher temperatures, particularly showing high-incidence areas in the southwestern region of China.
Despite these findings, our study has several limitations. First, there is the potential for overlooking certain factors that could influence typhoid/paratyphoid fever. Second, our study is susceptible to the modifiable areal unit problem (MAUP) and spatial heterogeneity, which are common issues inherent in spatial data analysis.
In conclusion, we observed a notable decline in the occurrence of typhoid/paratyphoid fever in western China, leading to a decrease in the national incidence rate. Moreover, we pinpointed modifiable factors, including socioeconomic variables, suggesting novel strategies for prevention. Although encountering obstacles, our study has bridged certain existing knowledge deficits, aiming to stimulate forthcoming public health initiatives.
-
No Conflicts of interest
HTML
Data Sources
Epidemiological Trend of Typhoid/Paratyphoid Fever
Analysis of the Potential Influencing Factors of Typhoid/Paratyphoid Fever
Prevalence and Spatial Clustering of Typhoid/Paratyphoid Fever Incidence in China
Seasonal Distribution of Typhoid/Paratyphoid Fever Incidence in the PLADs
Possible Influencing Factors of Typhoid/Paratyphoid Fever
| Citation: |

|