

 Download:


-
Since December 2019, the global spread of severe acute respiratory syndrome coronavirus 2 (SARS-CoV-2) has placed unprecedented strain on healthcare systems and significantly disrupted daily life (1–4). London has experienced three major epidemic waves from January 2020 to April 2021, each characterized by the dominance of different SARS-CoV-2 variants that emerged through successive mutations, specifically Alpha (B.1.1.7), Delta (B.1.617), and Omicron (B.1.1.529). Notably, due to extensive vaccination efforts and the reduced severity of the Omicron variant, the third wave resulted in fewer hospitalizations compared to previous waves. Therefore, a comprehensive analysis of daily coronavirus disease 2019 (COVID-19) trends in London is essential to understand transmission patterns, assist policymakers in developing prevention strategies, and improve public health outcomes and awareness (5–6).
Epidemiological modeling research aimed at examining variations in COVID-19 case numbers encounters challenges frequently due to the non-linear complexity of pandemic-related data, as discussed by Stanovov et al. (7). In an attempt to manage this complexity, Huang et al. and Dong et al. utilized the empirical mode decomposition (EMD) method to effectively break down non-linear data into identifiable components. However, this method lacks a solid mathematical foundation (8–9). In contrast, the variational mode decomposition (VMD) method, employed by Saadaoui et al., provides an alternative but struggles to separate signal components that are indistinct in the Fourier spectrum (10). To surpass these limitations, Qian et al. (11–13) have developed the adaptive Fourier decomposition (AFD), which offers a robust mathematical structure and improved adaptation to the signal wave curve, facilitating a more precise analysis of COVID-19 case fluctuations (
Supplementary Material ).In this study, we employed the AFD method to analyze daily COVID-19 infection trends in London. AFD’s advanced time-frequency models effectively address scale aliasing issues, allowing for accurate measurement of trends’ direction and velocity. The AFD model, through signal decomposition into distinct components, successfully pinpointed significant peaks during the study period. Furthermore, we conducted a comparative analysis using EMD and VMD methods to enhance the robustness of our findings.
-
There are a few different types of AFD, including core AFD, cyclic AFD, and unwinding AFD, which are broadly used in numerous fields (14-23). We proposed a novel optimization algorithm (Equation 1), viewed as an addition to the core AFD method. To secure sufficient decomposition results for large-scale data, extra layers of decompositions are processed. However, the generation of superfluous data is unavoidable. Therefore, by using the new component constructing strategy and merging partially decomposed components, the accuracy and reliability of the data can be improved, no matter how large or small the frequency signals are. As a result, we constructed new components based on the decomposition results (13):
$$ {D}_{p}\left(q\right)=\sum\limits_{m=pq-q+1}^{pq}{{C}_{m}B}_{m}\left(z\right), $$ (1) $$ wherez={e}^{jt}, $$ $$ {C}_{m}=\left\langle{{F}_{m},{e}_{\left\{{a}_{m}\right\}}}\right\rangle, $$ $$ {{\mathrm{and}}\;B}_{m}\left(z\right)=\frac{\sqrt{1-{\left|{a}_{m}\right|}^{2}}}{1-{\bar{a}}_{m}z}\prod _{k=1}^{m-1}\frac{z-{a}_{k}}{1-{\bar{a}}_{k}z}. $$ The original signal was obtained by constructing all of the components (Equation 2).
$$ {W}_{q}=\sum\limits_{p=1}^{r}{D}_{p}\left(q\right) $$ (2) -
In this study, we conducted a detailed analysis of the daily fluctuations in COVID-19 case counts in London from January 31, 2020, the date of the first confirmed case, to February 24, 2022 (Figure 1), when the Prime Minister announced the removal of all legal restrictions related to SARS-CoV-2.
 Figure 1.
Daily COVID-19 infections in London from January 31, 2020 to February 24, 2022.
Abbreviation: COVID-19=coronavirus disease 2019. -
Figure 2 illustrates a method for constructing new components using the AFD algorithm, as outlined in the Supplementary Method. The process involves analyzing London’s daily COVID-19 case count data with the AFD algorithm to discern the number of infection cases at different time-frequency scales. This enhanced method merges partially decomposed components, improving data reliability. Figure 3 displays the first to eighth vertical lines representing the frequency components from lowest to highest. These lines indicate shifts in the number of infections at various scales, transitioning from long-term to short-term changes. The horizontal lines labeled a, b, and c represent the construction methods for one to three components, respectively, as detailed in Equation 1. These lines demonstrate variations in daily COVID-19 infection counts under different epidemic prevention policies during various AFD construction stages.
 Figure 2.
Construction of a new component flowchart for AFD.
Abbreviation: AFD=adaptive Fourier decomposition. Figure 3.
Various new construction components based on AFD. (A) AFD-based decompositions; (B) AFD-second decompositions; (C) AFD-third decompositions.
Abbreviation: AFD=adaptive Fourier decomposition. -
The results depicted in Figure 3 indicate that the primary components of the enhanced construction follow a trend similar to the daily infection counts in London during the analysis period (Table 2). Notably, the elevated vaccination rates played a crucial role in establishing herd immunity, effectively protecting against the variant.
Wave Correlations (P value) between components and original methods Correlations (P value) between components of distinct methods AFD-based AFD-second AFD-third AFD-based&
AFD-secondAFD-based&
AFD-thirdAFD-second&
AFD-thirdComp. 1 0.834* 0.926* 0.945* 0.900* 0.980* 0.882* (0.000) (0.000) (0.000) (0.000) (0.000) (0.000) Comp. 2 0.403* 0.445* 0.468* 0.907* 0.950* 0.862* (0.000) (0.000) (0.000) (0.000) (0.000) (0.000) Comp. 3 0.187* 0.237* 0.281* 0.787* 0.843* 0.664* (0.000) (0.000) (0.000) (0.000) (0.000) (0.000) Comp. 4 0.146* 0.211* 0.230* 0.694* 0.917* 0.637* (0.000) (0.000) (0.000) (0.000) (0.000) (0.000) Comp. 5 0.152* 0.177* 0.200* 0.856* 0.884* 0.757* (0.000) (0.000) (0.000) (0.000) (0.000) (0.000) Comp. 6 0.091* 0.131* 0.160* 0.698* 0.817* 0.571* (0.000) (0.000) (0.000) (0.000) (0.000) (0.000) Comp. 7 0.221* 0.200* 0.178* 0.904* 0.886* 0.800* (0.000) (0.000) (0.000) (0.000) (0.000) (0.000) Comp. 8 0.065* 0.064* 0.062* 0.981* 0.980* 0.961* (0.000) (0.000) (0.000) (0.000) (0.000) (0.000) Note: All correlation coefficients were estimated using Pearson’s correlation method.
Abbreviation: AFD=adaptive Fourier decomposition.
* indicates that the correlation coefficient is statistically significant (P<0.001).Table 2. Correlations between new construction components and original infections.
From the third to the sixth components, there were notable frequency peaks during the third wave, leading to significant increases and decreases in COVID-19 cases around December 2021. This pattern is linked to the relaxation of preventive measures, such as allowing household mixing, marking the beginning of a phased lockdown exit. In contrast, the seventh and eighth components showed marked fluctuations starting in 2020, with minor peaks during the first wave and more pronounced oscillations observed during the second and third waves. These trends suggest that these waves were captured at a relatively high frequency, likely due to early policies aimed at reducing social contact, which were critical in controlling the transmission of SARS-CoV-2 in London.
-
Figure 3 presents a horizontal arrangement of results from the AFD-based, AFD-second, and AFD-third new construction components. The interrelations between results from various new construction components were further analyzed, as detailed in Table 2. Notably, improvements in the first and second order components were evident in the third-order new construction components, leading to a more precise depiction of daily infection rates. The first-order component from the third order displayed a notably higher coefficient value (0.955) compared to the other seven components, highlighting its superior efficacy. Additionally, Table 2 emphasizes the significance of lower-frequency components in depicting the overall trend of the pandemic.
Next, we analyzed the third-order decomposition results utilizing the AFD method and compared these with the results from two other widely used time-frequency methods, EMD and VMD. Figure 4 illustrates the decomposition results for EMD and VMD in columns b and c, respectively. Furthermore, Table 3 displays the correlations between the components of each method and the initial COVID-19 infection counts, as established via Pearson correlation analysis (
Supplementary Material ) (21).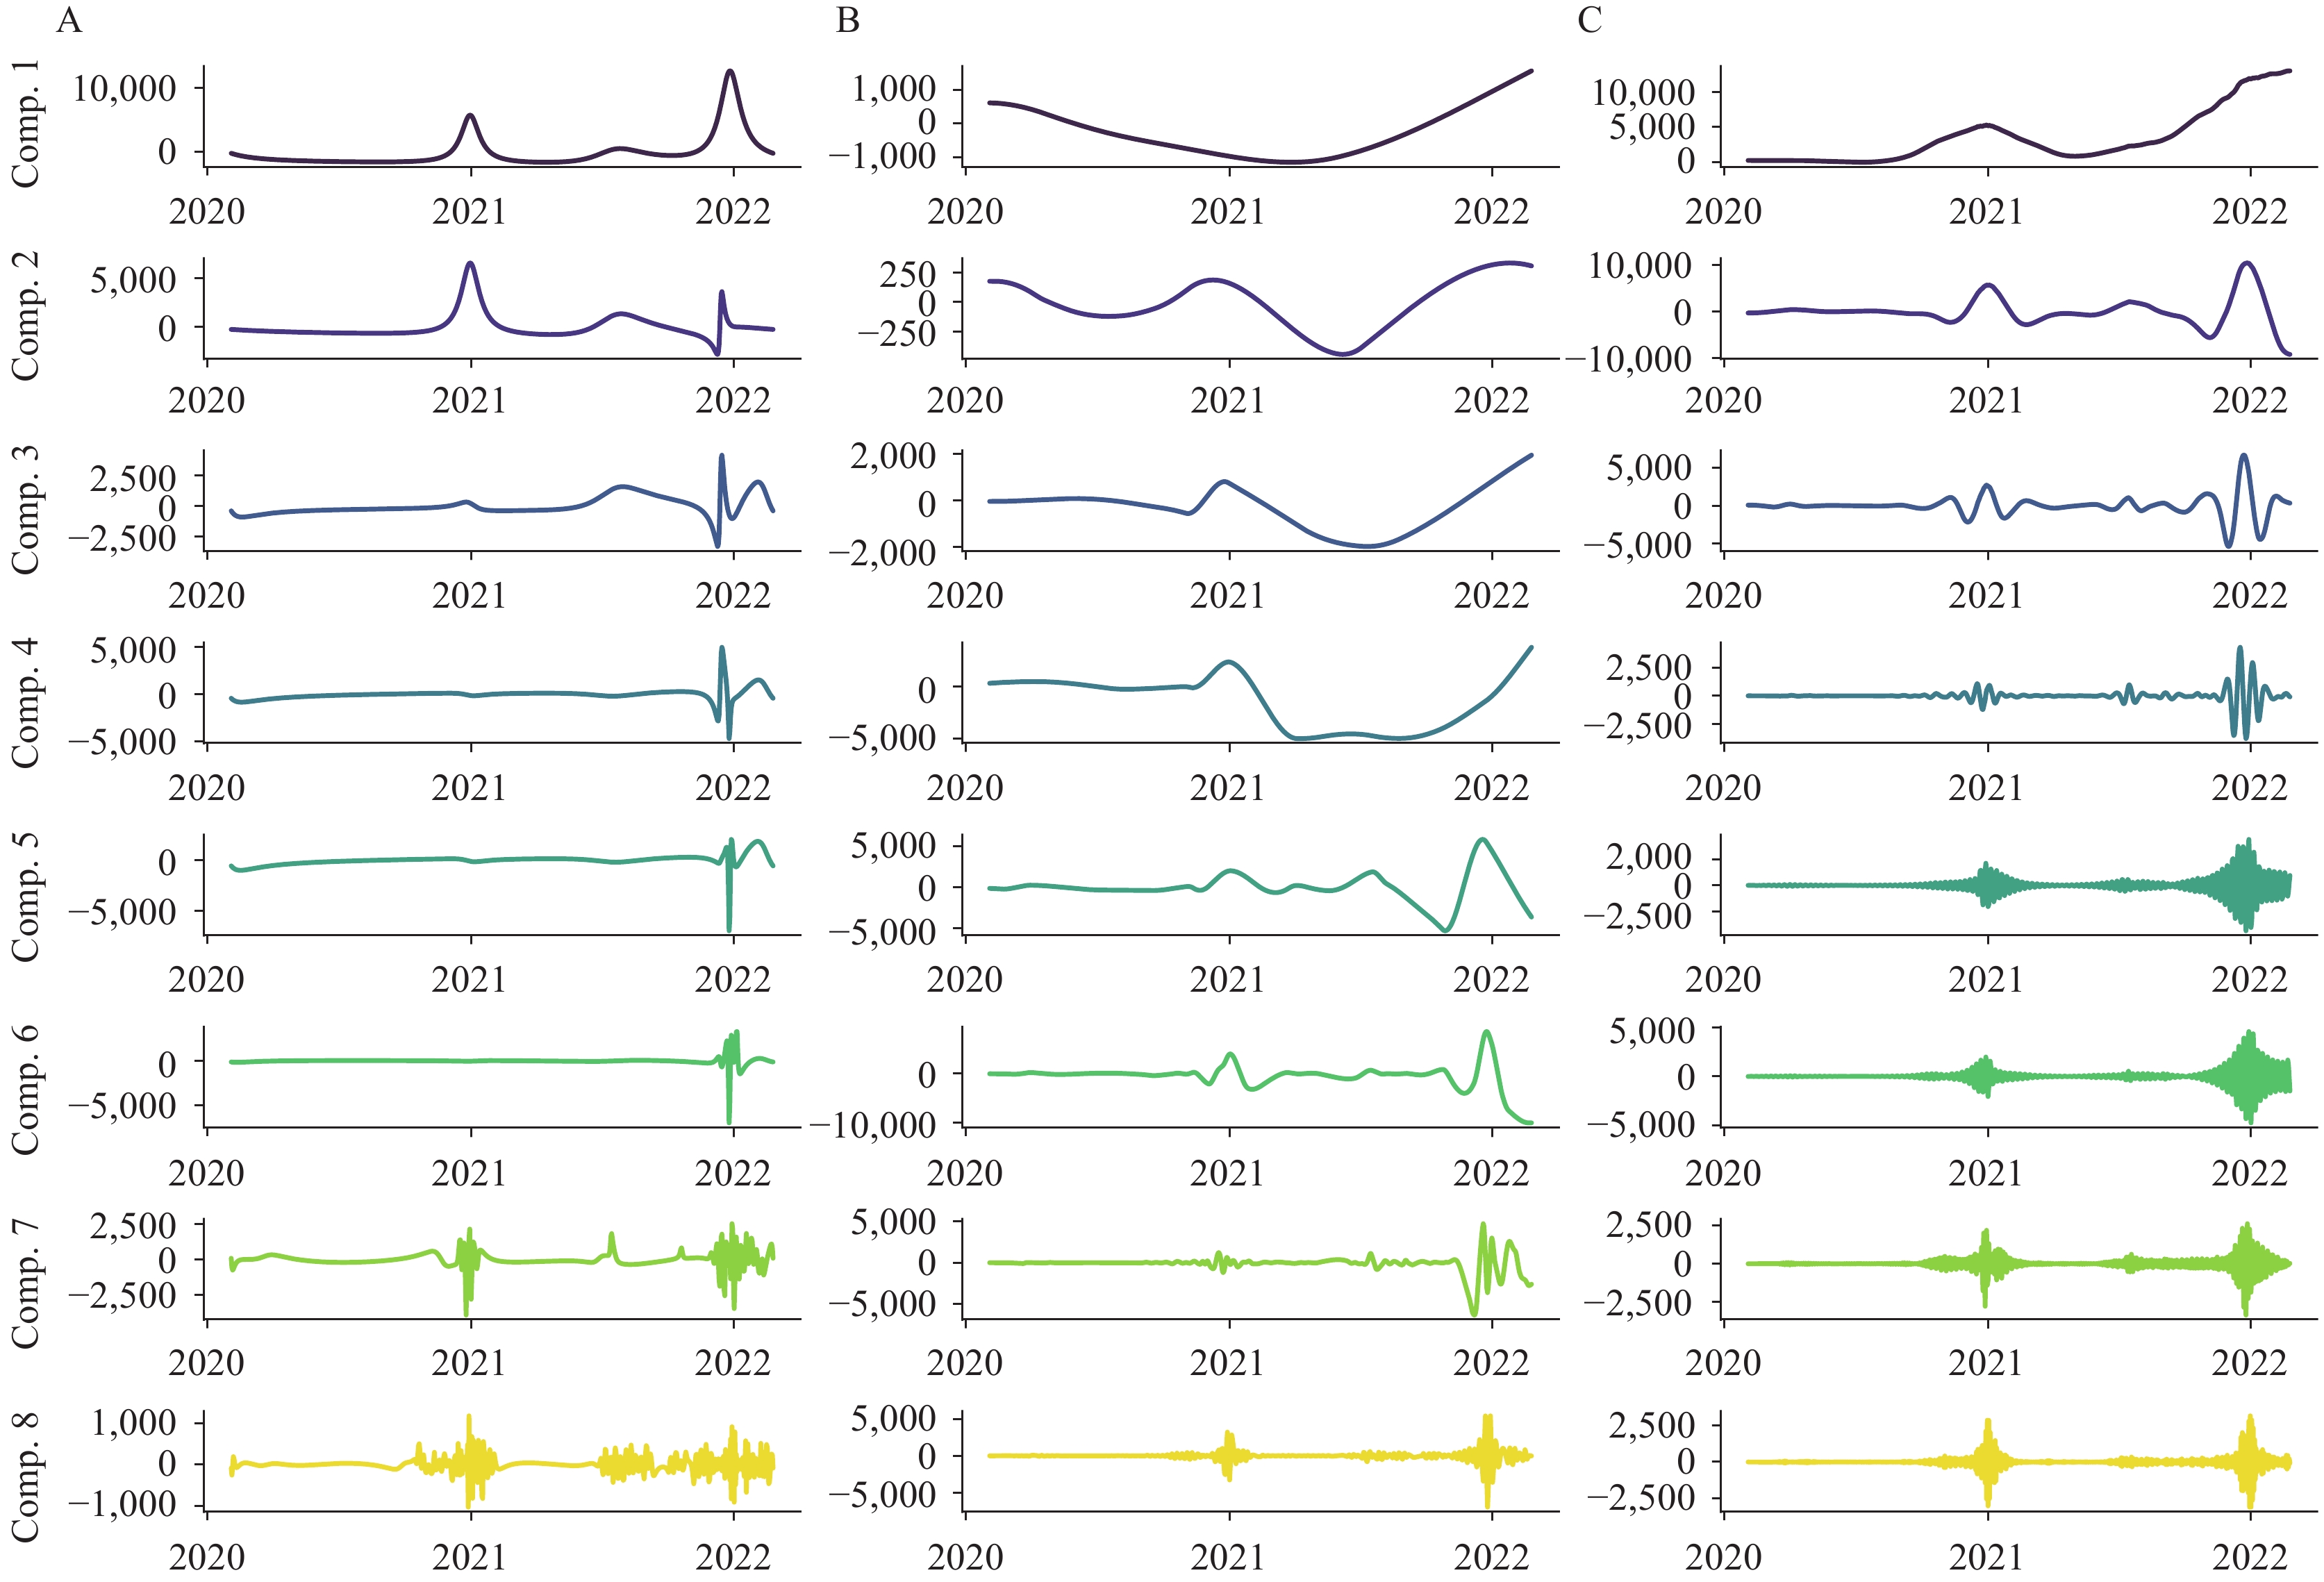 Figure 4.
Decompositions based on AFD-third, EMD, and VMD. (A) AFD-third decompositions; (B) EMD-based decompositions; (C) VMD-based decompositions.
Abbreviation: AFD=adaptive Fourier decomposition; EMD=empirical mode decomposition; VMD=variational mode decomposition.Wave Correlations (P value) between components and original methods Correlations (P value) between components of distinct methods AFD-third EMD-based VMD-based AFD-third&
EMD-basedAFD-third&
VMD-basedEMD-based&
VMD-basedComp. 1 0.945* 0.503* 0.735* 0.517* 0.710* 0.675* (0.000) (0.000) (0.000) (0.000) (0.000) (0.000) Comp. 2 0.468* 0.389* 0.640* 0.115* 0.466* 0.096* (0.000) (0.000) (0.000) (0.000) (0.000) (0.000) Comp. 3 0.281* 0.142* 0.348* −0.251 0.230* 0.027* (0.000) (0.000) (0.000) (0.000) (0.000) (0.000) Comp. 4 0.230* 0.575* 0.151* −0.145 0.598* 0.008 (0.000) (0.000) (0.000) (0.000) (0.000) (−0.231) Comp. 5 0.200* 0.229* 0.182* −0.441 0.259* 0.004 (0.000) (0.000) (0.000) (0.000) (0.000) (−0.525) Comp. 6 0.160* 0.045 0.182* 0.239* 0.421* 0.001 (0.000) (−0.219) (0.000) (0.000) (0.000) (−0.933) Comp. 7 0.178* 0.193* 0.089** 0.434* 0.201* 0.008 (0.000) (0.000) (−0.014) (0.000) (0.000) (−0.242) Comp. 8 0.062* 0.259* 0.059 0.240* 0.364* 0.228* (0.000) (0.000) (−0.107) (0.000) (0.000) (0.000) Note: All correlation coefficients were estimated using Pearson’s correlation method.
Abbreviation: AFD=adaptive Fourier decomposition; EMD=empirical mode decomposition; VMD=variational mode decomposition.
* indicates that the correlation coefficient is statistically significant (P<0.001).Table 3. Correlations between components of different methods and original infections.
By calculating the Pearson correlation across components isolated by these three techniques, we further established that the AFD method outperforms others in extracting vital details about the effectiveness of government control policies. This analysis solidifies the AFD method as the most effective among the assessed methodologies in capturing relevant data.
-
In this research, findings from the third-order AFD construction for new components were integrated with daily COVID-19 infection counts to analyze the impact of epidemic prevention policies. The analysis was framed using the timeline of London’s three-wave epidemic, resulting in the division of the data into three segmented graphs (Figure 5). Notably, the components illustrated in these figures demonstrate correlation coefficients exceeding 0.7, falling within a 5% confidence interval (CI). Figure 5A illustrates the initial response to the epidemic in London. The seventh component in this figure indicates that the “delayed phase” policies preemptively mitigated the impact of this wave, effectively suppressing the spread of SARS-CoV-2 and curtailing the progression of the epidemic. Additionally, other policies implemented during the first wave, including various cancellations and disease containment measures, contributed to the gradual control of SARS-CoV-2 infections.
 Figure 5.
AFD components. (A) During the first wave; (B) during the second wave; (C) during the third wave.
Abbreviation: AFD=adaptive Fourier decomposition.Figure 5B depicts that starting in September 2020, London encountered a second epidemic wave, resulting in a second national lockdown. The first and second components of the AFD analysis from this period indicate that this policy effectively mitigated the epidemic’s impact, leading to a rapid decrease in daily COVID-19 infection counts. The effects of the second national lockdown were not immediate but became evident over time.
Figure 5C illustrates that despite the Omicron variant elevating the prevalence of SARS-CoV-2 to unprecedented levels, widespread vaccination efforts conferred both individual and herd immunity, providing sustained protection against severe disease in the population. The policies implemented during the third wave of the epidemic correlated with the primary component of the AFD results, suggesting that the impact of the two-dose vaccination policy on controlling the epidemic was moderate and underscores the necessity for its prolonged and continuous implementation.
-
Herein, we present a detailed analysis of daily variations in COVID-19 cases in London from January 31, 2020 to February 24, 2022. We compared the AFD method with the EMD and VMD methods to establish a clearer mathematical framework for such analyses (22–24).
Our findings indicated that the AFD variant algorithm proposed by Qian et al. does not fully correspond with the specific COVID-19 data from London (14–17). By reconfiguring components of the AFD, new combinations were developed (Figure 3B–3C), which surpassed the efficacy of the basic AFD model by Qian et al. (Figure 3A) (11–12,18–20).
The AFD variant algorithm was utilized to analyze the daily COVID-19 case numbers, facilitating a comprehensive examination of the epidemic’s spread dynamics. This method indicated that low-frequency components corresponded with the outbreak and declining phases of the epidemic, reflecting the long-term impacts of policies designed to mitigate SARS-CoV-2 transmission. Conversely, high-frequency components appeared to reflect the effects of short-term policies and variations due to stochastic factors.
During the SARS-CoV-2 pandemic, requires swift policy responses, but this urgency can lead to insufficient research and justification, resulting in blindness and instability. As the pandemic evolves, cities may need to adjust policies to adapt, but due to the time and procedures involved, policy adjustments may lag behind.
Therefore, we developed a novel method to monitor and assess the effectiveness of policies in London, one of the cities most severely affected globally. This approach tackles the challenge of uniformly measuring the timing of implementation and termination of epidemic prevention policies through quantitative evaluation indicators.
The use of the AFD method provides valuable perspectives on the immediate and prolonged impacts of interventions aimed at curbing the spread of SARS-CoV-2. It has proven to be an effective analytical tool for investigating COVID-19 pandemic data, and it offers crucial insights for shaping future preventive and public health strategies.
Wave Start time End time Main issues Government policy 1st Jan 31, 2020 Sep 6, 2020 The rapid increase in alpha variant spreading across London. Limited COVID-19 testing was available, therefore the number of confirmed cases was underestimated. The first national lockdown included a “stay at home” strategy, no mixing of households, closure of all shops selling non-essential goods and stopping all social events. 2nd Sep 7, 2020 Apr 12, 2021 The rapid rise in infections is attributed to the rapid spread of new delta variants causing high morbidity and mortality rates. The second national lockdown included staying in household bubbles, leisure and entertainment venues must be closed. Schools remained open
The third national lockdown includes leisure and entertainment that were still shut. However, meeting support bubbles and exercising with the household were allowed. Schools moved to remote learning.3rd Jul 1, 2021 Feb 24, 2022 Although the Omicron variant pushed the prevalence of the virus to unprecedented levels, the vaccine built up immunity, sustained protection against severe disease in the population and reduced severity of the Omicron variant. England began a phased exit from lockdown, Prime Minister announced all remaining domestic restrictions in law were removed. Table 1. Identified waves and corresponding control policies.
HTML
New Construction Components Based on AFD Results


Sample and Data
Enhanced Construction Components Using Results from AFD
Components Extracted Using the AFD Method
Construction Components Derived from AFD
Linking AFD to Government Policies
| Citation: |

|