

 Download:


-
Dengue fever, a mosquito-borne illness, can be caused by any of the four dengue virus serotypes (1). Currently, over 100 tropical and subtropical countries are disease-endemic, thus exposing more than a third of the global population to the risk of infection (2). Since 1978, there have been significant outbreaks in Chinese Mainland, resulting in 655,324 confirmed cases and 610 deaths until 2008. Initially, clustering was observed in southern coastal provincial-level administrative divisions (PLADs) like Guangdong, Hainan, and Guangxi. Nevertheless, the disease distribution started extending northward and westward to include PLADs such as Fujian, Zhejiang, and Yunnan in the 1990s (3–4). Yunnan encountered its first imported case in 1975 but, notably, no other cases were reported for the ensuing 25 years. Despite the sporadic importations of the disease between 2000 and 2007, a significant shift occurred in 2008 when twelve indigenous cases emerged in five border areas of Zhenkang, Mangshi, Yingjiang, Ruili, and Longchuan, indicating the first occurrence of local transmission in the PLAD. An increasing trend in local dengue outbreaks has been noticed recently, both in terms of frequency and geographical distribution since 2010 (5–6). Thus, this paper seeks to elucidate the changing epidemiological characteristics of dengue fever in Yunnan from 2010 to 2021 by examining three distinct periods of the disease’s outbreaks within the PLAD.
-
This research utilized dengue case data from the China Disease Control and Prevention Information System (CDCIS) covering the period from 2010 to 2021. This encompassed both laboratory-confirmed and clinically-diagnosed cases, based on the Diagnostic Criteria for dengue fever (WS 216-2008). The data captured detailed information including patient demographics, inception date of symptoms, diagnostic method, and for cases contracted internationally, a travel history to dengue-endemic regions within a fortnight preceding the onset of symptoms.
The data were analyzed using R statistical software (version 4.3.1, R Foundation for Statistical Computing, Auckland, New Zealand) for case information organization. Microsoft Excel 2016 (Microsoft, Redmond, USA) was utilized for demographic analysis. Joinpoint statistical software (version 5.0.2, Applications Branch, National Cancer Institute, Bethesda, USA) was used to investigate trends in dengue incidence rates and stage characteristics over the study period. The spatio-temporal spread of dengue fever was visually represented using ArcMap (version 10.7, Environmental Systems Research Institute, RedLands, USA) and SaTScan (version 10.1.3, Information Management Services, Maryland, USA). The statistical test significance level was set at 0.05.
-
From 2010 to 2021, Yunnan Province reported 14,098 cases of dengue infection. Of these, 11,513 were locally transmitted, 2,566 were imported from abroad, and 19 were introduced from other PLADs within China. Upon analyzing the infection trends throughout these years, a pattern of sporadic surges was noted. The years 2013, 2015, 2017, and 2019 saw notably high case counts — 1,538, 1,816, 2,575, and 6,471, respectively. Furthermore, from 2013 to 2019, the regions of Xishuangbanna, Dehong, and Lincang experienced dengue outbreaks in a biennial pattern.
A demographic analysis of dengue cases in Yunnan Province reveals a male-to-female case ratio of roughly 1:0.88. Case ages span from one month to 94 years old, with the majority of cases (approximately 79.83%) identified in adults aged 15–59 years. Cases in children aged 0–14 years constitute about 7.65% of the total, with seniors aged 60 years and above comprising 12.52%. Commercial service workers (2,955 cases), farmers (2,888 cases), and either unemployed individuals or domestic workers (1,569 cases) were identified as the most affected occupational groups, accounting for 20.96%, 20.49%, and 11.13% of total cases, respectively. Statistical analysis reveals significant yearly variations in the distribution of cases by gender, age, and occupation, as comprehensively detailed in Table 1.
Item 2010, n (%) 2011, n (%) 2012, n (%) 2013, n (%) 2014, n (%) 2015, n (%) 2016, n (%) 2017, n (%) 2018, n (%) 2019, n (%) 2020, n (%) 2021, n (%) Total, n (%) P Gender <0.05* Male 10
(0.13)12
(0.16)18
(0.24)731
(9.73)136
(1.81)927
(12.34)191
(2.54)1,298
(17.28)409
(5.44)3,618
(48.16)151
(2.01)11
(0.15)7,512
(53.28)Female 8
(0.12)1
(0.02)6
(0.09)807
(12.25)77
(1.17)889
(13.50)134
(2.03)1,277
(19.39)433
(6.57)2,853
(43.32)99
(1.50)2
(0.03)6,586
(46.72)Age <0.05* 0–14 0
(0.00)1
(0.09)1
(0.09)114
(10.58)17
(1.58)95
(8.81)32
(2.97)241
(22.36)73
(6.77)482
(44.71)20
(1.86)2
(0.19)1,078
(7.65)15–59 17
(0.15)12
(0.11)22
(0.20)1,257
(11.17)189
(1.68)1,529
(13.59)269
(2.39)2,122
(18.85)681
(6.05)4,937
(43.86)209
(1.86)11
(0.10)11,255
(79.83)≥60 1
(0.06)0
(0.00)1
(0.06)167
(9.46)7
(0.40)192
(10.88)24
(1.36)212
(12.01)88
(4.99)1,052
(59.60)21
(1.19)0
(0.00)1,765
(12.52)Occupation <0.05* Commercial service 3
(0.10)2
(0.07)7
(0.24)367
(12.42)89
(3.01)429
(14.52)136
(4.60)618
(20.91)197
(6.67)1,060
(35.87)44
(1.49)3
(0.10)2,955
(20.96)Farmer 1
(0.03)2
(0.07)4
(0.14)118
(4.09)29
(1.00)347
(12.02)41
(1.42)585
(20.26)134
(4.64)1,591
(55.09)34
(1.18)2
(0.07)2,888
(20.49)Domestic helper 0
(0.00)0
(0.00)1
(0.06)194
(12.36)13
(0.83)198
(12.62)30
(1.91)294
(18.74)111
(7.07)702
(44.74)25
(1.59)1
(0.06)1,569
(11.13)Retiree 1
(0.08)0
(0.00)0
(0.00)175
(13.90)2
(0.16)135
(10.72)19
(1.51)140
(11.12)96
(7.63)684
(54.33)7
(0.56)0
(0.00)1,259
(8.93)Student 2
(0.19)2
(0.19)1
(0.10)140
(13.58)17
(1.65)117
(11.35)28
(2.72)212
(20.56)65
(6.30)423
(41.03)23
(2.23)1
(0.10)1,031
(7.31)Others 11
(0.25)7
(0.16)11
(0.25)544
(12.37)63
(1.43)590
(13.42)71
(1.62)726
(16.52)239
(5.44)2,011
(45.75)117
(2.66)6
(0.14)4,396
(31.18)Total 18
(0.13)13
(0.09)24
(0.17)1,538
(10.91)213
(1.51)1,816
(12.88)325
(2.31)2,575
(18.27)842
(5.97)6,471
(45.90)250
(1.77)13
(0.09)14098 *: pass Fisher’s exact test. Table 1. Demographic distribution of dengue fever cases in Yunnan Province, 2010–2021.
-
The annual analysis of dengue case numbers across various districts of Yunnan from 2010 to 2021 has revealed a seasonal pattern, with relatively stable, and fewer cases observed during the first half of each year (2.16%). Throughout this period, imported cases were annually recorded, while there was a notable increase in indigenous cases beginning in 2013. Fundamentally, this twelve-year span can be classified into three phases: the early phase (2010–2012), characterized by sporadic and primarily imported cases; the middle phase (2013–2019), which displayed a consistent growth in imported cases alongside a dramatic surge in indigenous cases, with outbreaks occurring biennially; and the last phase (2020–2021), during which both imported and indigenous cases diminished (Figure 1).
 Figure 1.
Annual distribution of dengue fever cases in Yunnan Province, 2010–2021.
The Joinpoint Regression Program analysis discerned a notable alteration in the trend of dengue fever cases in Yunnan Province in 2019 (P<0.05). Over the period 2010 to 2019, there was a substantial surge in dengue cases, yielding an annual percentage change (APC) of 85.25% (P<0.05). Contrarily, between 2019 and 2021, a precipitous decline in cases was observed, marked by an APC of -95.12% (P<0.05) (Figure 2).
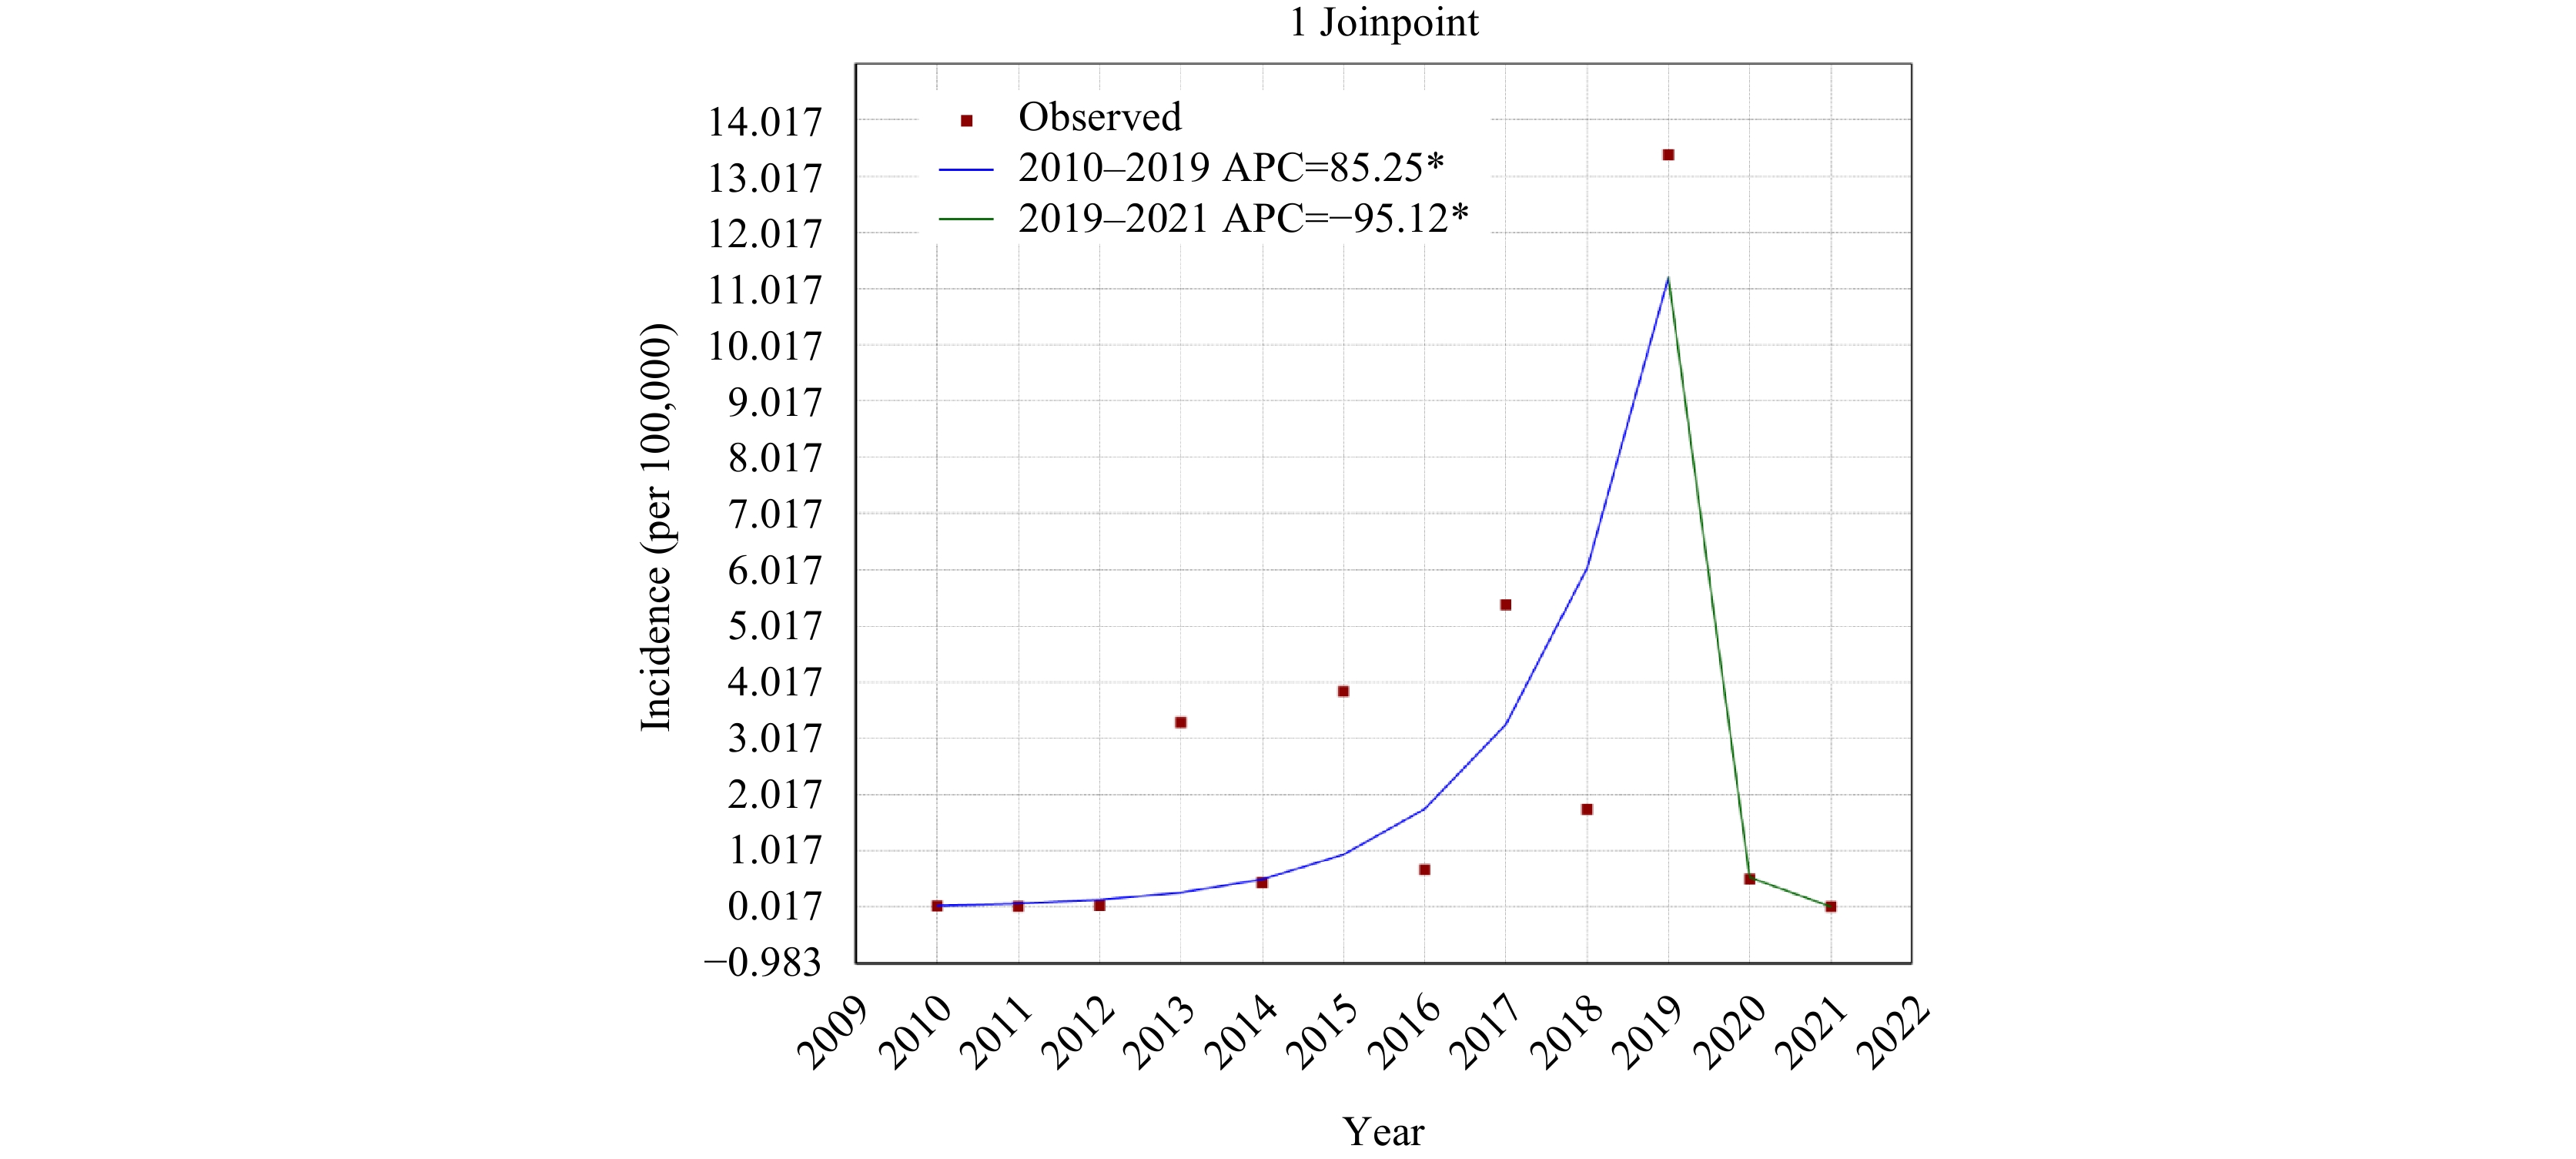 Figure 2.
Progression of total dengue fever incidence in Yunnan Province, 2010–2021.
Abbreviation: APC=Annual Percent Change.
* Indicates that the Annual Percent Change (APC) is significantly different from zero at the alpha = 0.05 level.
Note: Test statistie and P.value not available for the empirical quantile method. Final selected model: 1 Joinpoint.
The occurrence of dengue fever in Yunnan Province predominantly coincides with the summer and autumn seasons, particularly the latter months of fall. Conversely, the incidence rates during spring and winter are considerably lower, thereby contributing minimally to the annual case count. Monthly analysis indicates a progressive increase in cases starting from June and July each year, culminating in a peak from August to October, followed by a subsequent decline beginning in November. It's worth noting that the resurgence of imported cases precedes that of indigenous cases, yet the latter surge at a quicker pace and peak earlier, as depicted in Figure 3.
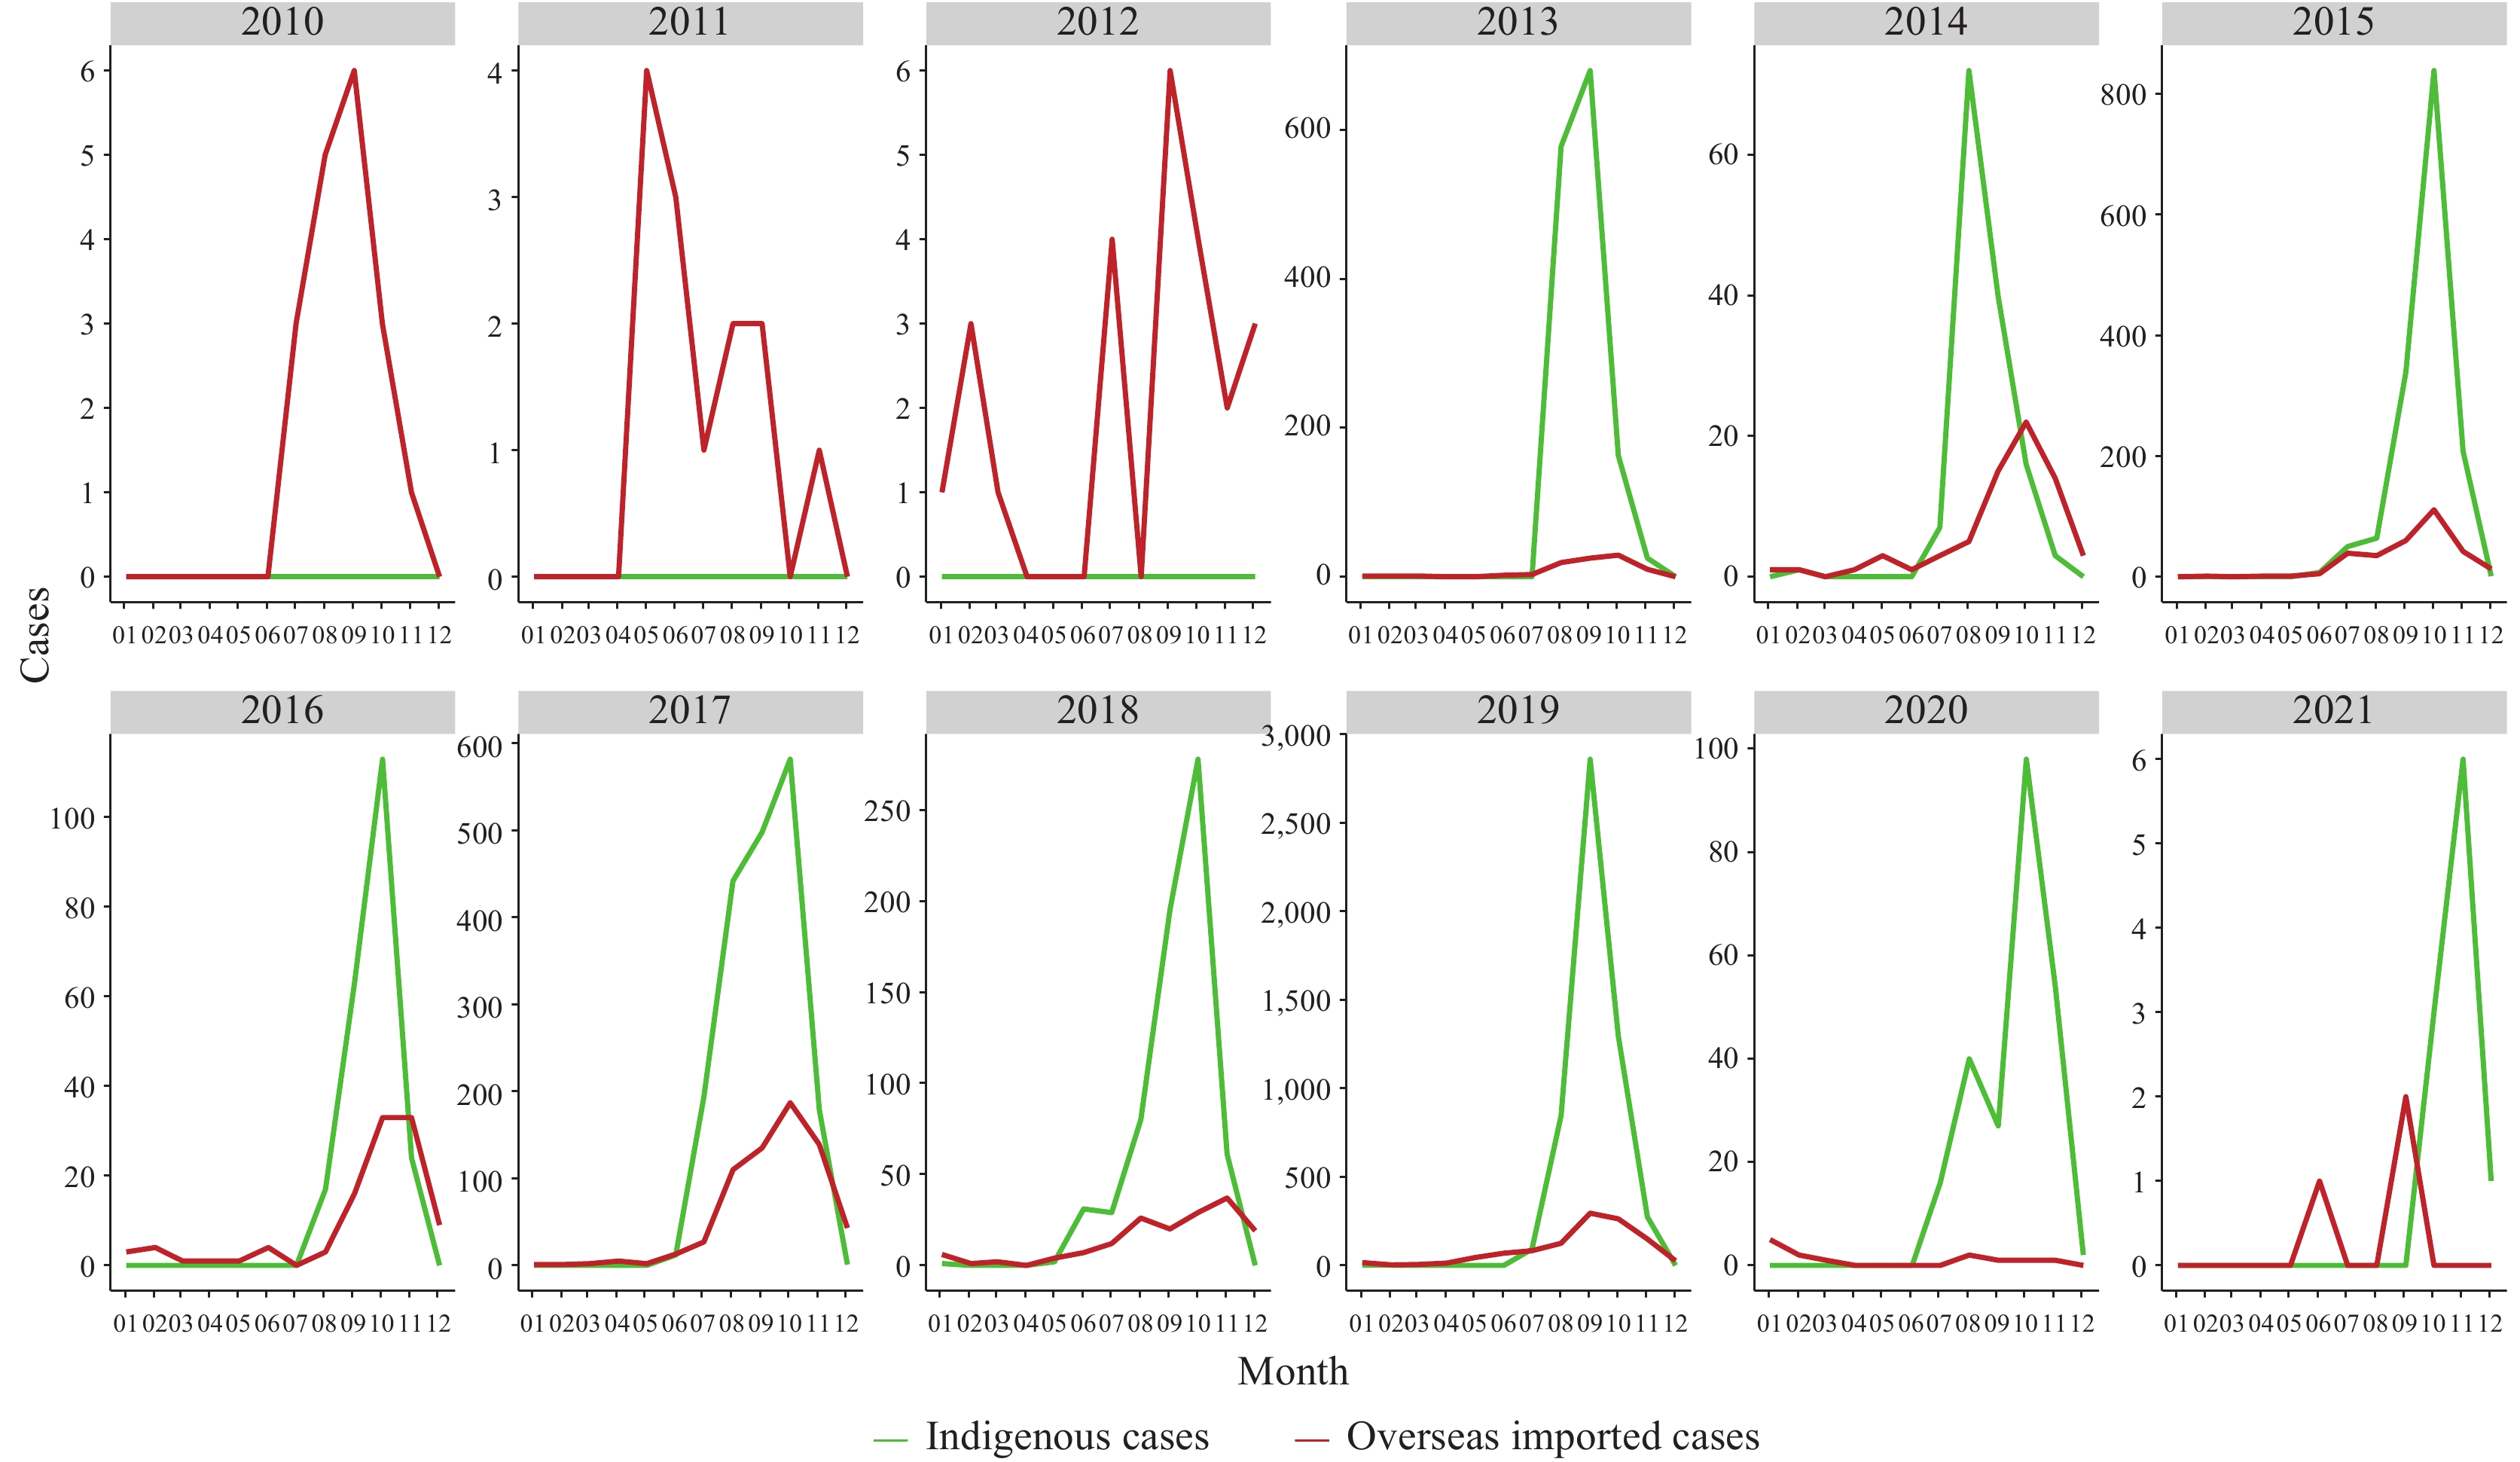 Figure 3.
Monthly trends in dengue fever cases in Yunnan Province, 2010–2021.
-
Between 2010 and 2021, a total of 14,098 cases of dengue fever were documented in Yunnan Province. Out of the sixteen cities and prefectures in the PLAD, Xishuangbanna, Dehong, and Lincang were most impacted. These locations accounted for 8,640 (61.29%), 3,567 (25.30%), and 1,149 (8.15%) cases, respectively. Considerable cases were also reported in Kunming and Honghe, which accounted for 302 (2.14%) and 136 (0.96%) cases, respectively. Dengue fever was reported annually in Kunming and every year, except in 2010, in Dehong, whilst Xishuangbanna reported cases each year except 2021. Dengue fever cases were less prevalent in Baoshan, Zhaotong, Pu’er, Qujing, Dali, Chuxiong, Yuxi, Wenshan, Lijiang, and Nujiang, as these locations all reported fewer than 100 cases. Wenshan has reported cases intermittently since 2018, Lijiang during provincial-wide outbreak peak years, and Nujiang reported a single case in 2017. However, no cases of dengue fever have been reported in Diqing. A detailed account of cases can be seen in Supplementary Table S1 (available at https://weekly.chinacdc.cn/).
Between 2010 and 2021, dengue fever was identified in 98 out of 129 districts and counties in Yunnan Province. Of these, 11,513 were indigenous cases spread across 10 districts and counties. Additionally, the PLAD reported 2,566 cases of dengue fever imported from other countries, impacting 96 counties and cities across 15 prefectures. The imported cases primarily originated from Southeast Asian and African countries.
The districts with a significantly high number of indigenous cases were Jinghong (7,571 cases), Ruili (2,620 cases), and Mengla (650 cases), which are all border counties. In terms of imported cases, the top three districts were Ruili (641 cases), Zhenkang (312 cases), and Gengma (299 cases) as outlined in
Supplementary Table S2 .Most of the imported cases were from Southeast Asian countries, accounting for 96.96% of all imported cases. Myanmar reported the highest number of cases (1,937 cases), followed by Cambodia (267 cases), Laos (199 cases), Thailand (62 cases), and Vietnam (23 cases). Both Myanmar and Laos have been regular sources of imported cases since 2010, while Cambodia started reporting cases from 2016 onward.
It is noteworthy to mention that Myanmar reported an increase in the number of cases in 2015, 2017, and 2019. Also, 2019 witnessed an increase in reported cases from Laos and Cambodia as detailed in
Supplementary Table S3 .Furthermore, Yunnan Province recorded 19 cases of dengue fever imported from other PLADs within China, predominantly Guangdong. The majority of these cases were reported in Jinghong, Guandu, and Ruili, with particular spikes in the years 2014 and 2019.
-
Global spatial autocorrelation analysis: The analysis of global spatial autocorrelation for dengue incidence in Yunnan PLAD suggested significant spatial clustering in specific years. Moran’s I values were 0.427 for both 2010 and 2012, followed by 0.05, 0.016, 0.172, 0.107, and 0.128 for 2013, 2016, 2017, 2018, and 2019 correspondingly. These values, with statistical significance (P < 0.05), indicated considerable spatial clustering of dengue cases. Nevertheless, Moran’s I value for 2014 was -0.002 (P < 0.05), implying a random distribution of cases for that year. During other years, represented by Moran’s I values of 0.233, 0.008, and -0.003, the differences were not statistically significant (P > 0.05), suggesting no noteworthy spatial clustering. Further details can be found in
Supplementary Table S4 .Local spatial autocorrelation analysis: From 2010 to 2021, each year saw the identification of 1 to 5 dengue fever hotspots within the counties of Yunnan PLAD. In the span of 2010 to 2012, these hotspots, largely comprising imported cases, were primarily found in locations such as Jinghong, Ruili, and Kunming. However, between 2013 and 2021, the principal concentration of dengue fever cases transitioned to predominantly include Jinghong and Ruili, with the spread of the disease radiating outward from these two central hotspots. These findings are detailed in
Supplementary Table S5 .Spatio-temporal scan analysis: The spatiotemporal cluster analysis of dengue fever in Yunnan uncovered distinctive temporal and spatial patterns. This analysis pinpointed a primary cluster and two secondary clusters via spatial and temporal scan techniques (
Supplementary Table S6 ). The principle cluster was located in the southern quadrant of the PLAD. Its highest-risk phase spanned from 2015 to 2019, marked by a relative risk (RR) of 150.46, a log likelihood ratio (LLR) of 25770.59, and a highly significant P-value (P < 0.001). This high-risk cluster, which covered a circular area with a radius of 69.29 km and included the counties of Jinghong and Mengla, reported a total of 7,085 dengue fever cases. -
Dengue fever in Yunnan Province is primarily influenced by imported cases, predominantly from Myanmar and Laos, which often result in local outbreaks. This assertion is bolstered by various studies that underscore imported cases as the principal cause of local epidemics, aligning with the results of our research (7–9). It is advisable for authorities to diligently observe dengue fever trends in Southeast Asian countries, specifically Myanmar and Laos, during the year’s first half. It is imperative to intensify screening procedures at Yunnan’s borders, particularly at points of entry.
The border regions of Yunnan have been identified as significant hotspots for transmission, primarily attributed to the Aedes aegypti mosquito. Over the last decade, the number of affected districts and counties has surged from nine in 2010 to 98 in 2021. This substantial increase may be associated with the widespread presence of the Aedes aegypti mosquito and the mobility of infected individuals (11–12). The high density of mosquito populations along the borders, coupled with diverse vector species, coincides with the seasonal spikes of dengue in the PLAD (13–14). It is recommended to continue surveillance of the Aedes aegypti mosquito populations, ensure efficient mosquito control, and uphold cleanliness in border areas. Continuous, year-round monitoring is crucial in key regions such as Ruili, Jinghong, and Gengma. Additionally, public health initiatives should drive sanitation practices to prevent the creation of mosquito breeding sites.
There was a discernible alteration in the patterns of dengue occurrence in Yunnan after 2019. This change may be attributed to various factors including the implementation of COVID-19 control measures, enhanced cooperative preventive initiatives, more stringent entry and isolation policies for foreign arrivals, amplified screening and regulation of movement, the endorsement of remote work, the practice of social distancing, and a decline in public mobility. Collectively, these factors led to a substantial decrease in reported dengue cases.
In conclusion, Yunnan Province has seen sporadic outbreaks of dengue fever, generally on a biennial cycle. Vigilance remains essential regarding the potential increase in prevalence of dengue fever in border counties. Implementing effective dengue surveillance and quarantine measures for travelers originating from regions endemic with to disease is of utmost importance, particularly during large outbreaks or seasons of elevated dengue risk.
Dengue fever in Yunnan Province demonstrates biennial outbreaks, which emphasizes the importance of increased surveillance of the disease in counties located near the border.
HTML
Epidemic Overview
Temporal Distribution
Spatial Distribution
Spatio-Temporal Aggregation
| Citation: |

|