
 Download:


-
Seasonal influenza is a common respiratory illness caused by influenza A and B viruses. Annually, it is responsible for approximately 1 billion infections worldwide, leading to 3–5 million cases of severe illness and an estimated 290,000 to 650,000 deaths due to respiratory complications (1). The emergence of coronavirus disease 2019 (COVID-19) dramatically altered the global public health landscape, affecting priorities and behaviors, which profoundly influenced influenza transmission. The World Health Organization (WHO) reported no influenza epidemic peak during the 2021–2022 winter season. However, from September 2022 to January 2023, influenza activity rebounded to pre-pandemic levels in various regions. In the Northern Hemisphere’s temperate zones, influenza cases began to rise in October 2022, peaked in December, and then declined between January and mid-February 2023, with A(H3N2) being the most prevalent strain. From February to August 2023, detection rates across all reported regions were consistent with those from the corresponding months in 2022, showing regional and national variations in the predominant circulating virus strains (2).
The diverse climatic and geographical conditions in China result in two primary epidemic patterns based on latitude. Northern provincial-level administrative divisions (PLADs) (>33 °N) typically experience a single, intense, and concentrated influenza outbreak during the winter-spring season. Conversely, the southern region observes a significant peak in winter-spring and a potential summer wave, mainly driven by A(H3N2) (3). Understanding the annual timing, duration, and characteristics of influenza activity is essential for guiding influenza vaccination strategies.
-
In China, the Chinese National Influenza Surveillance Network (CNISN) conducts influenza surveillance from both epidemiological and virological perspectives. This network includes 554 national-level sentinel hospitals and 410 network laboratories (4). The network also covers all prefecture-level cities and some county-level cities. Most of the network laboratories are situated within provincial or city-level CDCs. The Chinese National Influenza Center assesses the quality of the network annually.
Influenza-like illness (ILI) was defined as a temperature ≥38 °C accompanied by a cough or sore throat. Clinical samples from patients meeting this ILI definition were collected from sentinel hospitals. Surveillance data included the number of ILI cases and total clinic visits. Respiratory specimens were sent to network laboratories and tested using real-time reverse transcription polymerase chain reaction (rRT-PCR) for virus detection. All data were recorded in the Chinese National Surveillance Information System. Detailed procedures are outlined in the Technical Guidelines for Influenza Surveillance in China (5).
The positive rate was calculated as the ratio of influenza-positive samples to the total tested. All analytical data were restricted to sources from national-level sentinel hospitals to ensure high consistency and quality surveillance for comparison across different years. A geographic heat map was created using epidemiological parameter investigation from population observations interface (EPIPOI), an open-source software program, based on epidemiological parameters derived from population observations (6).
-
In January 2023, the influenza positivity rate was below 1.0%. It began to increase during weeks 6–7, peaking at 60.0% in the 10th week and 60.2% in the 13th week in northern and southern China, respectively. The onset and peak were about two months later than the typical winter-spring season, with a slightly higher intensity compared to pre-COVID-19 years (Figure 1A–B).
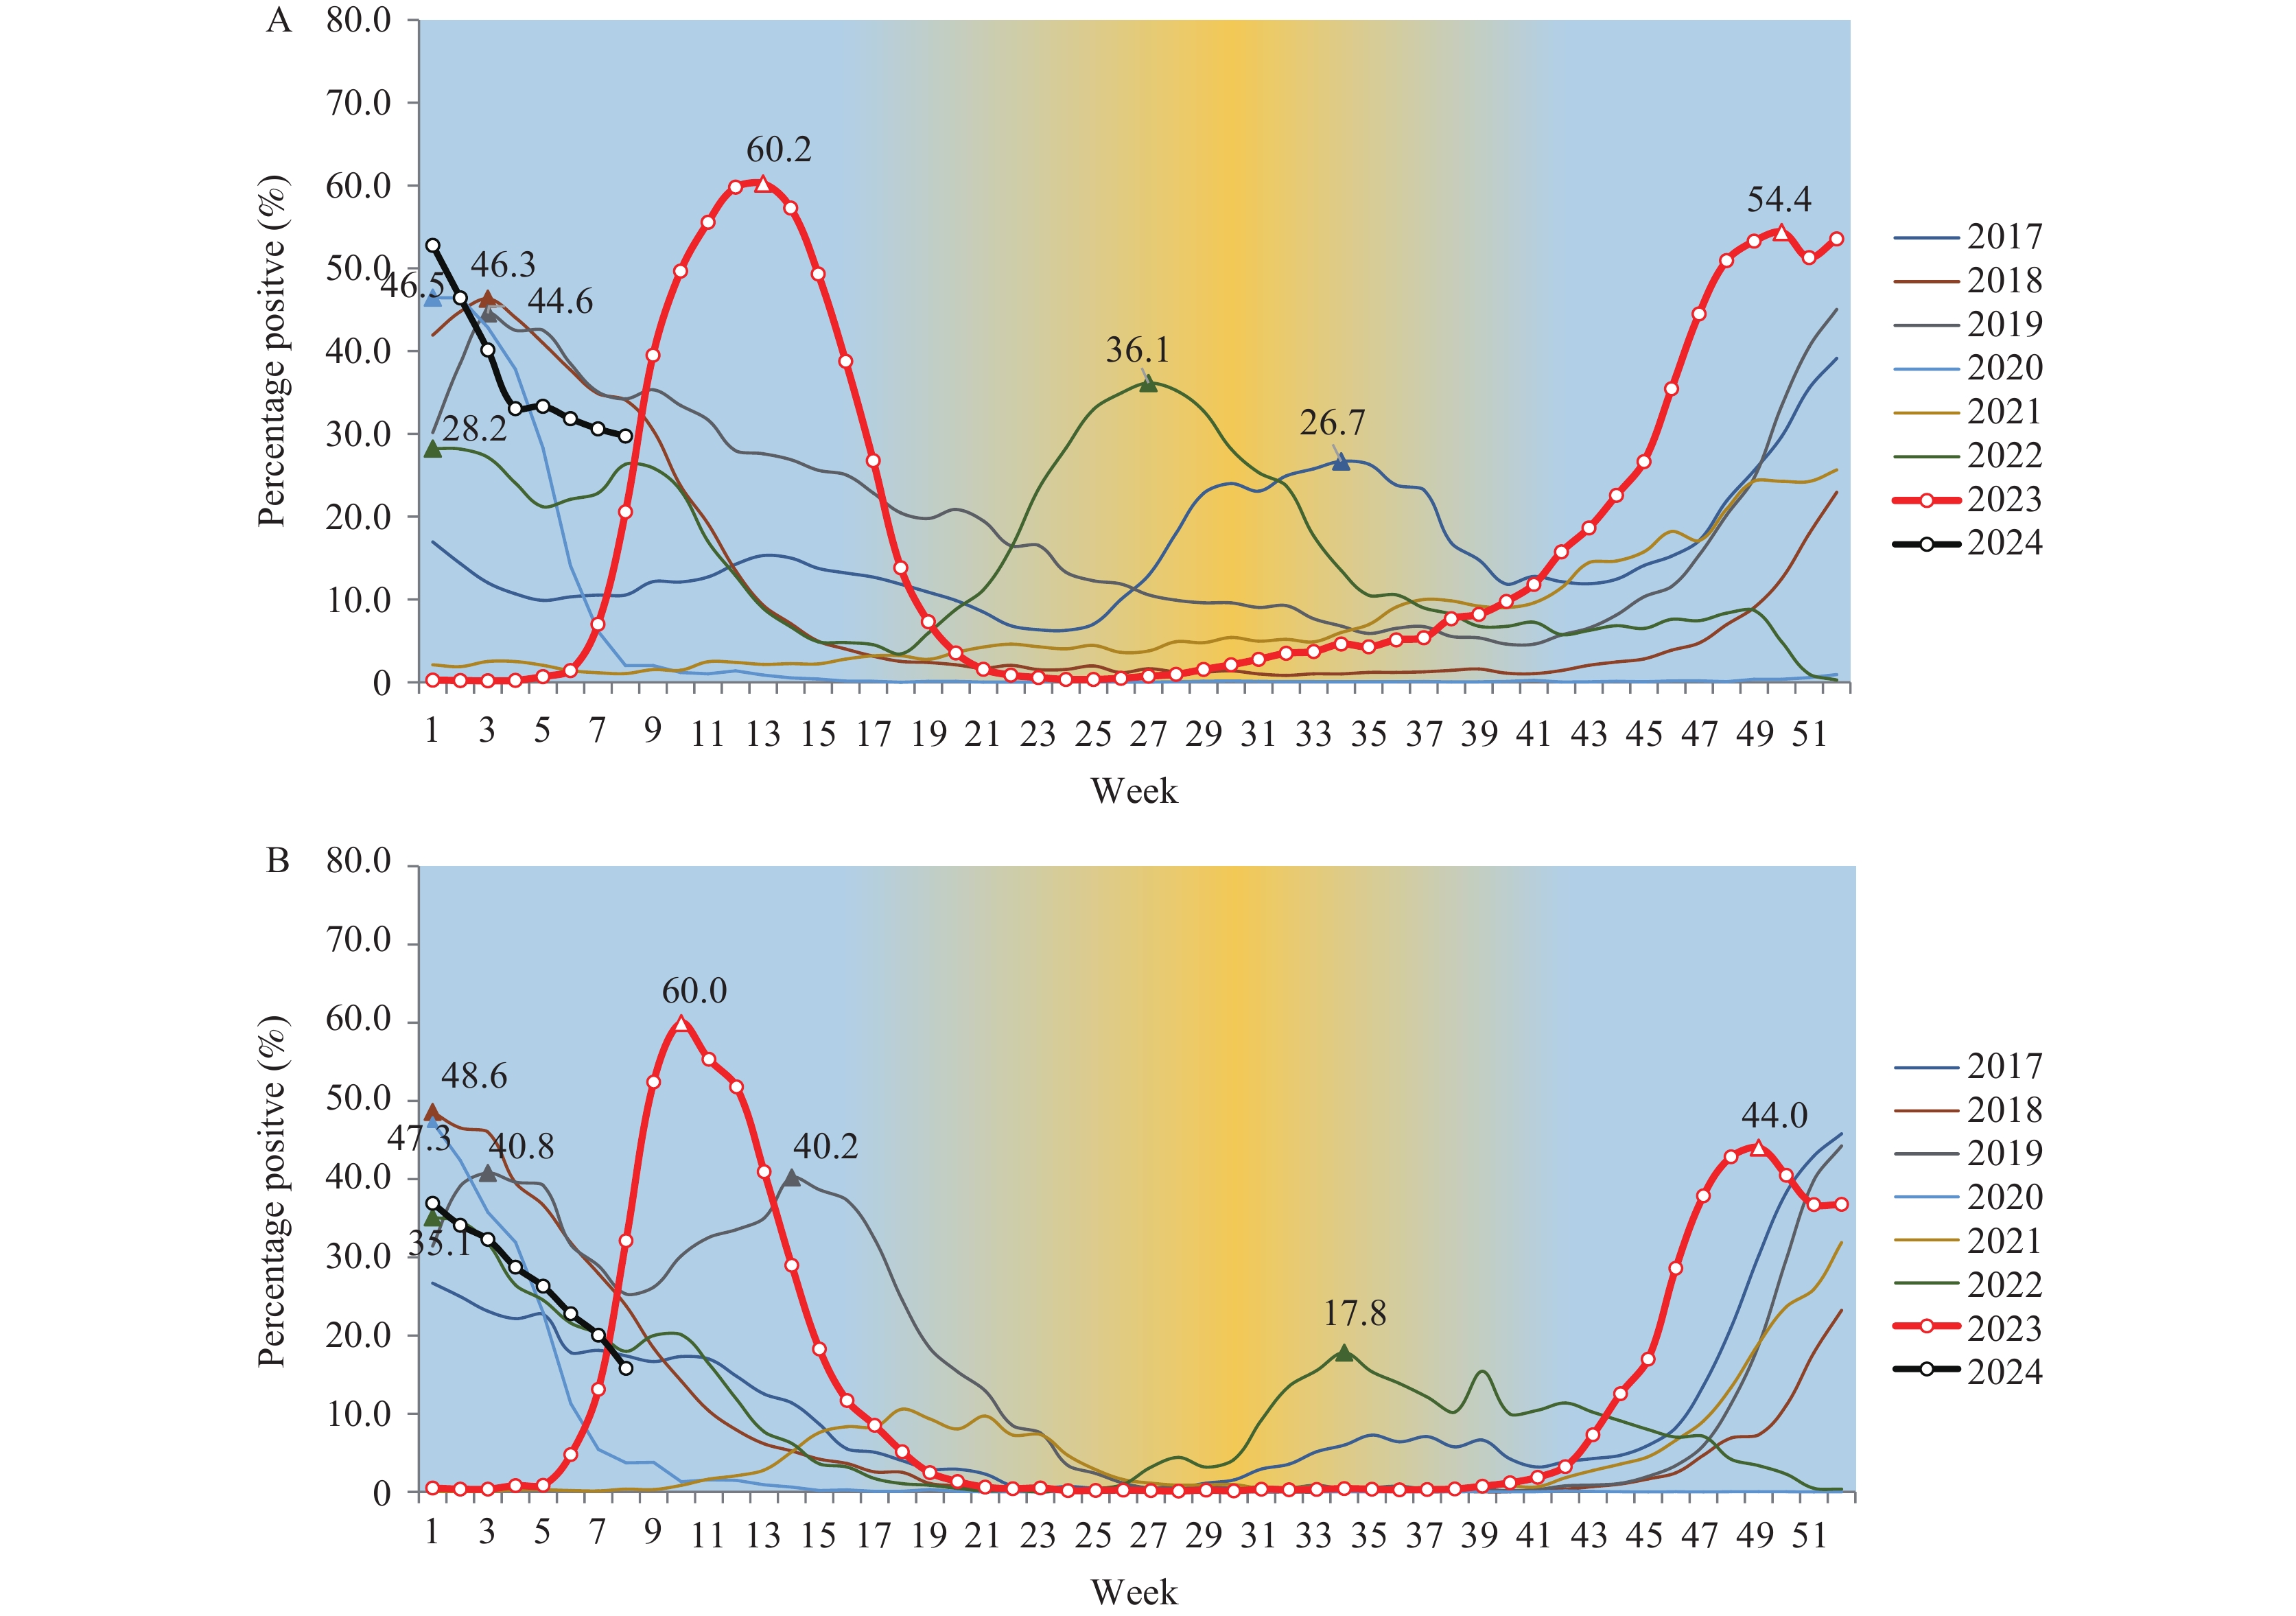 Figure 1.
Influenza-positive tests reported by network laboratories from 2017 to 2023. (A) In southern China; (B) in northern China.
Note: the peak week of each influenza season is indicated by a triangle.The influenza positivity rate remained low during the summer in the southern PLADs, rose slightly during weeks 36 to 44, and rapidly increased over the subsequent 4 weeks, reaching a peak of 54.4% in week 50. In northern China, a noticeable increase began in week 43, peaking at 44.0% by week 49. This peak of the influenza epidemic occurred 2–4 weeks earlier than the usual winter peak (Figure 1A–B).
-
In 2023, laboratories within the National Influenza Network tested 680,246 specimens for the influenza virus. Of these, 125,834 (18.5%) were confirmed positive. Influenza A was the predominant type, accounting for 91.8% of all positive samples. Among the influenza A viruses, 45,802 cases (39.7%) were identified as A(H1N1)pdm09, with 29,144 cases reported from southern PLADs and 16,658 from northern PLADs. Nearly all A(H1N1)pdm09 cases were detected during weeks 1–20 prior to May. Additionally, there were 69,305 cases (60.0%) of A(H3N2), with 40,158 from southern and 29,147 from northern PLADs, primarily identified since week 40. For type B influenza viruses, none belonged to the B/Yamagata lineage, and all 10,348 were classified as B/Victoria lineage (Figure 2).
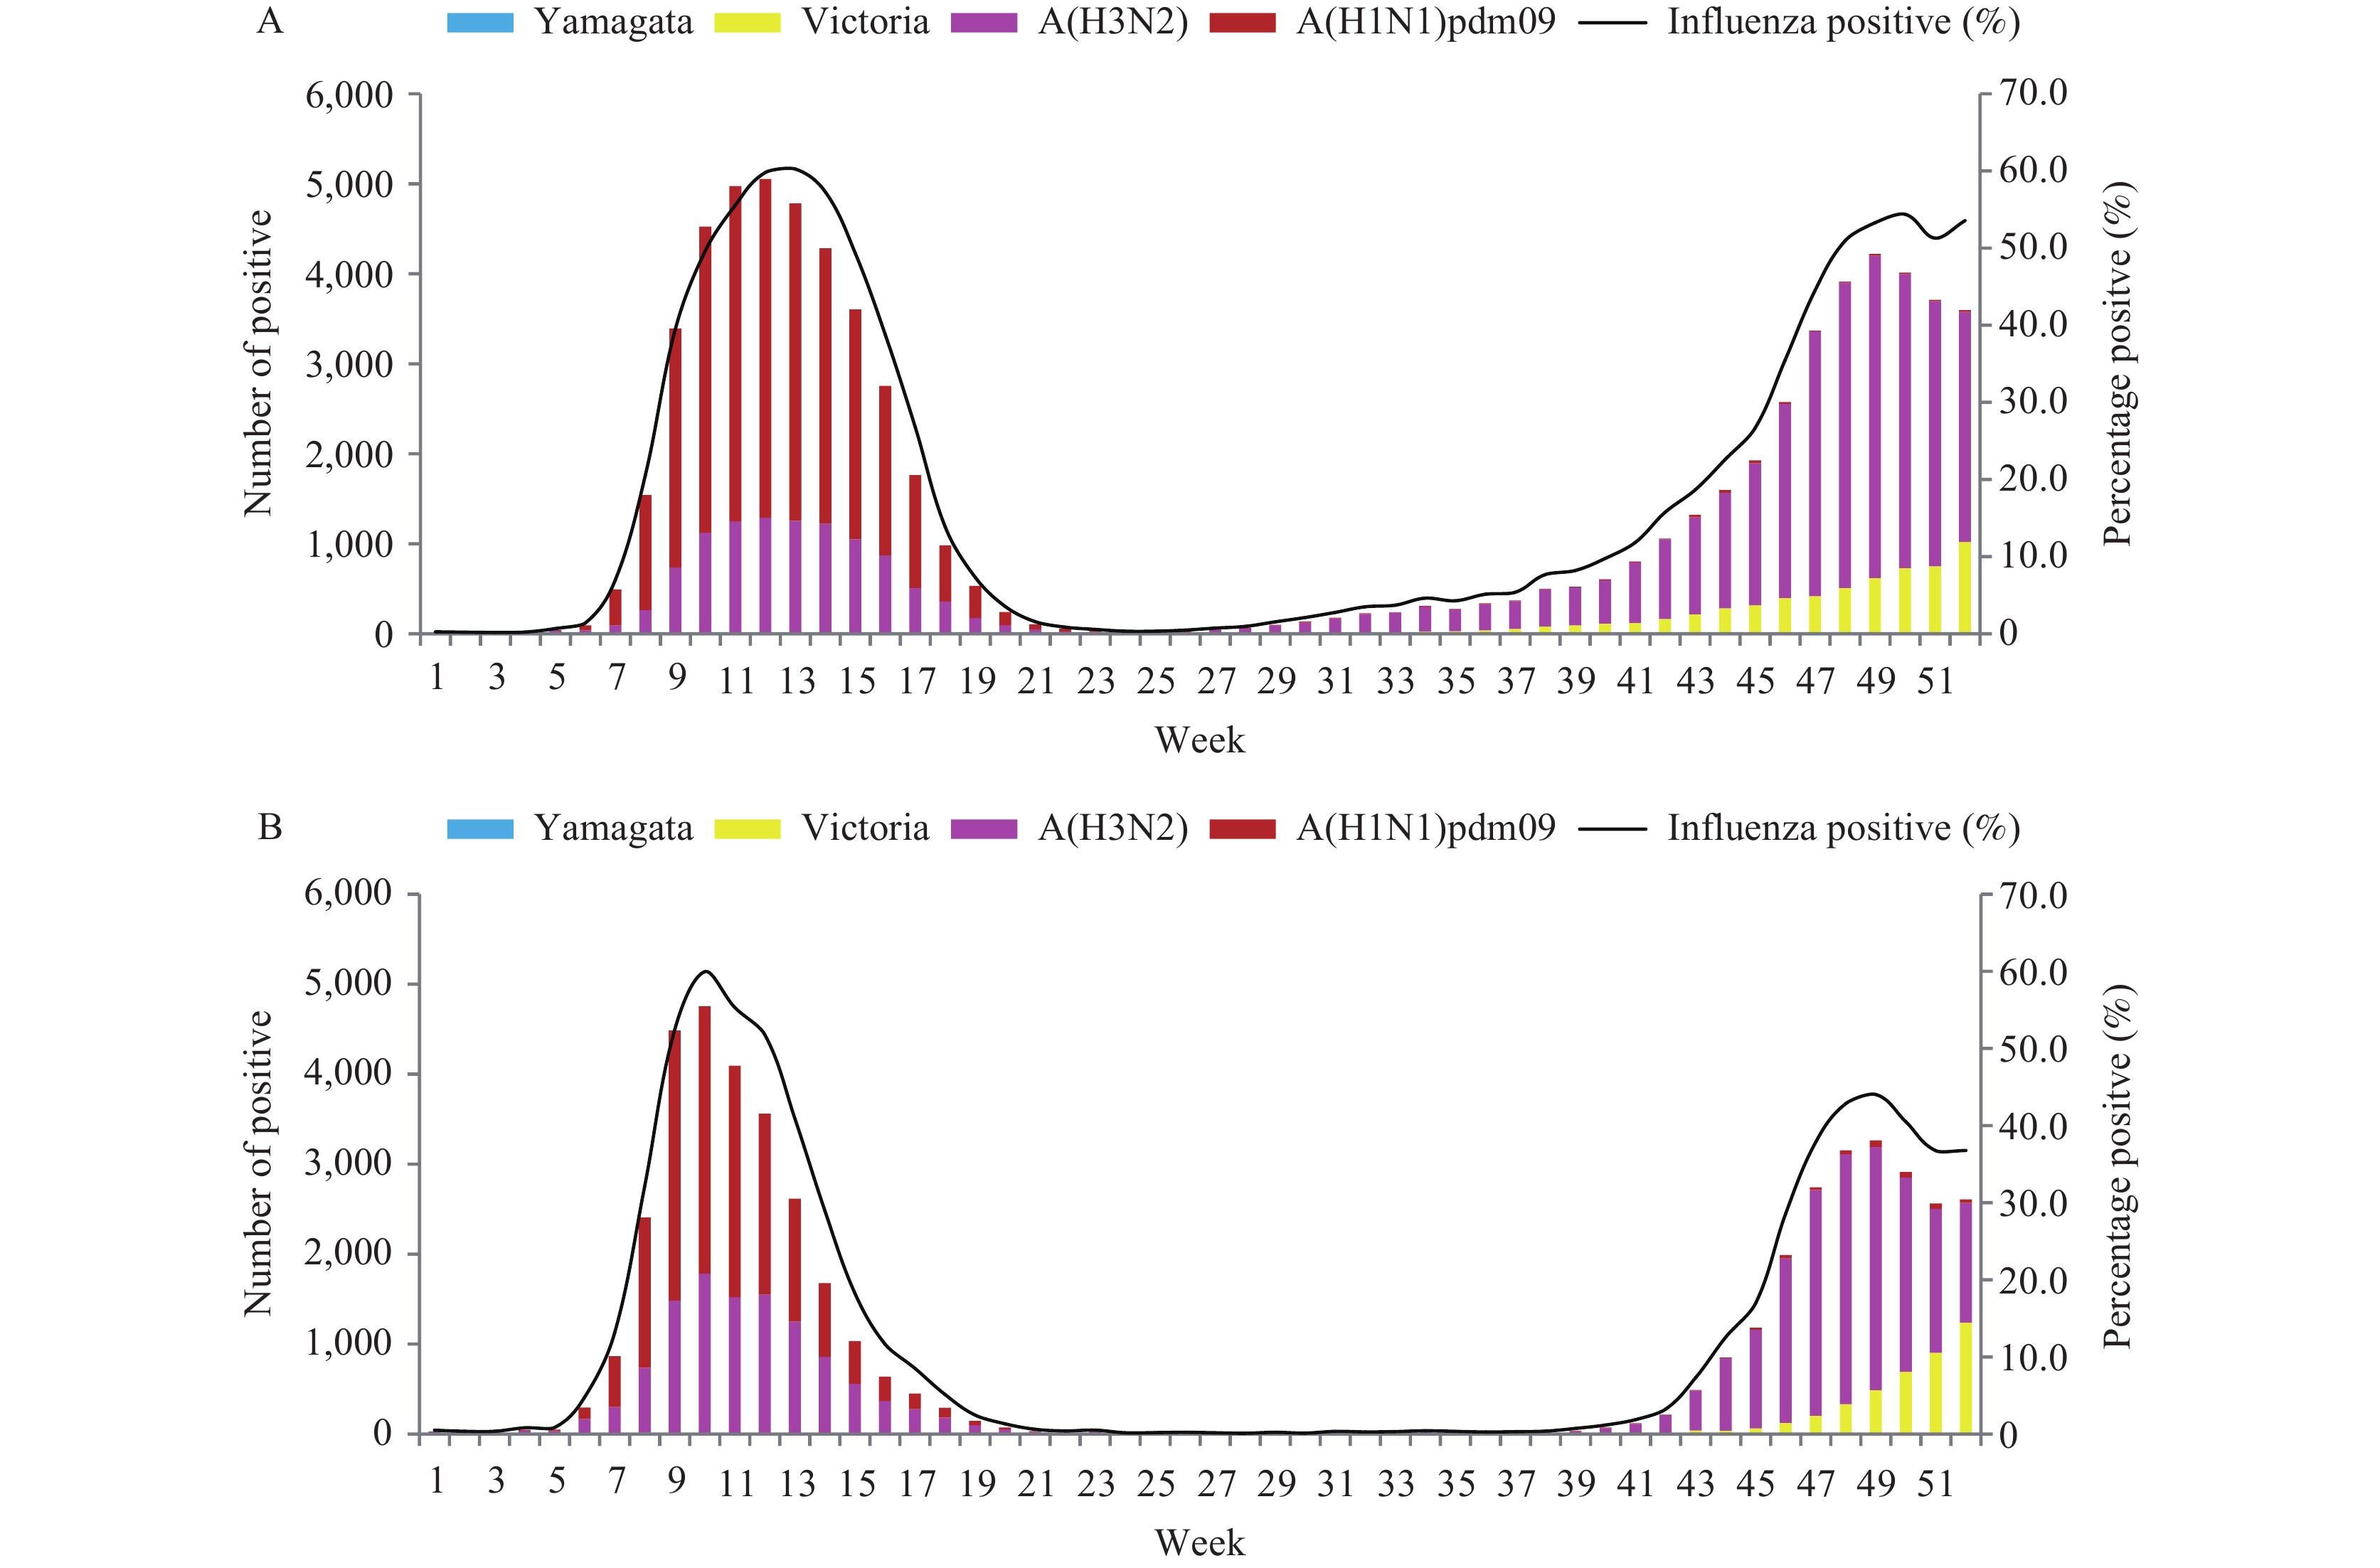 Figure 2.
Composition of influenza subtypes/lineages in positive ILI specimens reported by network laboratories in 2023. (A) In southern China; (B) in northern China.
Abbreviation: ILI=influenza-like illness. -
The first influenza epidemic of 2023 in China began in February, spreading from the north to the south. Heat map analysis indicated a shorter epidemic duration in the northern regions compared to the southern areas. Sporadic detection of A(H1N1)pdm09 specimens initially occurred in Beijing and Tianjin in week 3, followed by northern and mid-eastern PLADs in the subsequent week. The number of PLADs reporting cases then increased rapidly, with peak detection of A(H1N1)pdm09 in weeks 9–10 in most northern, eastern, and central PLADs. In contrast, the peak in southwestern and southern PLADs was delayed to weeks 11–13 and 14–15, respectively (Figure 3B). During this period, the A(H3N2) virus was consistently detected at lower levels compared to A(H1N1)pdm09 across all PLADs, while the B/Victoria virus was infrequently detected.
 Figure 3.
Heatmaps illustrating the weekly influenza virus detections in different PLADs across China in 2023, arranged by the latitude of the provincial capital cities. (A) All types/subtypes/lineages, (B) A(H1N1)pdm09, (C) A(H3N2), and (D) B/Victoria lineage virus.
Note: The color bar indicates the intensity of influenza detections, with each PLAD’s data standardized year-round and shown as a proportion of that PLAD’s maximum number of positive detections in a single week, ranging from high (red) to low (blue).
Abbreviation: PLAD=provincial-level administrative division.
During the second influenza epidemic starting in October, the A(H3N2) virus predominated until mid-December, after which the B/Victoria lineage virus became more prevalent. By the first and second weeks of January 2024, the proportion of B/Victoria lineage virus surpassed that of A(H3N2) in the northern and southern PLADs, respectively. The A(H3N2) virus was initially detected at low to moderate levels during the summer in Shanghai Municipality and spread to neighboring PLADs in East China by September. Following the 45th week, there was a significant increase in A(H3N2) detections nationwide (Figure 3A–D).
-
Historically, the winter-spring influenza epidemic season in China typically begins in December, peaks in January, declines, and continues until March (4). Occasionally, a summer epidemic season occurs in the south, primarily driven by subtype A(H3N2) (7). By the end of 2022, influenza virus activity in China was halted due to the COVID-19 pandemic (8). However, in 2023, the activity and diversity of circulating influenza types and subtypes had notably increased.
The initial influenza epidemic in March 2023, primarily caused by the A(H1N1)pdm09 subtype (9), spread from north to south and was delayed approximately two months compared to the typical winter-spring epidemic pattern. This outbreak exceeded all previous peaks. The previous significant epidemic of the A(H1N1)pdm09 virus occurred during the winter season of 2018–2019. The 4-year gap in circulation led to reduced population immunity against A(H1N1)pdm09. Combined with persistently low influenza vaccination rates in China (10), increased population mobility, and school crowding due to the relaxation of severe acute respiratory syndrome coronavirus 2 (SARS-CoV-2) prevention and control measures since the end of 2022, the high prevalence of A(H1N1)pdm09 in early 2023 is understandable.
No significant summer epidemic was observed in 2023 in the southern PLADs. The interactions among SARS-CoV-2, influenza virus, and other respiratory viruses might have interfered with each other (11). The moderate level of COVID-19 may have contributed to the absence of a summertime influenza epidemic. Nonetheless, continuous A(H3N2) detections in several provinces played crucial roles in seeding infections (7), accelerating the transmission of the A(H3N2) influenza virus, which increased gradually following school openings and the congregation of students from September onwards. Additionally, as the season transitions into autumn and winter, lower temperatures could further enhance the survivability of the influenza virus in droplets and the stability of virus particles (12). These factors have collectively contributed to the early onset of a second epidemic driven by the alternate subtype A(H3N2) instead of A(H1N1)pdm09.
In December 2023, the predominant viruses during the second peak were A(H3N2), followed by the B/Victoria lineage virus. Although the prevalence of A(H3N2) and B/Victoria viruses differed across PLADs (Figure 3), it is evident that the second wave of the epidemic lasted longer than the first.
In 2023, two distinct winter-spring influenza epidemics were recorded within the same year for the first time. The circulation patterns, timing, and intensity of seasonal influenza have shifted post-COVID-19, differing significantly from historical seasonality trends. Similar trends have been observed in other countries and regions. For example, in the United States, influenza activity began to increase nationwide in early October 2022, peaking in early December (week 49) of 2022 (13), followed by another surge in November 2023, which peaked in week 52. Both seasons started sooner than the traditional pre-COVID-19 period (14). Nonetheless, there is a discernible trend toward the reestablishment of typical seasonal influenza patterns globally despite the ongoing presence of SARS-CoV-2. It is imperative to continuously enhance influenza surveillance and strengthen the capabilities of the surveillance network. The Global Influenza Surveillance and Response System supports global influenza monitoring and promotes the advancement of integrated multi-pathogen surveillance.
The study is subject to some limitations. First, we used the coordinates of provincial capitals to determine transmission directions, which may affect accuracy. Second, we lack population immunity data to fully explain the epidemic pattern.
HTML
The Epidemic Trend of Influenza
Type and Subtype Compositions of Circulating Influenza Viruses in 2023
Geographic Distribution of Influenza Virus
| Citation: |

|