
 Download:


-
Recent research shows that mucosal IgA effectively hinders the spread of the Omicron variant of severe acute respiratory syndrome coronavirus 2 (SARS-CoV-2), highlighting its importance in respiratory virus immunity. British scientists found that nasal mucosal IgA antibodies could maintain more than 6 months (1). The probability of reinfection can be evaluated via the detection of spike-specific IgA antibodies (2-3). In winter 2022, a pandemic of COVID-19 with Omicron variants infection occurred nationwide. To better comprehend the dynamic shifts in IgA antibody levels in the current population, we investigated and analyzed 3,421 individuals who had recovered from coronavirus disease 2019 (COVID-19) in Hubei province using self-test colloidal gold-based SARS-CoV-2-specific IgA antibody rapid test kits and an online survey on “Questionnaire Star” and statistically analyzed the collected data ranging from September 2022 to August 2023.
The criteria for survey enrollment were those who recovered from COVID-19 and received at least one vaccination with age range from 5 years to 95 years old. We quantified nasal IgA levels using a colloidal gold-based SARS-CoV-2-specific IgA antibody rapid test kit. The interpretation of results employed a colloidal gold standard card: a score of 0 represented a negative result (NEG) or an antibody level below the detectable threshold; scores of 1–2 indicated a weak positive (WP) detection, whereas scores between 3 and 10 were indicative of a significant positive (SP) response. Meantime, all participants completed an online “Questionnaire Star” survey which captured demographics, COVID-19 history, disease severity, vaccination status, and IgA test outcomes. We classified disease severity in line with WHO criteria as mild, severe, or asymptomatic (4), excluding participants with critical conditions such as sepsis. Our study paid special attention to inclusivity and represented a balanced mix of professional roles and gender demographics within the cohort. For statistical analysis, we used IBM SPSS Statistics (version 29.0; IBM Deutschland GmbH, Armonk, NY, USA). We applied the Kruskal-Wallis One-Way ANOVA to investigate correlations between the incidence of SARS-CoV-2 infections, illness severity, vaccination frequency, and IgA antibody levels. Data visualization was undertaken using GraphPad Prism (version 10.1.2; La Jolla, CA, USA), RAWGraphs (version 2.0; Density Design, Calibro, and Inmagik, Milan, Italy), and Excel (version 2021; Microsoft, Redmond, USA), considering a P-value below 0.05 as statistically significant. The Chinese Center for Disease Control and Prevention Institutional Review Board granted ethical approval for this study (Approval Number: 202302), with all participants providing informed consent before enrollment. No compensation was offered to participants.
3,421 valid questionnaires were collected from individuals aged 5 to 95, with a median age of 49. Of them, 63.8% of participants were female, and 36.2% were male (
Supplementary Figure S1A–B ). Of those, 90% of participants had one infection while 10% had two (Inner ring), 3% were asymptomatic, 53% had mild symptoms, and 44% had severe symptoms (Middle ring), and the outer ring represents vaccination status: 1% had received one dose, 12% were administered two doses, and a predominant 87% received three doses (Supplementary Figure S1C ). The participants were further stratified into four distinct cohorts based on their infection history: Group A comprised a significant majority of 77.84% of participants who reported only a single infection occurring between September 2022 and August 2023. Group B consisted of 8.65% of the cohort who endured two simultaneous infections. Group C, which made up only 0.96% of the total population, included individuals who had an infection both before and after September 2022. Lastly, group D held 12.63% of the subjects who reported a single infection event that occurred before September 2022 (Supplementary Figure S1D ).IgA levels were assessed based on the above investigation. Of these, 574 (16.78%) returned NEG for nasal IgA antibodies (score 0), 827 (24.17%) were WP (score 1–2), and 2,020 (59.05%) were SP (score 3–10) (Figure 1A). Subsequently, we evaluated the associations between vaccination status (Figure 1B), severity of illness (Figure 1C), and the grouped IgA antibody levels. The results (Figure 1B left) revealed that 87% (2,979/3,421) of all grouped surveyed individuals (left line) received three doses of the vaccine (Green part in middle line), over 95% (2,847/2,979) respondents turned to mucosal IgA positive, and 67% (2,020/2,979) tended to a significant positive IgA response (SP) (Right line), individuals with multiple vaccinations exhibited increased average IgA levels (Figure 1B right). Furthermore, within this vaccinated cohort (Figure 1C left), nearly equal proportions of mild and severe disease cases were identified, with each category representing about half (Middle line, mild cases in light purple and severe cases in dark purple). Notably, among those with severe symptoms, 87% (1,317/1,521) turned to IgA positive, and 65% (988/1,521) showed strong IgA responses (SP), significantly higher than those with mild symptoms and asymptomatic (Figure 1C right).
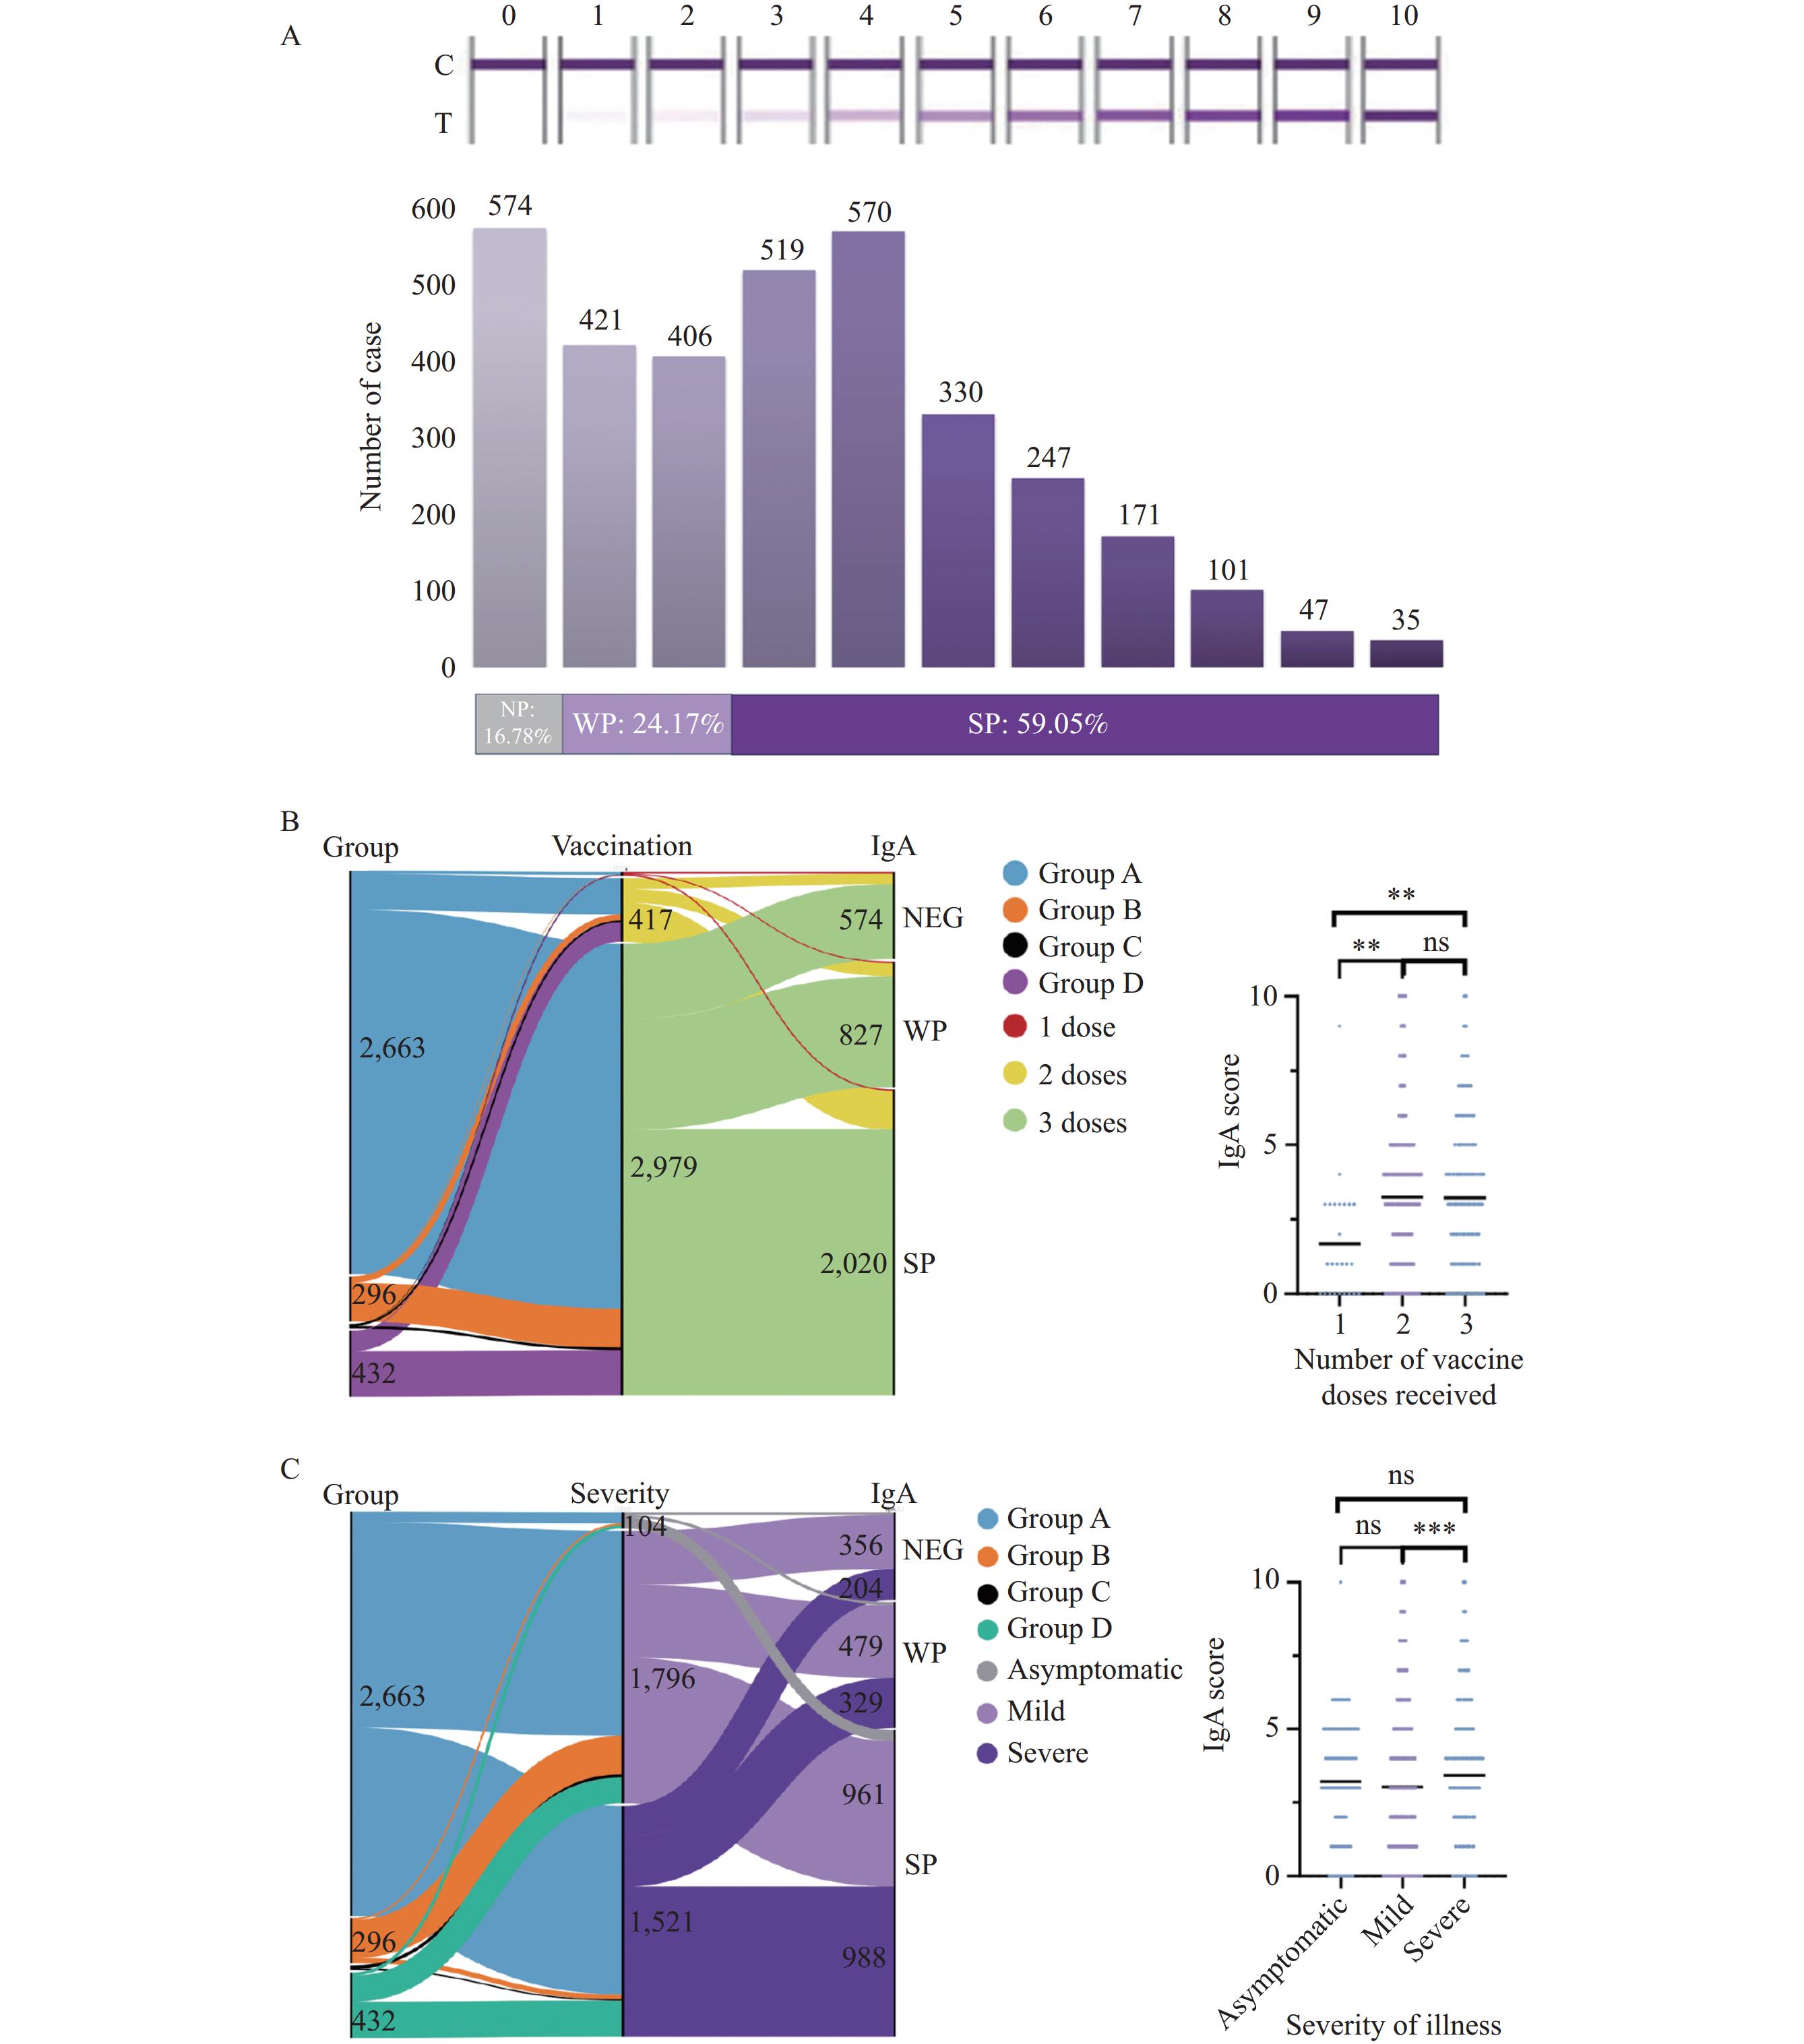 Figure 1.
Analysis of IgA levels and their relationship with group, vaccination, and symptoms. (A) The comprehensive results of the IgA tests conducted on the study population. (B) Sankey diagram of Population Grouping (left), Vaccination Status (center), and IgA Level (right), and the comparison of average IgA scores differentiated by the number of vaccine doses received. (C) Sankey diagram of Population Grouping (left), Severity of illness (center), and IgA Level (right), and the comparison of average IgA scores differentiated by the illness severity.
Note: In diagram (B), blue represents Group A, orange for Group B, black for Group C, and purple for Group D. Pertaining to vaccination status, light orange indicates individuals who received a single vaccine dose, yellow represents the recipients of two doses, and green denotes those who received three doses. In diagram (C), blue represents Group A, orange for Group B, black for Group C, dark green for Group D, grey denotes the asymptomatic group, light purple for the group with mild symptoms, and dark purple for the group with severe symptoms.
** P<0.01;
*** P<0.001.
Abbreviation: NEG=negative; WP=weak positive; SP=significant positive.
Next, we analyzed the temporal distribution of IgA levels after SARS-CoV-2 infections in 2,989 surveyed participants, whose most recent infection occurred between September 2022 and August 2023. Our findings indicate a surge in infections around December 2022, followed by a consistent infection rate through early 2023, with the highest frequency occurred in December 2022 (Figure 2A). The total detected IgA positive ratio was 83% (58% for SP and 25% for WP) during the investigated period and averaged at 80%. The IgA positive rate had nearly no differences in each month of except the month July 2023 (Figure 2B). Of these, Group A exhibited its final infection peak in December 2022, presenting IgA-positive ratio of 83% (58% for SP and 25% for WP). Group B, which documented two infection incidences post-September 2022, recorded its final cases in the first half of 2023, with IgA positive rate at 71% (SP 51% and WP 20%); while Group C, with reported infection cases in both years 2022 and 2023, demonstrated IgA positive rate over 90% but these group with limited respondents in our collected data (Figure 2C).
 Figure 2.
Temporal dynamics of IgA levels post-SARS-CoV-2 infection. (A) The distribution of the final infection dates between September 2022 and August 2023 for 2,989 cases, with each vertical line representing a single case. (B) The categorization of the 2,989 cases according to IgA levels. (C) The data visualizations for Groups A, B, and C populations.
Note: In (A), the diameter of the circles beneath represents the case frequency each month. In (B and C), the pie charts illustrate the monthly distribution of IgA levels, color-coded as follows: grey for negative, yellow for weak positive, and green for strong positive.
Abbreviation: NEG=negative; WP=weak positive; SP=significant positive.
The surveyed study population demonstrated a trend of sustained immune response following the post-infection period. More specifically, over half of the overall population continued to exhibit specific IgA antibodies from day 200 up to day 300 post-infection (Figure 3 left). A similar trend was noted in Group A, with more than half of its participants maintaining the same IgA positive within the same timescale, while in Group B, for those with repeated infection, the timeframe of mucosal IgA maintainance appeared wider, ranging from day 80 to 200. Notably, 94% (288/308) of individuals in Group D who were beyond the infection time of the investigation, reaching the time interval between day 551 and 700 post-infection, were IgA-positive. Even though 70% of respondents reached the SP IgA response level (Figure 3 right), it indicated that they might have experienced asymptomatic reinfections.
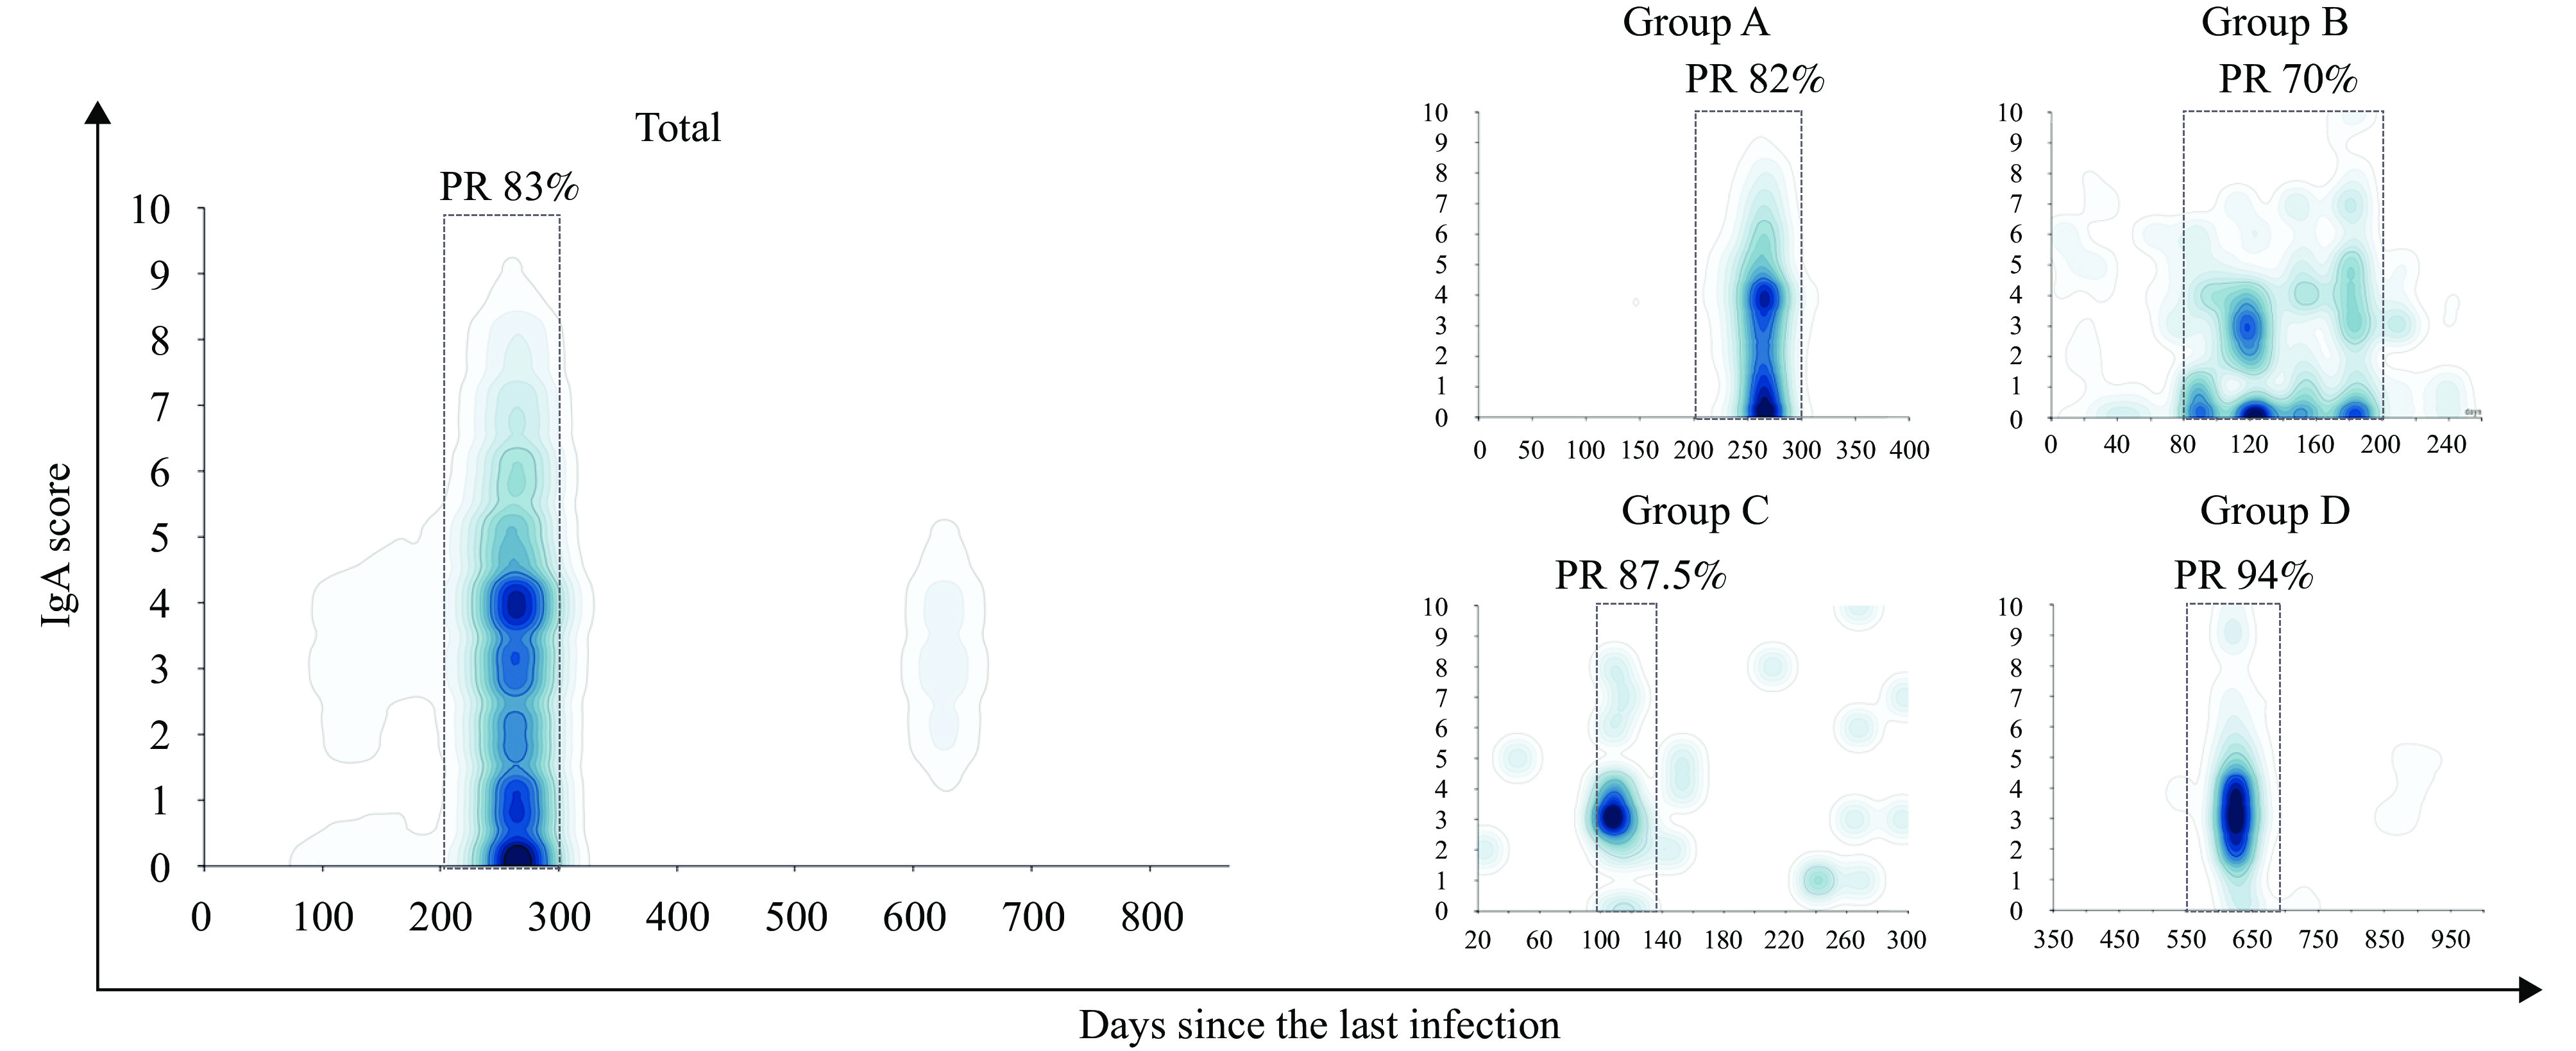 Figure 3.
IgA score on different days since the last infection. Relationship between the number of days post-infection and the corresponding IgA scores, with darker colors indicating greater case numbers.
Note: The x-axis represents the days following infection, while the IgA scores are plotted on the y-axis. The rectangular dotted box highlights the area where the cases are concentrated, and the PR above represents the IgA positivity (including weak positive and significant positive) rates.
Abbreviation: PR=positive rate.
-
Mucosal IgA plays a crucial role in immunity against respiratory viruses (5). To determine the levels of mucosal IgA following COVID-19 pandemic in the winter 2022 in China, we conducted a population investigation in August 2023, and collected the data ranging from September 2022 to August 2023. 3,421 participants were involved, self-tested for nasal mucosal IgA antibody detection and completed an online “Questionnaire Star”. For better analysis of the collected data and tests results, participants were categorized into four groups according to their most recent infection.
We found that the mucosal IgA levels of those with multiple vaccinations or with severed disease symptoms significantly higher than those with once vaccination or with asymptomatic or mild symptoms (P<0.01), these indicating repeated or strong immune responses will provide better nasal immune protection against SARS-CoV-2 infection, also reinforcing previous findings which suggest that multiple vaccinations enhance the mucosal immune response in naturally infected individuals (6-7). We also found that a significant proportion of individuals in Group A with only one infection in the end of 2022 maintaining high level of mucosal IgA antibody (Detected as SP) over six months, average days from 200–300, while for group D, those self-stated only infected once before the investigation time from and reached to 550–700 days with highest IgA positive rate (94%), except the long-term maintenance of nasal IgA, a second or multiple asymptomatic infection may occur in the investigated population, in particular for Group D respondents, This finding infers higher IgA levels might either reduce disease severity or reactivate following asymptomatic infections as reported in previous studies (8-9).
This study improves our understanding of the role of mucosal IgA in respiratory virus protection, helps assess community immunity and provided certain reference value for disease prevention and control strategies. However, the study was subject to some limitations. First, the voluntary aspect of questionnaire participation may introduce some constraints, as participants’ responses may be subject to recall bias or other individualized influences. Moreover, the sample size collected was insufficient for a precise data analysis, and the use of random sampling led to disparities in group sizes. These factors should be taken into account. Subsequent studies could further investigate these relationships using longitudinal research designs.
-
No conflicts of interest.
HTML
| Citation: |

|