Advanced Search

Preplanned Studies: The Burden of Hypertension-Related Chronic Kidney Disease — China, 2010–2019

View author affiliations
  • Summary

    What is already known about this topic?

    The global burden of chronic kidney disease (CKD) is on the rise.

    What is added by this report?

    In 2019, 5.58 million individuals in China were affected by CKD related to hypertension, leading to 70,260 fatalities and 1.69 million disability-adjusted life years (DALYs). The most affected groups were men, older individuals, and residents of western China. Over the period from 2010–2019, the age-standardized prevalence rate (ASPR) remained constant, and the age-standardized mortality rate (ASMR) and age-standardized DALY rate (ASDR) showed a decreasing trend. However, there was an increase in the number of cases, deaths, and DALYs associated with this condition.

    What are the implications for public health practice?

    Hypertension significantly contributes to the burden of CKD; therefore, raising awareness and implementing early screening measures are essential.

  • loading...
  • [1] GBD Chronic Kidney Disease Collaboration. Global, regional, and national burden of chronic kidney disease, 1990–2017: a systematic analysis for the Global Burden of Disease Study 2017. Lancet 2020;395(10225):709 − 33. https://doi.org/10.1016/S0140-6736(20)30045-3CrossRef
    [2] Saran R, Robinson B, Abbott KC, Bragg-Gresham J, Chen XY, Gipson D, et al. US renal data system 2019 annual data report: epidemiology of kidney disease in the United States. Am J Kidney Dis 2020;75(S1):A6 − 7. https://doi.org/10.1053/j.ajkd.2019.09.003CrossRef
    [3] Ma LY, Wang ZW, Fan J, Hu SS. Epidemiology and management of hypertension in China: an analysis using data from the Annual report on cardiovascular health and diseases in China (2021). Chin Gene Pract 2022;25(30):3715-20. https://www.chinagp.net/EN/10.12114/j.issn.1007-9572.2022.0502. (In Chinese
    [4] GBD 2019 Risk Factors Collaborators. Global burden of 87 risk factors in 204 countries and territories, 1990–2019: a systematic analysis for the Global Burden of Disease Study 2019. Lancet 2020;396(10258):1223 − 49. https://doi.org/10.1016/S0140-6736(20)30752-2CrossRef
    [5] Wang LM, Xu X, Zhang M, Hu CH, Zhang X, Li C, et al. Prevalence of chronic kidney disease in China: results from the sixth China chronic disease and risk factor surveillance. JAMA Intern Med 2023;183(4):298 − 310. https://doi.org/10.1001/jamainternmed.2022.6817CrossRef
    [6] Zhang M, Wu J, Zhang X, Hu CH, Zhao ZP, Li C, et al. Prevalence and control of hypertension in adults in China, 2018. Chin J Epidemiol 2021;42(10):1780 − 9. https://doi.org/10.3760/cma.j.cn112338-20210508-00379CrossRef
    [7] Zhou MG, Wang HD, Zeng XY, Yin P, Zhu J, Chen WQ, et al. Mortality, morbidity, and risk factors in China and its provinces, 1990–2017: a systematic analysis for the Global Burden of Disease Study 2017. Lancet 2019;394(10204):1145 − 58. https://doi.org/10.1016/S0140-6736(19)30427-1CrossRef
    [8] Zhang N, Sun XJ, Li C, Wang X, Liu K. Analyzing the equity of health resources allocation in China based on Theil Index. Chin Health Serv Manage 2014;31(2):88-91. https://d.wanfangdata.com.cn/periodical/zgwssygl201402003. (In Chinese). 
    [9] Chinese Society of Nephrology. Guidelines for hypertension management in patients with chronic kidney disease in China (2023). Chin J Nephrol 2023;39(1):48-80. http://qikan.cqvip.com/Qikan/Article/Detail?id=7109247324. (In Chinese). 
    [10] Ren Y, Wang ZW, Wang QJ. The trend of hypertension-related chronic kidney disease from 1990 to 2019 and its predictions over 25 years: an analysis of the Global Burden of Disease Study 2019. Int Urol Nephrol 2023;56(2):707 − 18. https://doi.org/10.1007/s11255-023-03707-wCrossRef
  • FIGURE 1.  Trends of disease burden of hypertension-related chronic kidney disease by gender, 2010–2019. (A) ASPR; (B) ASMR; (C) ASDR.

    Note: Data for Taiwan, China were not included.

    Abbreviation: ASPR=age-standardized prevalence rate; ASMR=age-standardized mortality rate; ASDR=age-standardized DALY rate.

    TABLE 1.  The prevalence, deaths, and DALYs due to hypertension-related CKD in China, 2010–2019.

    Gender Age
    group
    (years)
    Year Prevalence (95% UI) Deaths (95% UI) DALYs (95% UI)
    N (1,000) Rate (1/100,000) N (1,000) Rate (1/100,000) N (1,000) Rate (1/100,000)
    Male
    15–49 2010 498.84
    (434.26, 571.44)
    122.36
    (106.52, 140.16)
    2.59
    (1.79, 3.58)
    0.64
    (0.44, 0.88)
    186.39
    (140.79, 241.91)
    45.72
    (34.53, 59.34)
    2019 454.05
    (392.20, 522.45)
    122.84
    (106.11, 141.35)
    2.18
    (1.46, 3.10)
    0.59
    (0.40, 0.84)
    154.58
    (114.16, 204.87)
    41.82
    (30.88, 55.43)
    Increased (%) −8.98
    (−11.26, −6.72)
    0.40
    (−2.12, 2.89)
    −15.96
    (−38.84, 13.19)
    −7.31
    (−32.54, 24.84)
    −17.06
    (−32.34, 1.17)
    −8.52
    (−25.37, 11.59)
    AAPC (%) (95% CI) −1.03*
    (−1.16, −0.90)
    −0.03
    (−0.15, 0.10)
    −1.89*
    (−2.13, −1.65)
    −0.84*
    (−1.07, −0.60)
    −1.87*
    (−2.29, −1.45)
    −0.68
    (−1.45, 0.09)
    50–69 2010 736.62
    (650.54, 828.42)
    544.97
    (481.29, 612.89)
    8.70
    (6.63, 11.09)
    6.43
    (4.90, 8.20)
    311.15
    (246.62, 385.56)
    230.20
    (182.46, 285.25)
    2019 1,030.10
    (913.51, 1,154.38)
    558.33
    (495.14, 625.69)
    11.21
    (7.95, 15.40)
    6.08
    (4.31, 8.35)
    395.57
    (293.03, 523.84)
    214.41
    (158.83, 283.93)
    Increased (%) 39.84
    (36.69, 43.36)
    2.45
    (0.15, 5.03)
    28.95
    (−5.66,73.95)
    −5.53
    (−30.88, 27.44)
    27.13
    (−1.33, 63.03)
    −6.86
    (−27.71, 19.44)
    AAPC (%) (95% CI) 3.97*
    (3.63, 4.31)
    0.30*
    (0.04, 0.55)
    2.73*
    (2.20, 3.26)
    −0.64*
    (−1.06, −0.22)
    2.70*
    (2.07, 3.33)
    −0.93
    (−2.03, 0.18)
    70+ 2010 848.10
    (748.93, 956.79)
    2,371.76
    (2,094.43, 2,675.71)
    17.12
    (13.78, 20.70)
    47.89
    (38.55, 57.88)
    277.59
    (227.43, 334.90)
    776.28
    (636.01, 936.55)
    2019 1,214.35
    (1,078.15, 1,362.97)
    2,466.18
    (2,189.58, 2,768.01)
    23.34
    (17.95, 29.55)
    47.41
    (36.45, 60.02)
    363.68
    (285.11, 452.21)
    738.58
    (579.03, 918.38)
    Increased (%) 43.18
    (39.47, 46.66)
    3.98
    (1.28, 6.50)
    36.32
    (10.30, 68.95)
    −1.00
    (−19.90, 22.69)
    31.01
    (7.66, 60.05)
    −4.86
    (−21.81, 16.23)
    AAPC (%) (95% CI) 4.13*
    (3.83, 4.42)
    0.45*
    (0.38, 0.53)
    3.36*
    (3.04, 3.68)
    −0.10
    (−0.34, 0.14)
    2.92*
    (2.33, 3.51)
    −0.56*
    (−1.07, −0.05)
    All 2010 2,083.56
    (1,913.49, 2,264.09)
    298.37
    (274.01, 324.22)
    28.41
    (23.20, 33.92)
    4.07
    (3.32, 4.86)
    775.12
    (651.21, 918.75)
    111.00
    (93.25, 131.56)
    2019 2,698.50
    (2,481.89, 2,929.26)
    372.30
    (342.41, 404.14)
    36.73
    (28.43, 46.30)
    5.07
    (3.92, 6.39)
    913.83
    (727.74, 1,145.85)
    126.08
    (100.40, 158.09)
    Increased (%) 29.51
    (27.03, 31.95)
    24.78
    (22.39, 27.12)
    29.30
    (2.14, 64.06)
    24.57
    (−1.60, 58.07)
    17.89
    (−4.65, 45.33)
    13.59
    (−8.14, 40.02)
    AAPC (%) (95% CI) 2.94*
    (2.86, 3.02)
    2.50*
    (2.39, 2.61)
    2.82*
    (2.53, 3.11)
    2.38*
    (2.08, 2.68)
    1.86*
    (1.45, 2.27)
    1.42*
    (1.01, 1.83)
    Female
    15–49 2010 519.79
    (447.04, 596.70)
    132.38
    (113.85, 151.97)
    1.64
    (1.14, 2.25)
    0.42
    (0.29, 0.57)
    144.15
    (111.93, 184.46)
    36.71
    (28.51, 46.98)
    2019 454.17
    (389.44, 527.81)
    129.36
    (110.92, 150.33)
    1.14
    (0.74, 1.68)
    0.33
    (0.21, 0.48)
    106.01
    (78.97, 140.56)
    30.19
    (22.49, 40.03)
    Increased (%) −12.63
    (−14.93, −10.14)
    −2.29
    (−4.86, 0.49)
    −30.31
    (−48.98, −8.58)
    −22.06
    (−42.94, 2.24)
    −26.46
    (−37.53, −14.21)
    −17.76
    (−30.14, −4.05)
    AAPC (%) (95% CI) −1.49*
    (−1.86, −1.12)
    −0.18
    (−0.46, 0.11)
    −4.08*
    (−4.67, −3.49)
    −2.96*
    (−3.38, −2.54)
    −3.05*
    (−3.97, −2.11)
    −1.43*
    (−2.23, −0.61)
    50–69 2010 698.41
    (619.37, 781.06)
    534.70
    (474.19, 597.98)
    7.17
    (5.33, 9.29)
    5.49
    (4.08, 7.12)
    256.28
    (200.07, 321.62)
    196.20
    (153.18, 246.23)
    2019 1,009.52
    (899.36, 1,126.30)
    547.50
    (487.76, 610.84)
    9.08
    (6.52, 12.17)
    4.92
    (3.54, 6.60)
    322.98
    (245.02, 419.48)
    175.17
    (132.88, 227.50)
    Increased (%) 44.55
    (40.86, 47.99)
    2.39
    (−0.21, 4.83)
    26.52
    (−2.69, 60.01)
    −10.38
    (−31.06, 13.35)
    26.03
    (1.58, 52.57)
    −10.72
    (−28.04, 8.08)
    AAPC (%) (95% CI) 4.33*
    (4.04, 4.62)
    0.27
    (−0.01, 0.55)
    2.62*
    (2.44, 2.81)
    −1.33*
    (−1.59, −1.08)
    3.31*
    (2.55, 4.08)
    −0.78*
    (−1.42, −0.13)
    70+ 2010 956.96
    (856.31, 1,068.56)
    2,291.95
    (2,050.89, 2,559.24)
    17.28
    (13.92, 20.73)
    41.38
    (33.33, 49.66)
    267.59
    (220.01, 315.15)
    640.89
    (526.93, 754.80)
    2019 1,415.15
    (1,278.82, 1,574.44)
    2,409.79
    (2,177.65, 2,681.04)
    23.31
    (17.69, 29.40)
    39.69
    (30.12, 50.06)
    349.31
    (274.15, 430.44)
    594.82
    (466.84, 732.97)
    Increased (%) 47.88
    (43.63, 51.68)
    5.14
    (2.12, 7.84)
    34.91
    (10.89, 60.64)
    −4.08
    (−21.16, 14.21)
    30.54
    (9.96, 52.57)
    −7.19
    (−21.82, 8.48)
    AAPC (%) (95% CI) 4.51*
    (4.32, 4.71)
    0.52*
    (0.28, 0.77)
    3.09*
    (2.81, 3.38)
    −0.58*
    (−1.02, −0.14)
    3.16*
    (2.80, 3.53)
    −0.84*
    (−1.57, −0.09)
    All 2010 2,175.16
    (2,010.93, 2,353.79)
    326.50
    (301.85, 353.31)
    26.09
    (21.37, 31.17)
    3.92
    (3.21, 4.68)
    668.02
    (567.07, 786.09)
    100.27
    (85.12, 117.99)
    2019 2,878.84
    (2,666.82, 3,112.65)
    412.72
    (382.32, 446.24)
    33.53
    (25.76, 42.24)
    4.81
    (3.69, 6.06)
    778.30
    (620.28, 952.58)
    111.58
    (88.92, 136.56)
    Increased (%) 32.35
    (29.76, 34.92)
    26.41
    (23.94, 28.87)
    28.50
    (3.30, 56.07)
    22.73
    (−1.34, 49.06)
    16.51
    (−3.15, 38.30)
    11.28
    (−7.50, 32.09)
    AAPC (%) (95% CI) 3.19*
    (3.08, 3.29)
    2.64*
    (2.51, 2.78)
    2.70*
    (2.23, 3.17)
    2.16*
    (1.68, 2.65)
    2.17*
    (1.60, 2.75)
    1.63*
    (1.08, 2.19)
    Both
    15–49 2010 1,018.63
    (885.83, 1,170.12)
    127.28
    (110.68, 146.20)
    4.23
    (3.02, 5.69)
    0.53
    (0.38, 0.71)
    330.54
    (256.36, 419.93)
    41.30
    (32.03, 52.47)
    2019 908.22
    (786.28, 1,048.19)
    126.01
    (109.10, 145.44)
    3.32
    (2.29, 4.55)
    0.46
    (0.32, 0.63)
    260.59
    (199.16, 338.19)
    36.16
    (27.63, 46.92)
    Increased (%) −10.84
    (−12.85, −8.66)
    −0.99
    (−3.22, 1.44)
    −21.53
    (−37.98, −2.82)
    −12.86
    (−31.12, 7.91)
    −21.16
    (−31.31, −10.03)
    −12.45
    (−23.72, −0.09)
    AAPC (%) (95% CI) −1.34*
    (−1.63, −1.05)
    −0.11
    (−0.28, 0.06)
    −2.72*
    (−2.87, −2.56)
    −1.50*
    (−1.72, −1.28)
    −2.37*
    (−2.96, −1.79)
    −1.12*
    (−1.98, −0.25)
    50–69 2010 1,435.03
    (1,272.88, 1,605.78)
    539.92
    (478.92, 604.17)
    15.87
    (12.32, 19.85)
    5.97
    (4.64, 7.47)
    567.42
    (453.40, 694.22)
    213.49
    (170.59, 261.20)
    2019 2,039.62
    (1,815.02, 2,273.49)
    552.92
    (492.03, 616.32)
    20.29
    (15.25, 26.15)
    5.50
    (4.13, 7.09)
    718.55
    (554.74, 898.06)
    194.79
    (150.39, 243.45)
    Increased (%) 42.13
    (39.21, 44.82)
    2.41
    (0.30, 4.35)
    27.85
    (4.90, 57.42)
    −7.88
    (−24.42, 13.42)
    26.63
    (7.51, 49.69)
    −8.76
    (−22.54, 7.85)
    AAPC (%) (95% CI) 4.14*
    (3.83, 4.46)
    0.28*
    (0.02, 0.54)
    2.66*
    (2.33, 2.98)
    −0.93*
    (−1.15, −0.71)
    2.86*
    (2.17, 3.57)
    −0.95*
    (−1.72, −0.17)
    70+ 2010 1,805.07
    (1,607.57, 2,021.62)
    2,328.77
    (2,073.97, 2,608.16)
    34.40
    (28.11, 40.87)
    44.38
    (36.26, 52.73)
    545.18
    (447.97, 640.85)
    703.35
    (577.94, 826.78)
    2019 2,629.49
    (2,364.44, 2,924.39)
    2,435.51
    (2,190.01, 2,708.65)
    46.65
    (37.34, 56.27)
    43.21
    (34.58, 52.12)
    712.98
    (584.18, 852.91)
    660.38
    (541.08, 789.99)
    Increased (%) 45.67
    (42.56, 48.81)
    4.58
    (2.35, 6.84)
    35.61
    (16.59, 56.07)
    −2.64
    (−16.30, 12.05)
    30.78
    (14.32, 48.39)
    −6.11
    (−17.92, 6.54)
    AAPC (%) (95% CI) 4.37*
    (4.23, 4.50)
    0.49*
    (0.33, 0.65)
    3.29*
    (2.96, 3.63)
    −0.39*
    (−0.62, −0.16)
    3.00*
    (2.45, 3.55)
    −0.80*
    (−1.43, −0.17)
    All 2010 4,258.73
    (3,937.49, 4,617.97)
    312.10
    (288.56, 338.43)
    54.50
    (45.88, 64.50)
    3.99
    (3.36, 4.73)
    1,443.14
    (1,232.51, 1,685.79)
    105.76
    (90.32, 123.54)
    2019 5,577.33
    (5,161.60, 6,034.39)
    392.12
    (362.89, 424.25)
    70.26
    (56.87, 84.48)
    4.94
    (4.00, 5.94)
    1,692.13
    (1,393.41, 2,014.21)
    118.97
    (97.97, 141.61)
    Increased (%) 30.96
    (28.88, 33.03)
    25.64
    (23.65, 27.62)
    28.92
    (9.43, 51.03)
    23.68
    (4.98, 44.89)
    17.25
    (1.91, 35.02)
    12.49
    (−2.23, 29.53)
        AAPC (%) (95% CI) 3.07*
    (2.98, 3.16)
    2.58*
    (2.46, 2.69)
    2.78*
    (2.56, 2.99)
    2.29*
    (2.06, 2.53)
    1.92*
    (1.34, 2.51)
    1.44*
    (0.89, 1.99)
    Note: The percentage change (%) was calculated as the difference in value between 2019 and 2010, divided by the value in 2010. Data for Taiwan, China were not included. N: number of cases.
    Abbreviation: CKD=chronic kidney disease; DALYs=disability-adjusted life years; AAPC=average annual percentage change; CI=confidence interval; UI=uncertainty interval.
    * P<0.05.
    Download: CSV

    TABLE 2.  Distribution of disease burden of hypertension-related CKD by PLAD, 2019.

    PLADsPrevalence (95% UI)Deaths (95% UI)DALYs (95% UI)
    N (1,000)R' (1/100,000)N (1,000)R' (1/100,000)N (1,000)R' (1/100,000)
    Anhui250.77
    (224.62, 281.31)
    291.24
    (260.11, 329.24)
    2.42
    (1.85, 3.11)
    2.94
    (2.27, 3.74)
    61.39
    (48.80, 75.54)
    69.47
    (55.78, 85.33)
    Beijing70.40
    (64.46, 77.09)
    220.02
    (201.89, 240.42)
    0.72
    (0.56, 0.89)
    2.39
    (1.88, 2.96)
    18.27
    (14.63, 22.49)
    55.27
    (44.63, 67.37)
    Chongqing126.29
    (112.66, 140.94)
    318.79
    (283.15, 358.98)
    1.82
    (1.38, 2.33)
    4.68
    (3.57, 5.91)
    39.65
    (31.02, 49.48)
    97.33
    (77.20, 121.29)
    Fujian148.85
    (133.41, 167.84)
    307.62
    (275.37, 346.82)
    1.57
    (1.24, 1.96)
    3.56
    (2.84, 4.42)
    38.25
    (30.97, 46.14)
    77.40
    (63.14, 92.91)
    Gansu92.92
    (82.61, 105.43)
    294.52
    (262.64, 333.08)
    1.40
    (1.10, 1.75)
    5.29
    (4.21, 6.51)
    32.22
    (25.53, 39.47)
    101.10
    (81.73, 122.03)
    Guangdong375.88
    (336.53, 421.30)
    290.79
    (262.13, 322.75)
    3.93
    (3.10, 4.88)
    3.37
    (2.67, 4.18)
    99.97
    (80.95, 122.84)
    75.83
    (62.02, 92.67)
    Guangxi184.60
    (166.07, 205.76)
    317.65
    (285.62, 356.74)
    3.37
    (2.57, 4.36)
    6.07
    (4.70, 7.77)
    77.57
    (59.76, 99.21)
    128.89
    (100.40, 163.71)
    Guizhou124.02
    (110.96, 138.34)
    303.79
    (271.52, 339.71)
    2.39
    (1.83, 3.02)
    6.48
    (4.99, 8.05)
    53.91
    (41.95, 67.54)
    128.90
    (100.33, 159.07)
    Hainan31.83
    (28.42, 36.05)
    299.02
    (267.68, 336.60)
    0.44
    (0.34, 0.56)
    4.66
    (3.59, 5.79)
    10.63
    (8.35, 13.26)
    97.47
    (77.67, 120.25)
    Hebei329.49
    (288.33, 379.53)
    348.94
    (305.18, 404.12)
    3.95
    (3.06, 4.97)
    4.93
    (3.85, 6.11)
    96.65
    (76.91, 120.03)
    101.11
    (81.83, 123.31)
    Heilongjiang161.96
    (144.29, 181.89)
    295.51
    (264.41, 333.86)
    1.44
    (1.11, 1.83)
    2.95
    (2.32, 3.67)
    42.00
    (33.41, 52.73)
    72.08
    (58.81, 88.88)
    Henan293.45
    (257.88, 333.06)
    251.12
    (221.34, 286.57)
    3.50
    (2.71, 4.47)
    3.24
    (2.52, 4.11)
    88.02
    (69.84, 109.04)
    72.85
    (58.26, 89.00)
    Hong Kong SAR47.22
    (43.02, 51.71)
    325.31
    (293.83, 361.18)
    0.78
    (0.56, 1.05)
    4.71
    (3.33, 6.32)
    13.27
    (10.02, 17.13)
    91.13
    (69.08, 117.21)
    Hubei255.28
    (228.11, 287.46)
    321.39
    (288.39, 362.21)
    3.75
    (2.92, 4.80)
    5.19
    (4.06, 6.53)
    85.76
    (67.87, 106.74)
    104.52
    (83.93, 128.31)
    Hunan334.70
    (298.57, 373.80)
    363.54
    (323.45, 409.03)
    7.20
    (5.52, 8.99)
    8.42
    (6.52, 10.37)
    154.41
    (120.05, 191.20)
    163.42
    (128.13, 201.46)
    Inner Mongolia98.78
    (88.05, 111.65)
    305.21
    (271.72, 345.93)
    1.03
    (0.81, 1.29)
    3.79
    (2.99, 4.66)
    27.49
    (22.27, 34.04)
    81.78
    (67.00, 99.41)
    Jiangsu351.76
    (312.67, 394.35)
    271.57
    (240.86, 307.33)
    3.06
    (2.34, 3.99)
    2.41
    (1.84, 3.12)
    73.61
    (58.69, 91.47)
    56.45
    (45.27, 69.71)
    Jiangxi171.05
    (151.24, 191.10)
    316.45
    (281.12, 353.50)
    2.86
    (2.22, 3.56)
    6.01
    (4.72, 7.40)
    62.47
    (50.11, 75.47)
    113.88
    (92.63, 137.32)
    Jilin128.26
    (114.20, 143.41)
    325.56
    (288.88, 364.07)
    1.42
    (1.17, 1.75)
    3.97
    (3.31, 4.75)
    38.18
    (30.99, 47.10)
    91.71
    (75.62, 110.21)
    Liaoning225.02
    (201.51, 253.29)
    317.56
    (283.41, 359.92)
    2.16
    (1.67, 2.80)
    3.19
    (2.48, 4.06)
    57.52
    (45.30, 71.78)
    77.63
    (62.22, 95.40)
    Macao SAR2.77
    (2.46, 3.14)
    305.78
    (271.86, 346.79)
    0.02
    (0.02, 0.03)
    2.74
    (2.00, 3.66)
    0.61
    (0.47, 0.78)
    65.73
    (50.57, 83.18)
    Ningxia20.71
    (18.33, 23.35)
    296.09
    (264.50, 328.79)
    0.23
    (0.17, 0.30)
    3.96
    (3.05, 5.02)
    6.27
    (4.84, 7.91)
    85.62
    (68.20, 106.90)
    Qinghai18.38
    (16.28, 20.89)
    302.02
    (270.14, 340.67)
    0.34
    (0.26, 0.42)
    6.80
    (5.37, 8.30)
    8.98
    (7.07, 11.27)
    141.17
    (113.29, 172.84)
    Shaanxi153.68
    (137.59, 171.98)
    308.47
    (276.27, 346.28)
    2.04
    (1.52, 2.60)
    4.64
    (3.55, 5.84)
    50.55
    (39.20, 63.59)
    98.02
    (77.23, 121.55)
    Shandong417.17
    (375.61, 462.47)
    289.92
    (261.04, 325.41)
    3.13
    (2.43, 4.00)
    2.28
    (1.79, 2.88)
    84.71
    (67.77, 104.96)
    57.46
    (46.39, 70.22)
    Shanghai100.23
    (91.13, 110.46)
    242.35
    (219.59, 267.90)
    1.11
    (0.85, 1.38)
    2.74
    (2.09, 3.39)
    24.74
    (19.75, 29.98)
    58.86
    (47.20, 71.45)
    Shanxi136.79
    (122.42, 154.86)
    305.28
    (273.04, 343.62)
    1.52
    (1.14, 1.92)
    3.97
    (3.03, 4.90)
    38.88
    (30.07, 48.72)
    84.07
    (65.66, 103.98)
    Sichuan344.44
    (305.25, 387.89)
    284.79
    (251.15, 323.06)
    5.17
    (3.91, 6.56)
    4.49
    (3.50, 5.58)
    121.77
    (95.94, 149.89)
    96.43
    (77.13, 117.41)
    Tianjin60.97
    (54.39, 69.38)
    299.01
    (266.54, 340.00)
    0.48
    (0.36, 0.62)
    2.54
    (1.95, 3.28)
    13.87
    (11.01, 17.27)
    64.81
    (52.27, 80.08)
    Xizang7.07
    (6.12, 8.28)
    259.04
    (229.46, 292.24)
    0.17
    (0.13, 0.22)
    7.95
    (6.32, 9.95)
    4.82
    (3.81, 6.12)
    171.42
    (137.34, 213.09)
    Xinjiang72.39
    (64.48, 82.81)
    307.37
    (277.16, 347.93)
    1.22
    (0.95, 1.55)
    6.41
    (4.99, 8.09)
    32.53
    (25.63, 40.48)
    133.03
    (106.18, 164.92)
    Yunnan161.26
    (143.21, 182.01)
    307.25
    (273.68, 346.74)
    3.14
    (2.48, 3.88)
    6.85
    (5.50, 8.38)
    74.96
    (60.30, 92.15)
    138.39
    (112.61, 168.16)
    Zhejiang278.98
    (248.46, 311.14)
    324.35
    (287.47, 364.77)
    2.45
    (1.91, 3.05)
    3.02
    (2.34, 3.72)
    58.23
    (46.88, 70.09)
    67.24
    (54.73, 80.53)
    Total5,577.33
    (5,161.60, 6,034.39)
    300.76
    (278.72, 325.76)
    70.26
    (56.87, 84.48)
    4.09
    (3.32, 4.88)
    1,692.13
    (1,393.41, 2,014.21)
    88.48
    (73.38, 104.46)
    Note: N: number of cases; R': age-standardized rate calculated using the 2010 National Census as the standard population. Data for Taiwan, China were not included.
    Abbreviation: DALYs=disability-adjusted life years; UI=uncertainty interval; PLAD=provincial-level administrative division; SAR=Special Administrative Region.
    Download: CSV

Citation:

通讯作者: 陈斌, bchen63@163.com
  • 1. 

    沈阳化工大学材料科学与工程学院 沈阳 110142

  1. 本站搜索
  2. 百度学术搜索
  3. 万方数据库搜索
  4. CNKI搜索
Turn off MathJax
Article Contents

Article Metrics

Article views(694) PDF downloads(8) Cited by()

Share

Related

The Burden of Hypertension-Related Chronic Kidney Disease — China, 2010–2019

View author affiliations

Summary

What is already known about this topic?

The global burden of chronic kidney disease (CKD) is on the rise.

What is added by this report?

In 2019, 5.58 million individuals in China were affected by CKD related to hypertension, leading to 70,260 fatalities and 1.69 million disability-adjusted life years (DALYs). The most affected groups were men, older individuals, and residents of western China. Over the period from 2010–2019, the age-standardized prevalence rate (ASPR) remained constant, and the age-standardized mortality rate (ASMR) and age-standardized DALY rate (ASDR) showed a decreasing trend. However, there was an increase in the number of cases, deaths, and DALYs associated with this condition.

What are the implications for public health practice?

Hypertension significantly contributes to the burden of CKD; therefore, raising awareness and implementing early screening measures are essential.

  • 1. Chinese Center for Disease Control and Prevention, Beijing, China
  • 2. National Center for Chronic and Non-Communicable Disease Control and Prevention, Chinese Center For Disease Control and Prevention, Beijing, China
  • 3. China National Health Development Research Center, Beijing, China
  • Corresponding authors:

    Yamin Bai, baiyamin@ncncd.chinacdc.cn

    Xuancheng Lu, luxc@chinacdc.cn

    Online Date: April 05 2024
    Issue Date: April 05 2024
    doi: 10.46234/ccdcw2024.055
  • Chronic kidney disease (CKD) has emerged as a pervasive global public health concern. Globally, it accounted for 1.2 million deaths in 2017, standing out as one of the leading causes of mortality (1). Hypertension stands as a significant risk factor in the onset and progression of CKD. Notably, in the United States, about 27.5% of patients are compelled to commence dialysis annually due to hypertensive nephropathy (2). In China, the staggering figure of 245 million individuals grapples with hypertension, warranting timely interventions to avert CKD progression (3). Ascertaining the landscape of hypertension-linked CKD burdens, particularly across various provincial-level administrative divisions (PLADs) in China, is critical for shaping informed health policies and interventions. Surprisingly, no pertinent studies addressing this topic have been disseminated. Consequently, our analysis of the Global Burden of Disease 2019 (GBD 2019) dataset sought to delineate the scope of hypertension-related CKD in China. In 2019, 5.58 million individuals in China were afflicted with hypertension-induced CKD, culminating in 70,260 fatalities and 1.69 million disability-adjusted life years (DALYs). Alarmingly, the number of cases, deaths, and DALYs witnessed an uptrend from 2010 to 2019. These findings underscore the pivotal role of hypertension in exacerbating the CKD burden, necessitating immediate and concerted interventions.

    Disease burden indicators data were sourced from the GBD 2019 database and are available at https://vizhub.healthdata.org/gbd-results/. The GBD 2019 database covers 369 diseases and injuries, and catalogs 87 risk factors across 204 countries and territories. This database provides estimates for various metrics such as morbidity, prevalence, mortality, years of potential life lost (YLLs), years lived with disability, and DALYs. The data within this database were obtained from population censuses, death registries, disease surveillance, health service utilization, and published literature (4).

    Within the GBD 2019 database, CKD is categorized into five subtypes: CKD attributable to type 1 diabetes mellitus, type 2 diabetes mellitus, hypertension, glomerulonephritis, and other and unspecified causes. For the purpose of this report, we focused exclusively on evaluating the burden of CKD resulting from hypertension. Coding for CKD due to hypertension was conducted using the International Statistical Classification of Diseases and Related Health Problems 10th Revision (ICD-10), with the pertinent codes falling under I12-I13.9.

    Microsoft Excel software (version 16.7; Microsoft Corporation, Redmond, USA) was utilized to analyze the burden of CKD based on gender, age, and presence of PLAD. Joinpoint software (version 5.0.2; Applications Branch, National Cancer Institute, Bethesda, USA) was employed to determine the average annual percentage change (AAPC) to assess the disease burden trend.

    In 2019, the prevalence of CKD attributed to hypertension was 5.58 million, resulting in 70,260 fatalities and 1.69 million DALYs. A higher burden was observed in males; although fewer males (2.70 million) were affected compared to females (2.88 million), the fatalities were higher in males (men: 36,733, women: 33,526), with males also accounting for a greater number of DALYs (men: 0.91 million, women: 0.78 million). The impact of the disease was more pronounced among older individuals; prevalence, mortality, and DALY rates increased with age, peaking in individuals aged ≥70 years (prevalence rate: 2,435.51/105, mortality rate: 43.21/105, DALY rate: 660.38/105). Over the period from 2010 to 2019, the disease burden consistently rose, with a 30.96% increase in the number of cases, a 28.92% rise in deaths, and a 17.25% surge in DALYs (Table 1).

    Gender Age
    group
    (years)
    Year Prevalence (95% UI) Deaths (95% UI) DALYs (95% UI)
    N (1,000) Rate (1/100,000) N (1,000) Rate (1/100,000) N (1,000) Rate (1/100,000)
    Male
    15–49 2010 498.84
    (434.26, 571.44)
    122.36
    (106.52, 140.16)
    2.59
    (1.79, 3.58)
    0.64
    (0.44, 0.88)
    186.39
    (140.79, 241.91)
    45.72
    (34.53, 59.34)
    2019 454.05
    (392.20, 522.45)
    122.84
    (106.11, 141.35)
    2.18
    (1.46, 3.10)
    0.59
    (0.40, 0.84)
    154.58
    (114.16, 204.87)
    41.82
    (30.88, 55.43)
    Increased (%) −8.98
    (−11.26, −6.72)
    0.40
    (−2.12, 2.89)
    −15.96
    (−38.84, 13.19)
    −7.31
    (−32.54, 24.84)
    −17.06
    (−32.34, 1.17)
    −8.52
    (−25.37, 11.59)
    AAPC (%) (95% CI) −1.03*
    (−1.16, −0.90)
    −0.03
    (−0.15, 0.10)
    −1.89*
    (−2.13, −1.65)
    −0.84*
    (−1.07, −0.60)
    −1.87*
    (−2.29, −1.45)
    −0.68
    (−1.45, 0.09)
    50–69 2010 736.62
    (650.54, 828.42)
    544.97
    (481.29, 612.89)
    8.70
    (6.63, 11.09)
    6.43
    (4.90, 8.20)
    311.15
    (246.62, 385.56)
    230.20
    (182.46, 285.25)
    2019 1,030.10
    (913.51, 1,154.38)
    558.33
    (495.14, 625.69)
    11.21
    (7.95, 15.40)
    6.08
    (4.31, 8.35)
    395.57
    (293.03, 523.84)
    214.41
    (158.83, 283.93)
    Increased (%) 39.84
    (36.69, 43.36)
    2.45
    (0.15, 5.03)
    28.95
    (−5.66,73.95)
    −5.53
    (−30.88, 27.44)
    27.13
    (−1.33, 63.03)
    −6.86
    (−27.71, 19.44)
    AAPC (%) (95% CI) 3.97*
    (3.63, 4.31)
    0.30*
    (0.04, 0.55)
    2.73*
    (2.20, 3.26)
    −0.64*
    (−1.06, −0.22)
    2.70*
    (2.07, 3.33)
    −0.93
    (−2.03, 0.18)
    70+ 2010 848.10
    (748.93, 956.79)
    2,371.76
    (2,094.43, 2,675.71)
    17.12
    (13.78, 20.70)
    47.89
    (38.55, 57.88)
    277.59
    (227.43, 334.90)
    776.28
    (636.01, 936.55)
    2019 1,214.35
    (1,078.15, 1,362.97)
    2,466.18
    (2,189.58, 2,768.01)
    23.34
    (17.95, 29.55)
    47.41
    (36.45, 60.02)
    363.68
    (285.11, 452.21)
    738.58
    (579.03, 918.38)
    Increased (%) 43.18
    (39.47, 46.66)
    3.98
    (1.28, 6.50)
    36.32
    (10.30, 68.95)
    −1.00
    (−19.90, 22.69)
    31.01
    (7.66, 60.05)
    −4.86
    (−21.81, 16.23)
    AAPC (%) (95% CI) 4.13*
    (3.83, 4.42)
    0.45*
    (0.38, 0.53)
    3.36*
    (3.04, 3.68)
    −0.10
    (−0.34, 0.14)
    2.92*
    (2.33, 3.51)
    −0.56*
    (−1.07, −0.05)
    All 2010 2,083.56
    (1,913.49, 2,264.09)
    298.37
    (274.01, 324.22)
    28.41
    (23.20, 33.92)
    4.07
    (3.32, 4.86)
    775.12
    (651.21, 918.75)
    111.00
    (93.25, 131.56)
    2019 2,698.50
    (2,481.89, 2,929.26)
    372.30
    (342.41, 404.14)
    36.73
    (28.43, 46.30)
    5.07
    (3.92, 6.39)
    913.83
    (727.74, 1,145.85)
    126.08
    (100.40, 158.09)
    Increased (%) 29.51
    (27.03, 31.95)
    24.78
    (22.39, 27.12)
    29.30
    (2.14, 64.06)
    24.57
    (−1.60, 58.07)
    17.89
    (−4.65, 45.33)
    13.59
    (−8.14, 40.02)
    AAPC (%) (95% CI) 2.94*
    (2.86, 3.02)
    2.50*
    (2.39, 2.61)
    2.82*
    (2.53, 3.11)
    2.38*
    (2.08, 2.68)
    1.86*
    (1.45, 2.27)
    1.42*
    (1.01, 1.83)
    Female
    15–49 2010 519.79
    (447.04, 596.70)
    132.38
    (113.85, 151.97)
    1.64
    (1.14, 2.25)
    0.42
    (0.29, 0.57)
    144.15
    (111.93, 184.46)
    36.71
    (28.51, 46.98)
    2019 454.17
    (389.44, 527.81)
    129.36
    (110.92, 150.33)
    1.14
    (0.74, 1.68)
    0.33
    (0.21, 0.48)
    106.01
    (78.97, 140.56)
    30.19
    (22.49, 40.03)
    Increased (%) −12.63
    (−14.93, −10.14)
    −2.29
    (−4.86, 0.49)
    −30.31
    (−48.98, −8.58)
    −22.06
    (−42.94, 2.24)
    −26.46
    (−37.53, −14.21)
    −17.76
    (−30.14, −4.05)
    AAPC (%) (95% CI) −1.49*
    (−1.86, −1.12)
    −0.18
    (−0.46, 0.11)
    −4.08*
    (−4.67, −3.49)
    −2.96*
    (−3.38, −2.54)
    −3.05*
    (−3.97, −2.11)
    −1.43*
    (−2.23, −0.61)
    50–69 2010 698.41
    (619.37, 781.06)
    534.70
    (474.19, 597.98)
    7.17
    (5.33, 9.29)
    5.49
    (4.08, 7.12)
    256.28
    (200.07, 321.62)
    196.20
    (153.18, 246.23)
    2019 1,009.52
    (899.36, 1,126.30)
    547.50
    (487.76, 610.84)
    9.08
    (6.52, 12.17)
    4.92
    (3.54, 6.60)
    322.98
    (245.02, 419.48)
    175.17
    (132.88, 227.50)
    Increased (%) 44.55
    (40.86, 47.99)
    2.39
    (−0.21, 4.83)
    26.52
    (−2.69, 60.01)
    −10.38
    (−31.06, 13.35)
    26.03
    (1.58, 52.57)
    −10.72
    (−28.04, 8.08)
    AAPC (%) (95% CI) 4.33*
    (4.04, 4.62)
    0.27
    (−0.01, 0.55)
    2.62*
    (2.44, 2.81)
    −1.33*
    (−1.59, −1.08)
    3.31*
    (2.55, 4.08)
    −0.78*
    (−1.42, −0.13)
    70+ 2010 956.96
    (856.31, 1,068.56)
    2,291.95
    (2,050.89, 2,559.24)
    17.28
    (13.92, 20.73)
    41.38
    (33.33, 49.66)
    267.59
    (220.01, 315.15)
    640.89
    (526.93, 754.80)
    2019 1,415.15
    (1,278.82, 1,574.44)
    2,409.79
    (2,177.65, 2,681.04)
    23.31
    (17.69, 29.40)
    39.69
    (30.12, 50.06)
    349.31
    (274.15, 430.44)
    594.82
    (466.84, 732.97)
    Increased (%) 47.88
    (43.63, 51.68)
    5.14
    (2.12, 7.84)
    34.91
    (10.89, 60.64)
    −4.08
    (−21.16, 14.21)
    30.54
    (9.96, 52.57)
    −7.19
    (−21.82, 8.48)
    AAPC (%) (95% CI) 4.51*
    (4.32, 4.71)
    0.52*
    (0.28, 0.77)
    3.09*
    (2.81, 3.38)
    −0.58*
    (−1.02, −0.14)
    3.16*
    (2.80, 3.53)
    −0.84*
    (−1.57, −0.09)
    All 2010 2,175.16
    (2,010.93, 2,353.79)
    326.50
    (301.85, 353.31)
    26.09
    (21.37, 31.17)
    3.92
    (3.21, 4.68)
    668.02
    (567.07, 786.09)
    100.27
    (85.12, 117.99)
    2019 2,878.84
    (2,666.82, 3,112.65)
    412.72
    (382.32, 446.24)
    33.53
    (25.76, 42.24)
    4.81
    (3.69, 6.06)
    778.30
    (620.28, 952.58)
    111.58
    (88.92, 136.56)
    Increased (%) 32.35
    (29.76, 34.92)
    26.41
    (23.94, 28.87)
    28.50
    (3.30, 56.07)
    22.73
    (−1.34, 49.06)
    16.51
    (−3.15, 38.30)
    11.28
    (−7.50, 32.09)
    AAPC (%) (95% CI) 3.19*
    (3.08, 3.29)
    2.64*
    (2.51, 2.78)
    2.70*
    (2.23, 3.17)
    2.16*
    (1.68, 2.65)
    2.17*
    (1.60, 2.75)
    1.63*
    (1.08, 2.19)
    Both
    15–49 2010 1,018.63
    (885.83, 1,170.12)
    127.28
    (110.68, 146.20)
    4.23
    (3.02, 5.69)
    0.53
    (0.38, 0.71)
    330.54
    (256.36, 419.93)
    41.30
    (32.03, 52.47)
    2019 908.22
    (786.28, 1,048.19)
    126.01
    (109.10, 145.44)
    3.32
    (2.29, 4.55)
    0.46
    (0.32, 0.63)
    260.59
    (199.16, 338.19)
    36.16
    (27.63, 46.92)
    Increased (%) −10.84
    (−12.85, −8.66)
    −0.99
    (−3.22, 1.44)
    −21.53
    (−37.98, −2.82)
    −12.86
    (−31.12, 7.91)
    −21.16
    (−31.31, −10.03)
    −12.45
    (−23.72, −0.09)
    AAPC (%) (95% CI) −1.34*
    (−1.63, −1.05)
    −0.11
    (−0.28, 0.06)
    −2.72*
    (−2.87, −2.56)
    −1.50*
    (−1.72, −1.28)
    −2.37*
    (−2.96, −1.79)
    −1.12*
    (−1.98, −0.25)
    50–69 2010 1,435.03
    (1,272.88, 1,605.78)
    539.92
    (478.92, 604.17)
    15.87
    (12.32, 19.85)
    5.97
    (4.64, 7.47)
    567.42
    (453.40, 694.22)
    213.49
    (170.59, 261.20)
    2019 2,039.62
    (1,815.02, 2,273.49)
    552.92
    (492.03, 616.32)
    20.29
    (15.25, 26.15)
    5.50
    (4.13, 7.09)
    718.55
    (554.74, 898.06)
    194.79
    (150.39, 243.45)
    Increased (%) 42.13
    (39.21, 44.82)
    2.41
    (0.30, 4.35)
    27.85
    (4.90, 57.42)
    −7.88
    (−24.42, 13.42)
    26.63
    (7.51, 49.69)
    −8.76
    (−22.54, 7.85)
    AAPC (%) (95% CI) 4.14*
    (3.83, 4.46)
    0.28*
    (0.02, 0.54)
    2.66*
    (2.33, 2.98)
    −0.93*
    (−1.15, −0.71)
    2.86*
    (2.17, 3.57)
    −0.95*
    (−1.72, −0.17)
    70+ 2010 1,805.07
    (1,607.57, 2,021.62)
    2,328.77
    (2,073.97, 2,608.16)
    34.40
    (28.11, 40.87)
    44.38
    (36.26, 52.73)
    545.18
    (447.97, 640.85)
    703.35
    (577.94, 826.78)
    2019 2,629.49
    (2,364.44, 2,924.39)
    2,435.51
    (2,190.01, 2,708.65)
    46.65
    (37.34, 56.27)
    43.21
    (34.58, 52.12)
    712.98
    (584.18, 852.91)
    660.38
    (541.08, 789.99)
    Increased (%) 45.67
    (42.56, 48.81)
    4.58
    (2.35, 6.84)
    35.61
    (16.59, 56.07)
    −2.64
    (−16.30, 12.05)
    30.78
    (14.32, 48.39)
    −6.11
    (−17.92, 6.54)
    AAPC (%) (95% CI) 4.37*
    (4.23, 4.50)
    0.49*
    (0.33, 0.65)
    3.29*
    (2.96, 3.63)
    −0.39*
    (−0.62, −0.16)
    3.00*
    (2.45, 3.55)
    −0.80*
    (−1.43, −0.17)
    All 2010 4,258.73
    (3,937.49, 4,617.97)
    312.10
    (288.56, 338.43)
    54.50
    (45.88, 64.50)
    3.99
    (3.36, 4.73)
    1,443.14
    (1,232.51, 1,685.79)
    105.76
    (90.32, 123.54)
    2019 5,577.33
    (5,161.60, 6,034.39)
    392.12
    (362.89, 424.25)
    70.26
    (56.87, 84.48)
    4.94
    (4.00, 5.94)
    1,692.13
    (1,393.41, 2,014.21)
    118.97
    (97.97, 141.61)
    Increased (%) 30.96
    (28.88, 33.03)
    25.64
    (23.65, 27.62)
    28.92
    (9.43, 51.03)
    23.68
    (4.98, 44.89)
    17.25
    (1.91, 35.02)
    12.49
    (−2.23, 29.53)
        AAPC (%) (95% CI) 3.07*
    (2.98, 3.16)
    2.58*
    (2.46, 2.69)
    2.78*
    (2.56, 2.99)
    2.29*
    (2.06, 2.53)
    1.92*
    (1.34, 2.51)
    1.44*
    (0.89, 1.99)
    Note: The percentage change (%) was calculated as the difference in value between 2019 and 2010, divided by the value in 2010. Data for Taiwan, China were not included. N: number of cases.
    Abbreviation: CKD=chronic kidney disease; DALYs=disability-adjusted life years; AAPC=average annual percentage change; CI=confidence interval; UI=uncertainty interval.
    * P<0.05.

    Table 1.  The prevalence, deaths, and DALYs due to hypertension-related CKD in China, 2010–2019.

    The three PLADs with the highest age-standardized prevalence rates (ASPRs) of hypertension-associated CKD were Hunan (363.54/105), Hebei (348.94/105), and Jilin (325.56/105), respectively. Conversely, Beijing (220.02/105), Shanghai (242.35/105), and Henan (251.12/105) exhibited the lowest ASPRs. The age-standardized mortality rates (ASMRs) were highest in Hunan (8.42/105), Xizang (Tibet) (7.95/105), and Yunnan (6.85/105), and lowest in Shandong (2.28/105), Beijing (2.39/105), and Jiangsu (2.41/105). The three PLADs with the highest age-standardized DALY rates (ASDRs) were Xizang (171.42/105), Hunan (163.42/105), and Qinghai (141.17/105). In contrast, Beijing (55.27/105), Jiangsu (56.45/105), and Shandong (57.46/105) had the lowest ASDRs, as shown in Table 2.

    PLADsPrevalence (95% UI)Deaths (95% UI)DALYs (95% UI)
    N (1,000)R' (1/100,000)N (1,000)R' (1/100,000)N (1,000)R' (1/100,000)
    Anhui250.77
    (224.62, 281.31)
    291.24
    (260.11, 329.24)
    2.42
    (1.85, 3.11)
    2.94
    (2.27, 3.74)
    61.39
    (48.80, 75.54)
    69.47
    (55.78, 85.33)
    Beijing70.40
    (64.46, 77.09)
    220.02
    (201.89, 240.42)
    0.72
    (0.56, 0.89)
    2.39
    (1.88, 2.96)
    18.27
    (14.63, 22.49)
    55.27
    (44.63, 67.37)
    Chongqing126.29
    (112.66, 140.94)
    318.79
    (283.15, 358.98)
    1.82
    (1.38, 2.33)
    4.68
    (3.57, 5.91)
    39.65
    (31.02, 49.48)
    97.33
    (77.20, 121.29)
    Fujian148.85
    (133.41, 167.84)
    307.62
    (275.37, 346.82)
    1.57
    (1.24, 1.96)
    3.56
    (2.84, 4.42)
    38.25
    (30.97, 46.14)
    77.40
    (63.14, 92.91)
    Gansu92.92
    (82.61, 105.43)
    294.52
    (262.64, 333.08)
    1.40
    (1.10, 1.75)
    5.29
    (4.21, 6.51)
    32.22
    (25.53, 39.47)
    101.10
    (81.73, 122.03)
    Guangdong375.88
    (336.53, 421.30)
    290.79
    (262.13, 322.75)
    3.93
    (3.10, 4.88)
    3.37
    (2.67, 4.18)
    99.97
    (80.95, 122.84)
    75.83
    (62.02, 92.67)
    Guangxi184.60
    (166.07, 205.76)
    317.65
    (285.62, 356.74)
    3.37
    (2.57, 4.36)
    6.07
    (4.70, 7.77)
    77.57
    (59.76, 99.21)
    128.89
    (100.40, 163.71)
    Guizhou124.02
    (110.96, 138.34)
    303.79
    (271.52, 339.71)
    2.39
    (1.83, 3.02)
    6.48
    (4.99, 8.05)
    53.91
    (41.95, 67.54)
    128.90
    (100.33, 159.07)
    Hainan31.83
    (28.42, 36.05)
    299.02
    (267.68, 336.60)
    0.44
    (0.34, 0.56)
    4.66
    (3.59, 5.79)
    10.63
    (8.35, 13.26)
    97.47
    (77.67, 120.25)
    Hebei329.49
    (288.33, 379.53)
    348.94
    (305.18, 404.12)
    3.95
    (3.06, 4.97)
    4.93
    (3.85, 6.11)
    96.65
    (76.91, 120.03)
    101.11
    (81.83, 123.31)
    Heilongjiang161.96
    (144.29, 181.89)
    295.51
    (264.41, 333.86)
    1.44
    (1.11, 1.83)
    2.95
    (2.32, 3.67)
    42.00
    (33.41, 52.73)
    72.08
    (58.81, 88.88)
    Henan293.45
    (257.88, 333.06)
    251.12
    (221.34, 286.57)
    3.50
    (2.71, 4.47)
    3.24
    (2.52, 4.11)
    88.02
    (69.84, 109.04)
    72.85
    (58.26, 89.00)
    Hong Kong SAR47.22
    (43.02, 51.71)
    325.31
    (293.83, 361.18)
    0.78
    (0.56, 1.05)
    4.71
    (3.33, 6.32)
    13.27
    (10.02, 17.13)
    91.13
    (69.08, 117.21)
    Hubei255.28
    (228.11, 287.46)
    321.39
    (288.39, 362.21)
    3.75
    (2.92, 4.80)
    5.19
    (4.06, 6.53)
    85.76
    (67.87, 106.74)
    104.52
    (83.93, 128.31)
    Hunan334.70
    (298.57, 373.80)
    363.54
    (323.45, 409.03)
    7.20
    (5.52, 8.99)
    8.42
    (6.52, 10.37)
    154.41
    (120.05, 191.20)
    163.42
    (128.13, 201.46)
    Inner Mongolia98.78
    (88.05, 111.65)
    305.21
    (271.72, 345.93)
    1.03
    (0.81, 1.29)
    3.79
    (2.99, 4.66)
    27.49
    (22.27, 34.04)
    81.78
    (67.00, 99.41)
    Jiangsu351.76
    (312.67, 394.35)
    271.57
    (240.86, 307.33)
    3.06
    (2.34, 3.99)
    2.41
    (1.84, 3.12)
    73.61
    (58.69, 91.47)
    56.45
    (45.27, 69.71)
    Jiangxi171.05
    (151.24, 191.10)
    316.45
    (281.12, 353.50)
    2.86
    (2.22, 3.56)
    6.01
    (4.72, 7.40)
    62.47
    (50.11, 75.47)
    113.88
    (92.63, 137.32)
    Jilin128.26
    (114.20, 143.41)
    325.56
    (288.88, 364.07)
    1.42
    (1.17, 1.75)
    3.97
    (3.31, 4.75)
    38.18
    (30.99, 47.10)
    91.71
    (75.62, 110.21)
    Liaoning225.02
    (201.51, 253.29)
    317.56
    (283.41, 359.92)
    2.16
    (1.67, 2.80)
    3.19
    (2.48, 4.06)
    57.52
    (45.30, 71.78)
    77.63
    (62.22, 95.40)
    Macao SAR2.77
    (2.46, 3.14)
    305.78
    (271.86, 346.79)
    0.02
    (0.02, 0.03)
    2.74
    (2.00, 3.66)
    0.61
    (0.47, 0.78)
    65.73
    (50.57, 83.18)
    Ningxia20.71
    (18.33, 23.35)
    296.09
    (264.50, 328.79)
    0.23
    (0.17, 0.30)
    3.96
    (3.05, 5.02)
    6.27
    (4.84, 7.91)
    85.62
    (68.20, 106.90)
    Qinghai18.38
    (16.28, 20.89)
    302.02
    (270.14, 340.67)
    0.34
    (0.26, 0.42)
    6.80
    (5.37, 8.30)
    8.98
    (7.07, 11.27)
    141.17
    (113.29, 172.84)
    Shaanxi153.68
    (137.59, 171.98)
    308.47
    (276.27, 346.28)
    2.04
    (1.52, 2.60)
    4.64
    (3.55, 5.84)
    50.55
    (39.20, 63.59)
    98.02
    (77.23, 121.55)
    Shandong417.17
    (375.61, 462.47)
    289.92
    (261.04, 325.41)
    3.13
    (2.43, 4.00)
    2.28
    (1.79, 2.88)
    84.71
    (67.77, 104.96)
    57.46
    (46.39, 70.22)
    Shanghai100.23
    (91.13, 110.46)
    242.35
    (219.59, 267.90)
    1.11
    (0.85, 1.38)
    2.74
    (2.09, 3.39)
    24.74
    (19.75, 29.98)
    58.86
    (47.20, 71.45)
    Shanxi136.79
    (122.42, 154.86)
    305.28
    (273.04, 343.62)
    1.52
    (1.14, 1.92)
    3.97
    (3.03, 4.90)
    38.88
    (30.07, 48.72)
    84.07
    (65.66, 103.98)
    Sichuan344.44
    (305.25, 387.89)
    284.79
    (251.15, 323.06)
    5.17
    (3.91, 6.56)
    4.49
    (3.50, 5.58)
    121.77
    (95.94, 149.89)
    96.43
    (77.13, 117.41)
    Tianjin60.97
    (54.39, 69.38)
    299.01
    (266.54, 340.00)
    0.48
    (0.36, 0.62)
    2.54
    (1.95, 3.28)
    13.87
    (11.01, 17.27)
    64.81
    (52.27, 80.08)
    Xizang7.07
    (6.12, 8.28)
    259.04
    (229.46, 292.24)
    0.17
    (0.13, 0.22)
    7.95
    (6.32, 9.95)
    4.82
    (3.81, 6.12)
    171.42
    (137.34, 213.09)
    Xinjiang72.39
    (64.48, 82.81)
    307.37
    (277.16, 347.93)
    1.22
    (0.95, 1.55)
    6.41
    (4.99, 8.09)
    32.53
    (25.63, 40.48)
    133.03
    (106.18, 164.92)
    Yunnan161.26
    (143.21, 182.01)
    307.25
    (273.68, 346.74)
    3.14
    (2.48, 3.88)
    6.85
    (5.50, 8.38)
    74.96
    (60.30, 92.15)
    138.39
    (112.61, 168.16)
    Zhejiang278.98
    (248.46, 311.14)
    324.35
    (287.47, 364.77)
    2.45
    (1.91, 3.05)
    3.02
    (2.34, 3.72)
    58.23
    (46.88, 70.09)
    67.24
    (54.73, 80.53)
    Total5,577.33
    (5,161.60, 6,034.39)
    300.76
    (278.72, 325.76)
    70.26
    (56.87, 84.48)
    4.09
    (3.32, 4.88)
    1,692.13
    (1,393.41, 2,014.21)
    88.48
    (73.38, 104.46)
    Note: N: number of cases; R': age-standardized rate calculated using the 2010 National Census as the standard population. Data for Taiwan, China were not included.
    Abbreviation: DALYs=disability-adjusted life years; UI=uncertainty interval; PLAD=provincial-level administrative division; SAR=Special Administrative Region.

    Table 2.  Distribution of disease burden of hypertension-related CKD by PLAD, 2019.

    The ASPR of hypertension−induced CKD showed no significant change over the period from 2010 (299.83/105) to 2019 (300.76/105), with an AAPC of 0.04% [95% confidence interval (CI): −0.09%, 0.16%, P=0.57]. The ASPR increased from 2010 to 2017 (311.89/105) with an annual percentage change (APC) of 0.59% (95% CI: 0.50%, 0.68%; P<0.001), followed by a decrease from 2017 to 2019 with an APC=−1.88% (95% CI: −2.53%, −1.23%; P<0.001). The ASMR and age−standardized DALY rate also showed declining trends, with AAPCs of −1.06% (95% CI: −1.29%, −0.83%; P<0.001) and −1.12% (95% CI: −1.63%, −0.62%; P<0.001), respectively. The ASMR decreased from 4.45/105 in 2010 to 4.09/105 in 2019, and the ASDR decreased from 98.74/105 in 2010 to 88.48/105 in 2019 (Figure 1).
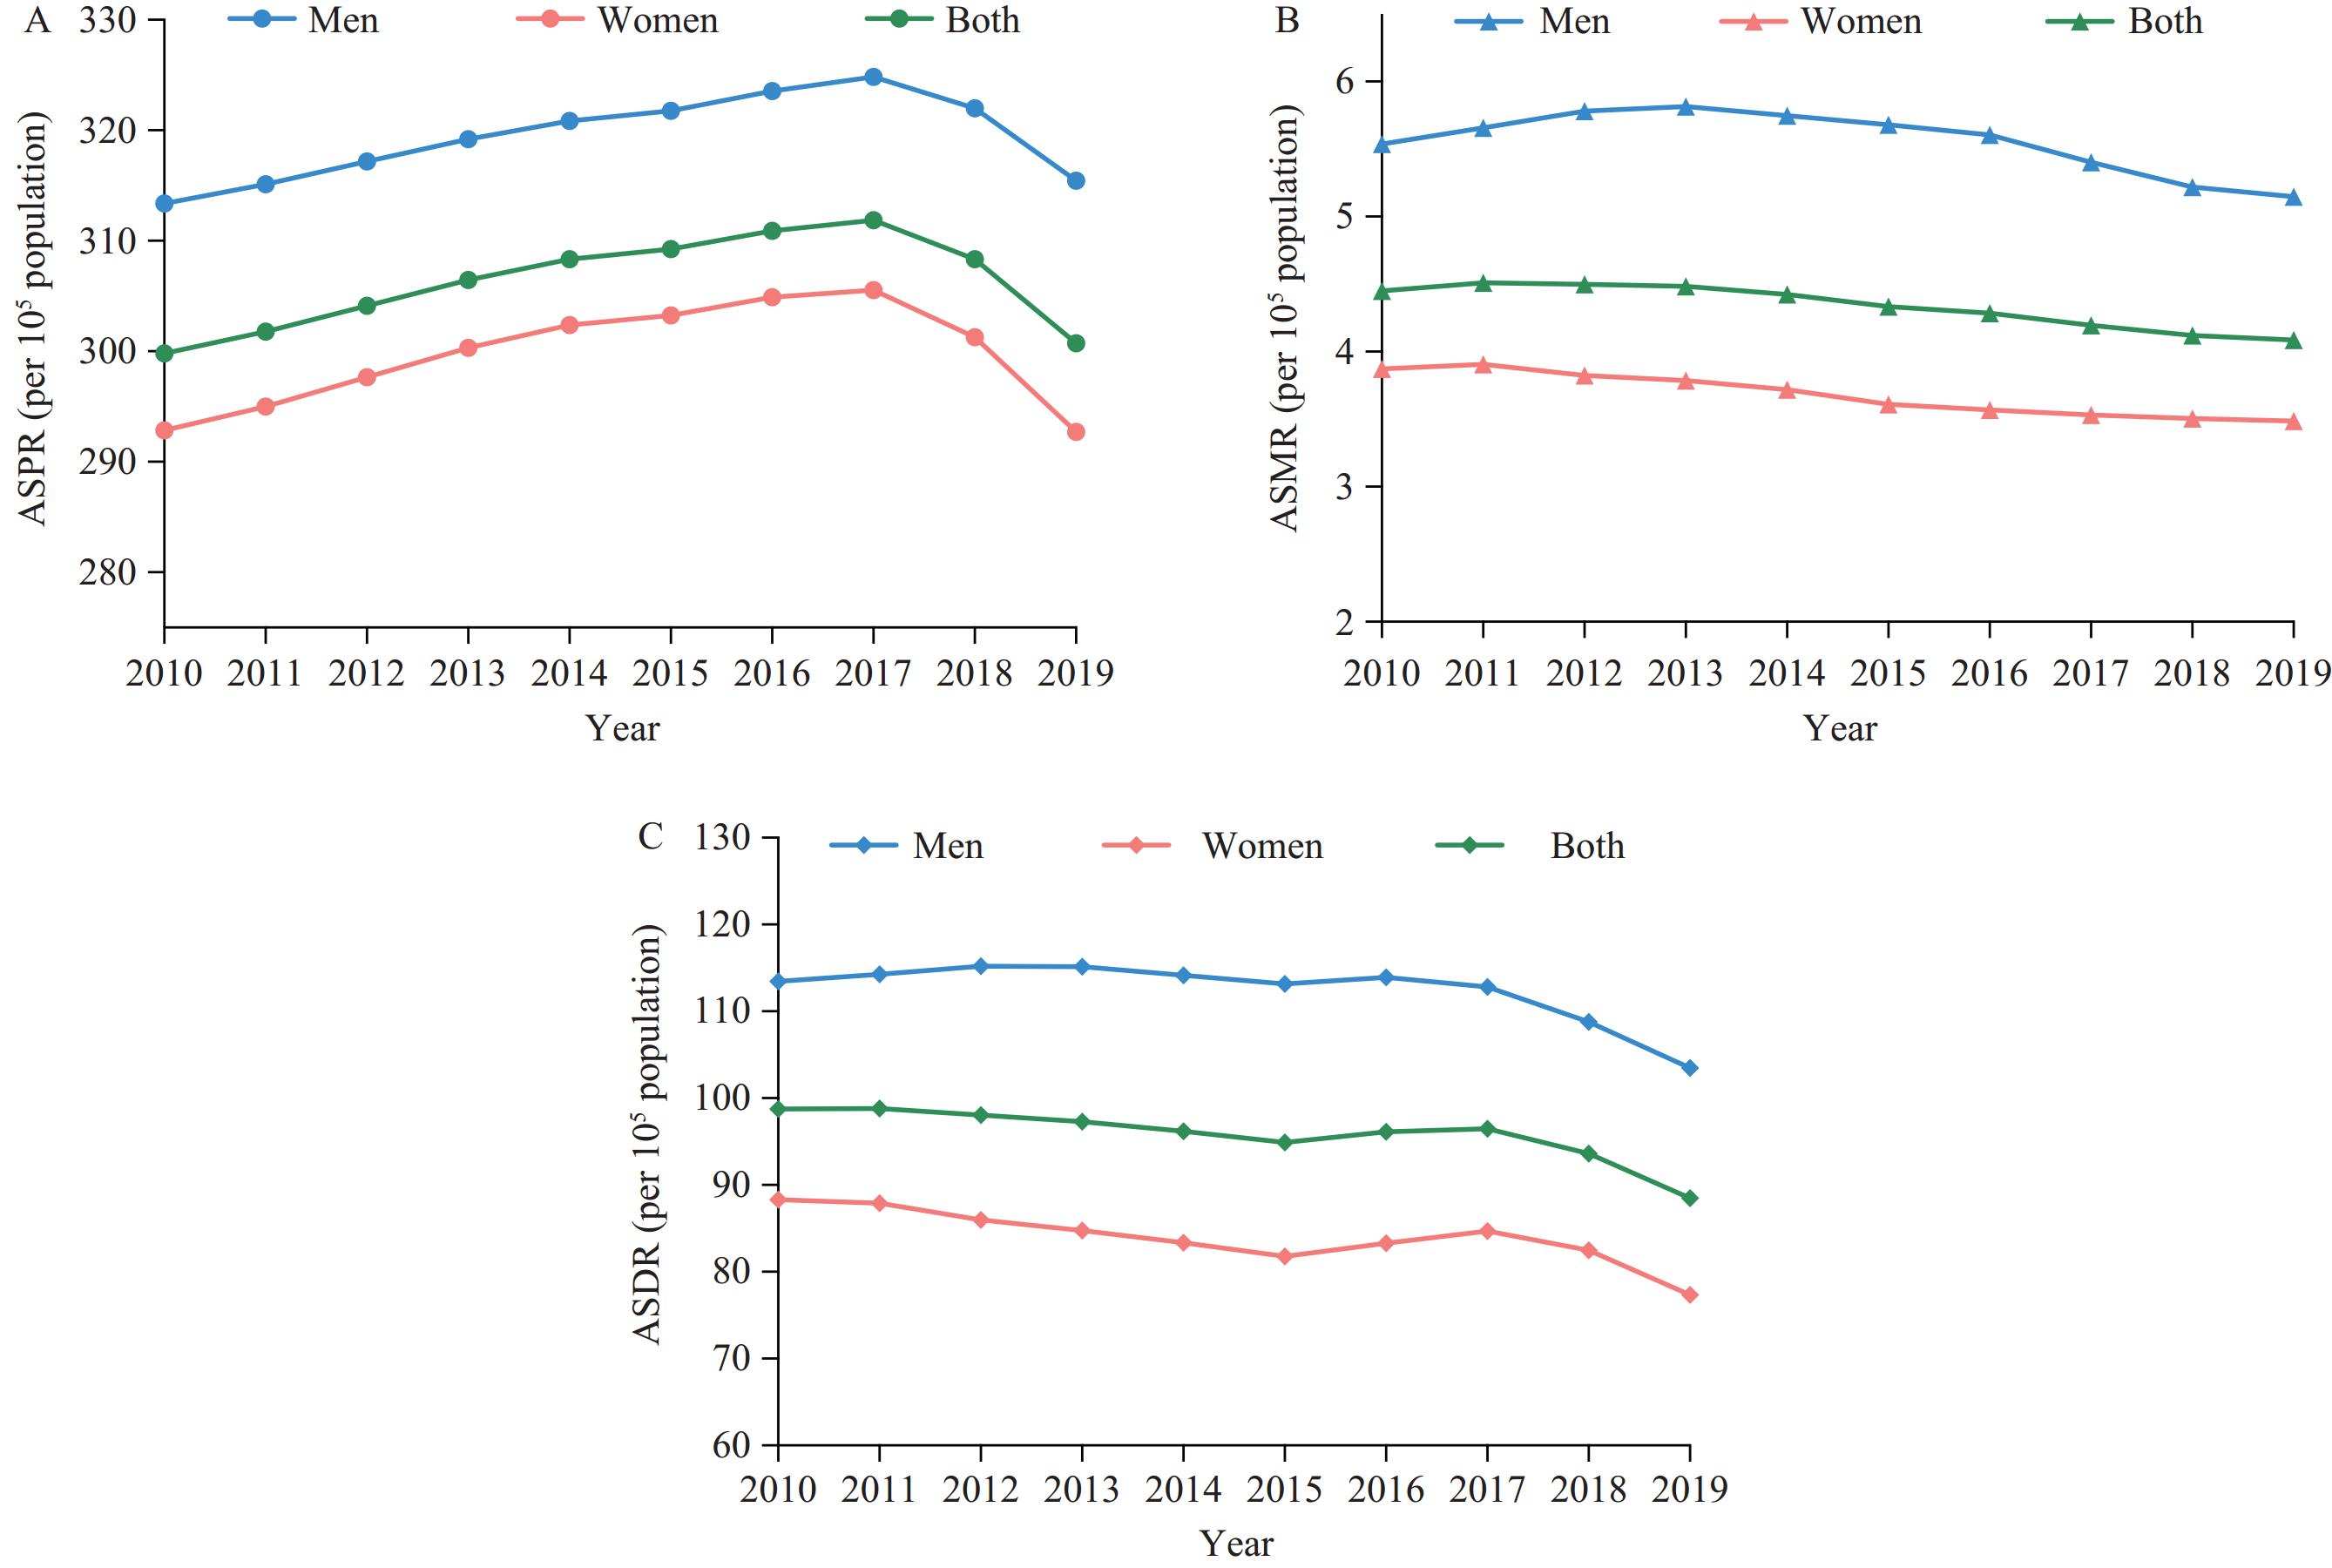
    Figure 1. 

    Trends of disease burden of hypertension-related chronic kidney disease by gender, 2010–2019. (A) ASPR; (B) ASMR; (C) ASDR.

    Note: Data for Taiwan, China were not included.

    Abbreviation: ASPR=age-standardized prevalence rate; ASMR=age-standardized mortality rate; ASDR=age-standardized DALY rate.

    • This study conducted an analysis of the burden of hypertension-related CKD in China using the GBD 2019 database. Our findings revealed a greater burden among males, the elderly population, and in the western region of China. Notably, from 2010 to 2019, there was no significant change in ASPR and both ASMR and ASDR showed a declining trend. Despite this, there was an increase in the number of cases, deaths, and DALYs, indicating a high burden of CKD attributed to hypertension in China.

      Gender disparities in the disease burden may be attributed to gender-based differences in the prevalence of advanced CKD, with men showing a higher prevalence of stage 4 (1.1‰ vs. 0.9‰) and stage 5 (0.5‰ vs. 0.4‰) CKD (5). Given that older individuals typically experience a greater disease burden, it is plausible that advanced age correlates significantly with a higher prevalence of hypertension and the development and progression of CKD. Zhang et al. (6) observed an age-related increase in hypertension prevalence (<60% among younger age groups, 65.2% among individuals aged 70–80 years, and 66.7% among those aged ≥80 years). Moreover, Wang et al. (5) reported a progressive rise in the risk of CKD and renal impairment across age groups of 30–39, 40–49, 50–59, 60–69, and ≥70 years compared to the 18–29 years age group, with individuals aged ≥70 years being 4.75 and 329 times more likely to develop the conditions than those aged 18–29 years, respectively.

      This study unveiled that in Hunan, CKD attributed to hypertension had the highest burden, with the highest ASPR and ASMR, and the second-highest ASDR. A previous national burden-of-disease study reported that in terms of CKD-related YLLs, Hunan ranked second overall, underscoring the substantial burden of CKD in this province (7). Limited research exists on the disease burden of hypertension-related CKD in Hunan, warranting further exploration into the specific factors contributing to this elevated burden. Across other provinces, the ASPR did not exhibit notable clustering, while the ASMR and ASDR were elevated in the West and lower in the East, potentially linked to the unequal distribution of healthcare resources between these regions in China (8).

      From 2010 to 2019, there was an increase in the number of cases of CKD related to hypertension, as well as an uptick in related deaths and DALYs. These trends are likely influenced by population growth and aging. Although the ASPR remained relatively stable, there was a noticeable rise from 2010 to 2017. This increase may be attributed to the evolving epidemiological landscape of hypertension itself, seeing as the prevalence of hypertension escalated from 23.2% in 2012–2015 to 27.5% in 2018 (6). The subsequent decline from 2017 to 2019 may be linked to various factors, including the implementation of the Healthy China 2030 initiative and the enactment of China's Medium-to-Long-Term Plan for the Prevention and Treatment of Chronic Diseases (2017–2025). These strategic plans focus on improving air quality, promoting physical activity, reducing salt consumption, and curbing smoking rates, all of which can positively impact CKD prevention. Furthermore, the ASMR and ASDR exhibited a downward trajectory. This decline may be associated with advancements in socioeconomic conditions, the incorporation of CKD surveillance into chronic disease and risk factor monitoring, and enhanced hypertension management within the CKD population. Notably, the Chinese Cohort Study of CKD documented an increase in hypertension control rates among CKD patients, rising from 41.1% in 2013 to 61.7% in 2016 (9).

      No studies have been published on the disease burden of hypertension-related CKD in China. In 2019, the global ASPR was 397.32/105, the ASMR was 5.88/105, and the ASDR was 123.41/105, all of which were lower in China. Despite lower rates, the significant population size led to 70,260 deaths attributed to hypertension-related CKD in China in 2019, ranking it the highest globally. Globally, reported ASPR, ASMR, and ASDR have increased from 1990 to 2019 (10). Interestingly, China has shown better management of the disease burden in recent years.

      This study is subject to some limitations. First, the GBD 2019 database offered estimates of disease burden rather than actual observations, resulting in discrepancies with real-world scenarios. Second, the etiology of CKD is intricate, and the underlying causes remain uncertain.

      In conclusion, hypertension stands as a prominent contributor to the burden of CKD in China, with a persistently high prevalence. Implementing strategies to enhance CKD awareness, conducting early screenings among hypertensive individuals and the elderly, and equitably distributing healthcare resources across Eastern and Western regions of China are vital steps toward mitigating the CKD burden attributed to hypertension.

    • No conflicts of interest.

    • The GBD 2019 team.

Reference (10)

Citation:

Catalog

    /

    DownLoad:  Full-Size Img  PowerPoint
    Return
    Return