

 Download:


-
The global phenomenon of rapid population aging, coupled with the growing health burden among older adults, highlights the importance of investigating the long-term effects of early life stages on the aging process (1). Previous research in the fields of economics and epidemiology has consistently shown that childhood circumstances have a significant impact on later-life health outcomes. This suggests that childhood is a crucial period for implementing interventions aimed at reducing health disparities (2). These circumstances encompass a wide range of factors, including parental influences (3), family socioeconomic status (SES) (4), as well as community and environmental factors such as rural/urban status (5) and natural surroundings (6).
Both early-life and later-life factors contribute to health outcomes in older age. However, childhood circumstances, particularly those that are beyond an individual’s control, are considered to be the most unacceptable and illegitimate sources of health inequality in older age (7–8). This type of inequality, attributed to childhood circumstances, is commonly referred to as inequality of opportunity (IOP). The focus on reducing IOP arises from a wide-ranging political and social discussion aimed at creating equal opportunities during the early stages of life and addressing the unfair health inequalities identified by the World Health Organization Commission on Social Determinants of Health (9).
Despite the considerable amount of research conducted on the impact of childhood circumstances on health outcomes, there are still methodological challenges that need to be addressed. These challenges include the arbitrary selection of childhood circumstances and potential biases in estimating health inequality among older adults (10–11). In our study, we aimed to overcome these challenges by utilizing machine learning techniques to identify the most relevant set of childhood circumstances. By adopting this approach, we allowed the data to inform our understanding of unequal childhood circumstances, thus minimizing the influence of researcher bias on the model specification (10–12). Furthermore, we compared our findings to those obtained using the conventional parametric Roemer method in order to highlight the significant improvements our approach offers in measuring inequality throughout an individual’s life.
-
Our study utilized data from the health and retirement study (HRS) in the US and the China Health and Retirement Longitudinal Study (CHARLS) in China. We analyzed 2020–2021 wave of HRS and the 2020 wave of CHARLS, both of which matched with life history surveys. The final sample consisted of 2,434 Americans and 5,612 Chinese individuals aged 60 and above. Self-rated health (SRH) was used as the health outcome measure, assessed on a scale from excellent (=1) to poor (=5) in both surveys. The analysis included data on 43 childhood circumstances from HRS and 36 from CHARLS, categorized into seven domains such as birth environment, family SES, and childhood relationships (
Supplementary Tables S1 andS2 ). While there were slight variations, the domains predominantly included the same core measures for both countries. The analysis was conducted using R (version 4.3.1; R Core Team, Vienna, Austria).Supplementary Material provides a comprehensive conceptual and analytic framework for this study. Initially, we used the Roemer method with Shapley value decomposition to estimate the individual and collective impact of childhood circumstances on health inequality in later life. This framework serves as a foundation for evaluating policy interventions. By partitioning the population into distinct, non-overlapping groups based on observable circumstances, such as parental education (high vs. low) and financial hardship (yes vs. no), we can derive a counterfactual distribution of health outcomes. The disparity in health across these groups can be solely attributed to differences in childhood circumstances, which we refer to as the IOP. In our study, we quantified the contribution of childhood circumstances to health inequality using the Gini coefficient (8,11). We also calculated the IOP by dividing this measure of absolute health inequality by the overall health inequality, representing the proportion of health inequality explained by childhood circumstances. While not establishing causality, this analysis provides valuable insights into the statistical significance of childhood circumstances (13).Conditional inference trees are particularly advantageous for analyzing the impact of childhood circumstances on IOP. They allow for sequential hypothesis tests and provide a visual representation for comparing different childhood circumstances. Each test examines IOP within a specific subset of the population, and the depth of the tree reflects the diversity of childhood circumstances within a society. Additionally, these trees address the issue of arbitrary variable and model selection that often arises in the IOP literature. They consider a comprehensive set of observed variables that qualify as childhood circumstances. In our study, we used these childhood circumstances to divide the population into distinct groups (terminal nodes) in the context of regression trees. We calculated the predicted outcome value for an individual observation as the average outcome of the group to which the individual was assigned, taking into account the number of observations in that group. Furthermore, we used 5-fold cross-validation to optimize the model parameters. We found that our results are consistent regardless of the choice of K.
Conditional inference trees have advantages in providing non-arbitrary population segmentation. However, they have limitations such as using limited data, struggling with highly correlated childhood circumstances, and exhibiting high prediction variance, making them sensitive to sample changes. To address these limitations, random forest is employed to mitigate these issues. Random forest forms a forest of decision trees from bootstrapped samples, utilizing a random selection of predictors at each split to reduce prediction variance, resulting in a more reliable model. In this study, 200 trees were used based on considerations of computational cost-efficiency and prediction accuracy to predict outcomes (
Supplementary Figure S1 ). A 4-step method was applied, involving the random selection of half the observations in each tree, along with random data subsampling and subsets of circumstances, to determine optimal parameters through out-of-bag error minimization. Predictor importance for each childhood circumstance was evaluated using the residual sum of squares (RSS).To evaluate the potential biases in measuring IOP in healthy individuals that could impact the accuracy of predictions, we divided the dataset into a training set representing 2/3 of the total sample size (N) and a test set representing the remaining 1/3. The training set was used to train our model, while the test set was used to assess the performance of three different methods: the conventional parametric Roemer method, conditional inference trees, and conditional inference forest.
-
First, the Gini coefficient indicated that there was a higher level of inequality in self-rated health in the US compared to China. We then used the Gini coefficients to measure the IOP in the counterfactual distribution. Figure 1 illustrates that the conventional parametric Roemer method yielded the highest estimates of IOP, followed by the conditional inference forest method and the conditional inference tree method. Specifically, in China, IOP accounted for 22.67% (0.039 out of 0.172 total Gini coefficient) of the inequality in self-rated health, while in the US it accounted for 35.08% (0.067 out of 0.191 total Gini coefficient). In contrast, the conditional inference tree method accounted for 12.79% in China (0.022 out of 0.172 total Gini coefficient) and 23.04% in the US (0.044 out of 0.191 total Gini coefficient), while the forest method represented 20.35% in China (0.035 out of 0.172 total Gini coefficient) and 28.27% in the US (0.054 out of 0.191 total Gini coefficient).
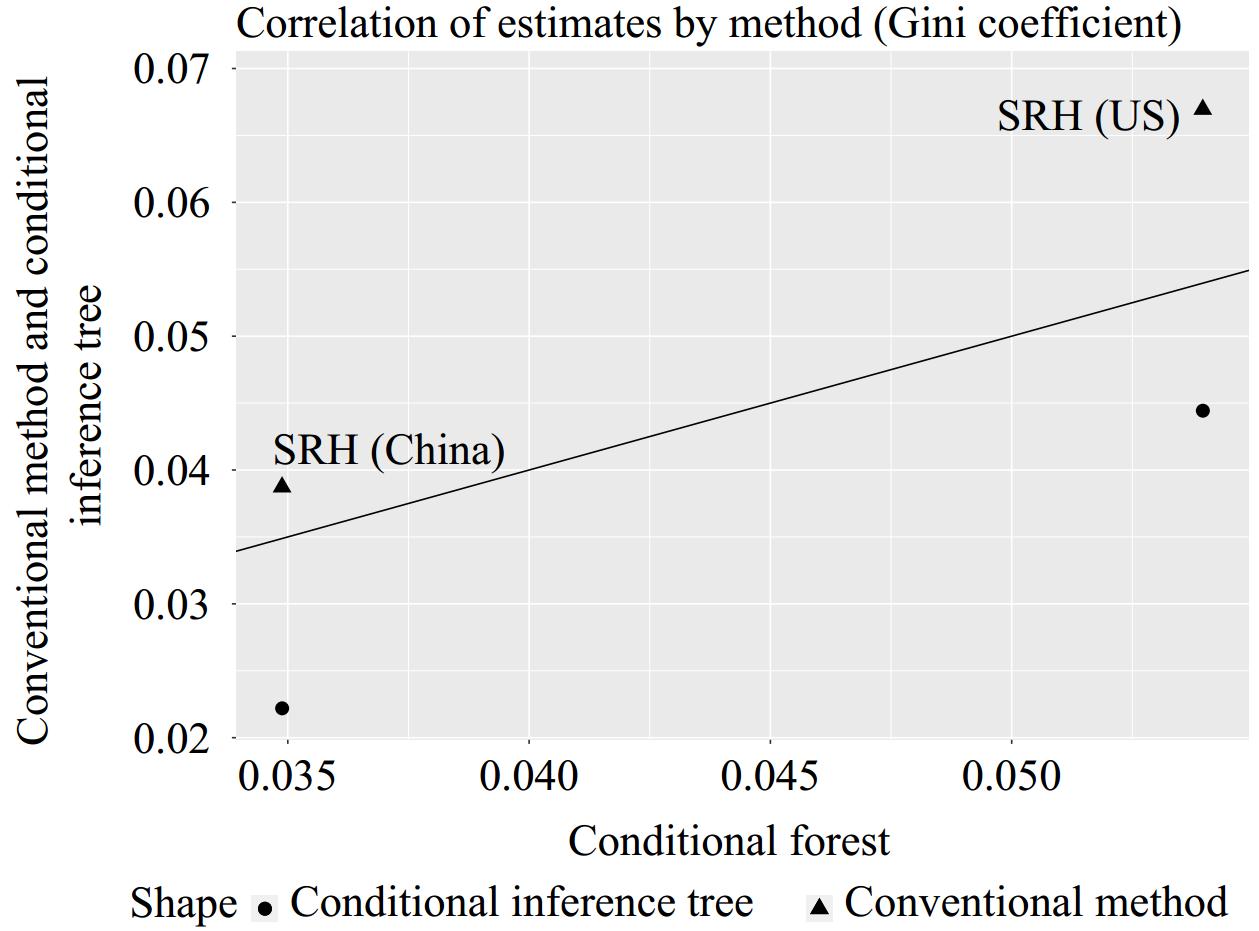 Figure 1.
Correlation of estimates by method.
Note: The plot shows the estimates using each method (i.e., the conventional parametric Roemer method and the conditional inference trees) against the estimates from conditional inference forest. The x-axis represents the scale of Gini coefficients for the forest method. The Gini coefficients range between 0 and 1. The larger the more unequal. The y-axis represents the scale of Gini coefficients for the Roemer method and tree methods. The black diagonal indicates the 45-degree line, on which all data points should align if the different methods were perfectly congruent. This plot confirms that the conventional parametric Roemer method delivers higher estimates than forest, while tree estimates are lower than those based on forest.
Abbreviation: SRH=self-rated health.
Figure 2A shows the structure of the IOP for self-rated health in China using a tree with five terminal nodes. The tree is formed by factors such as childhood health, birth region, and childhood family financial status. The most advantaged type (terminal node 5) includes people with good childhood health, good family financial status, and born in Eastern China. On the other hand, the group with the worst self-rated health (terminal node 6) typically had poorer child health. In the US, as depicted in Figure 2B, individuals with poor childhood health fell into the disadvantaged circumstance type (terminal nodes 7). In contrast, individuals with certain favorable conditions, such as having more books at home, being healthy in childhood, and being White, generally reported better health in old age (terminal node 6).
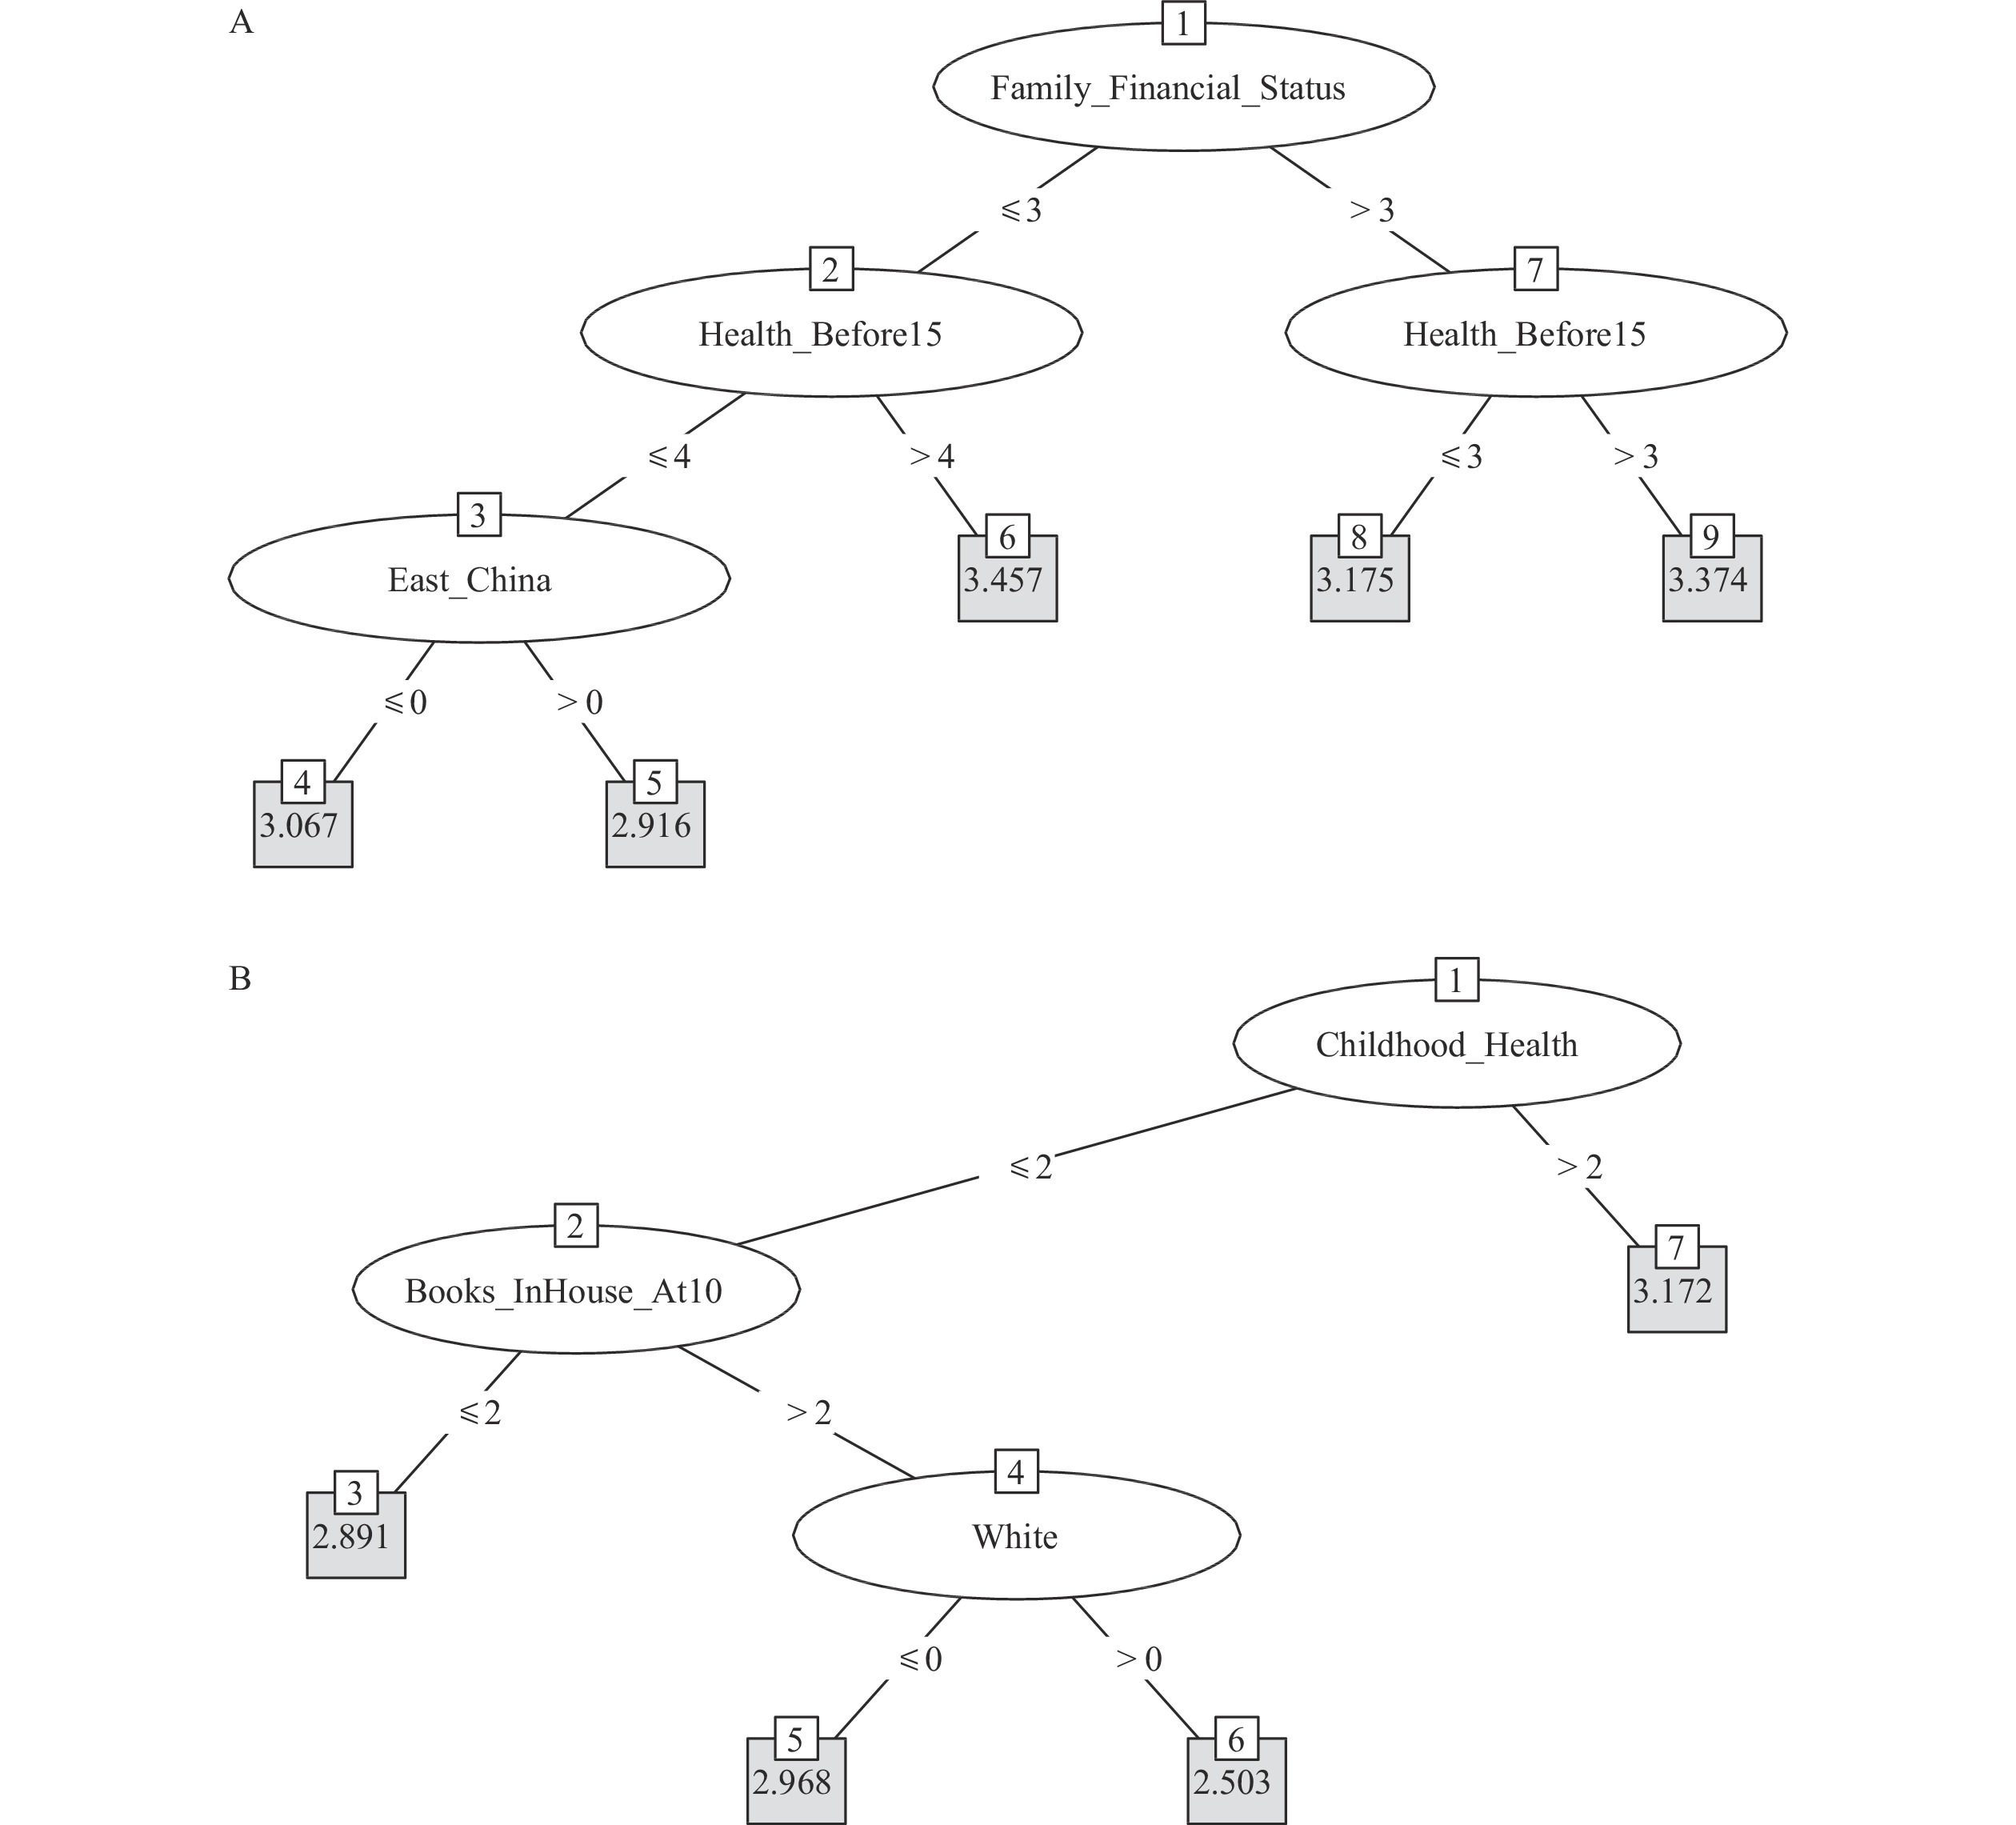 Figure 2.
Conditional inference tree for self-rated health. (A) China; (B) the US.
Figure 3A reveals that in China, using conditional inference forest, the key factors impacting self-rated health are childhood health and being born in the eastern China, which corroborates findings from the conditional inference trees (Figure 2A). Additionally, parents’ health status (staying in bed for a long time) and relationship with parents also have a high impact on self-rated health in older ages. Similarly, Figure 3B demonstrates that in the US, childhood health, number of books at home at age 10, and race/ethnicity are significant factors, which largely align with results obtained through conditional inference trees (Figure 2B).
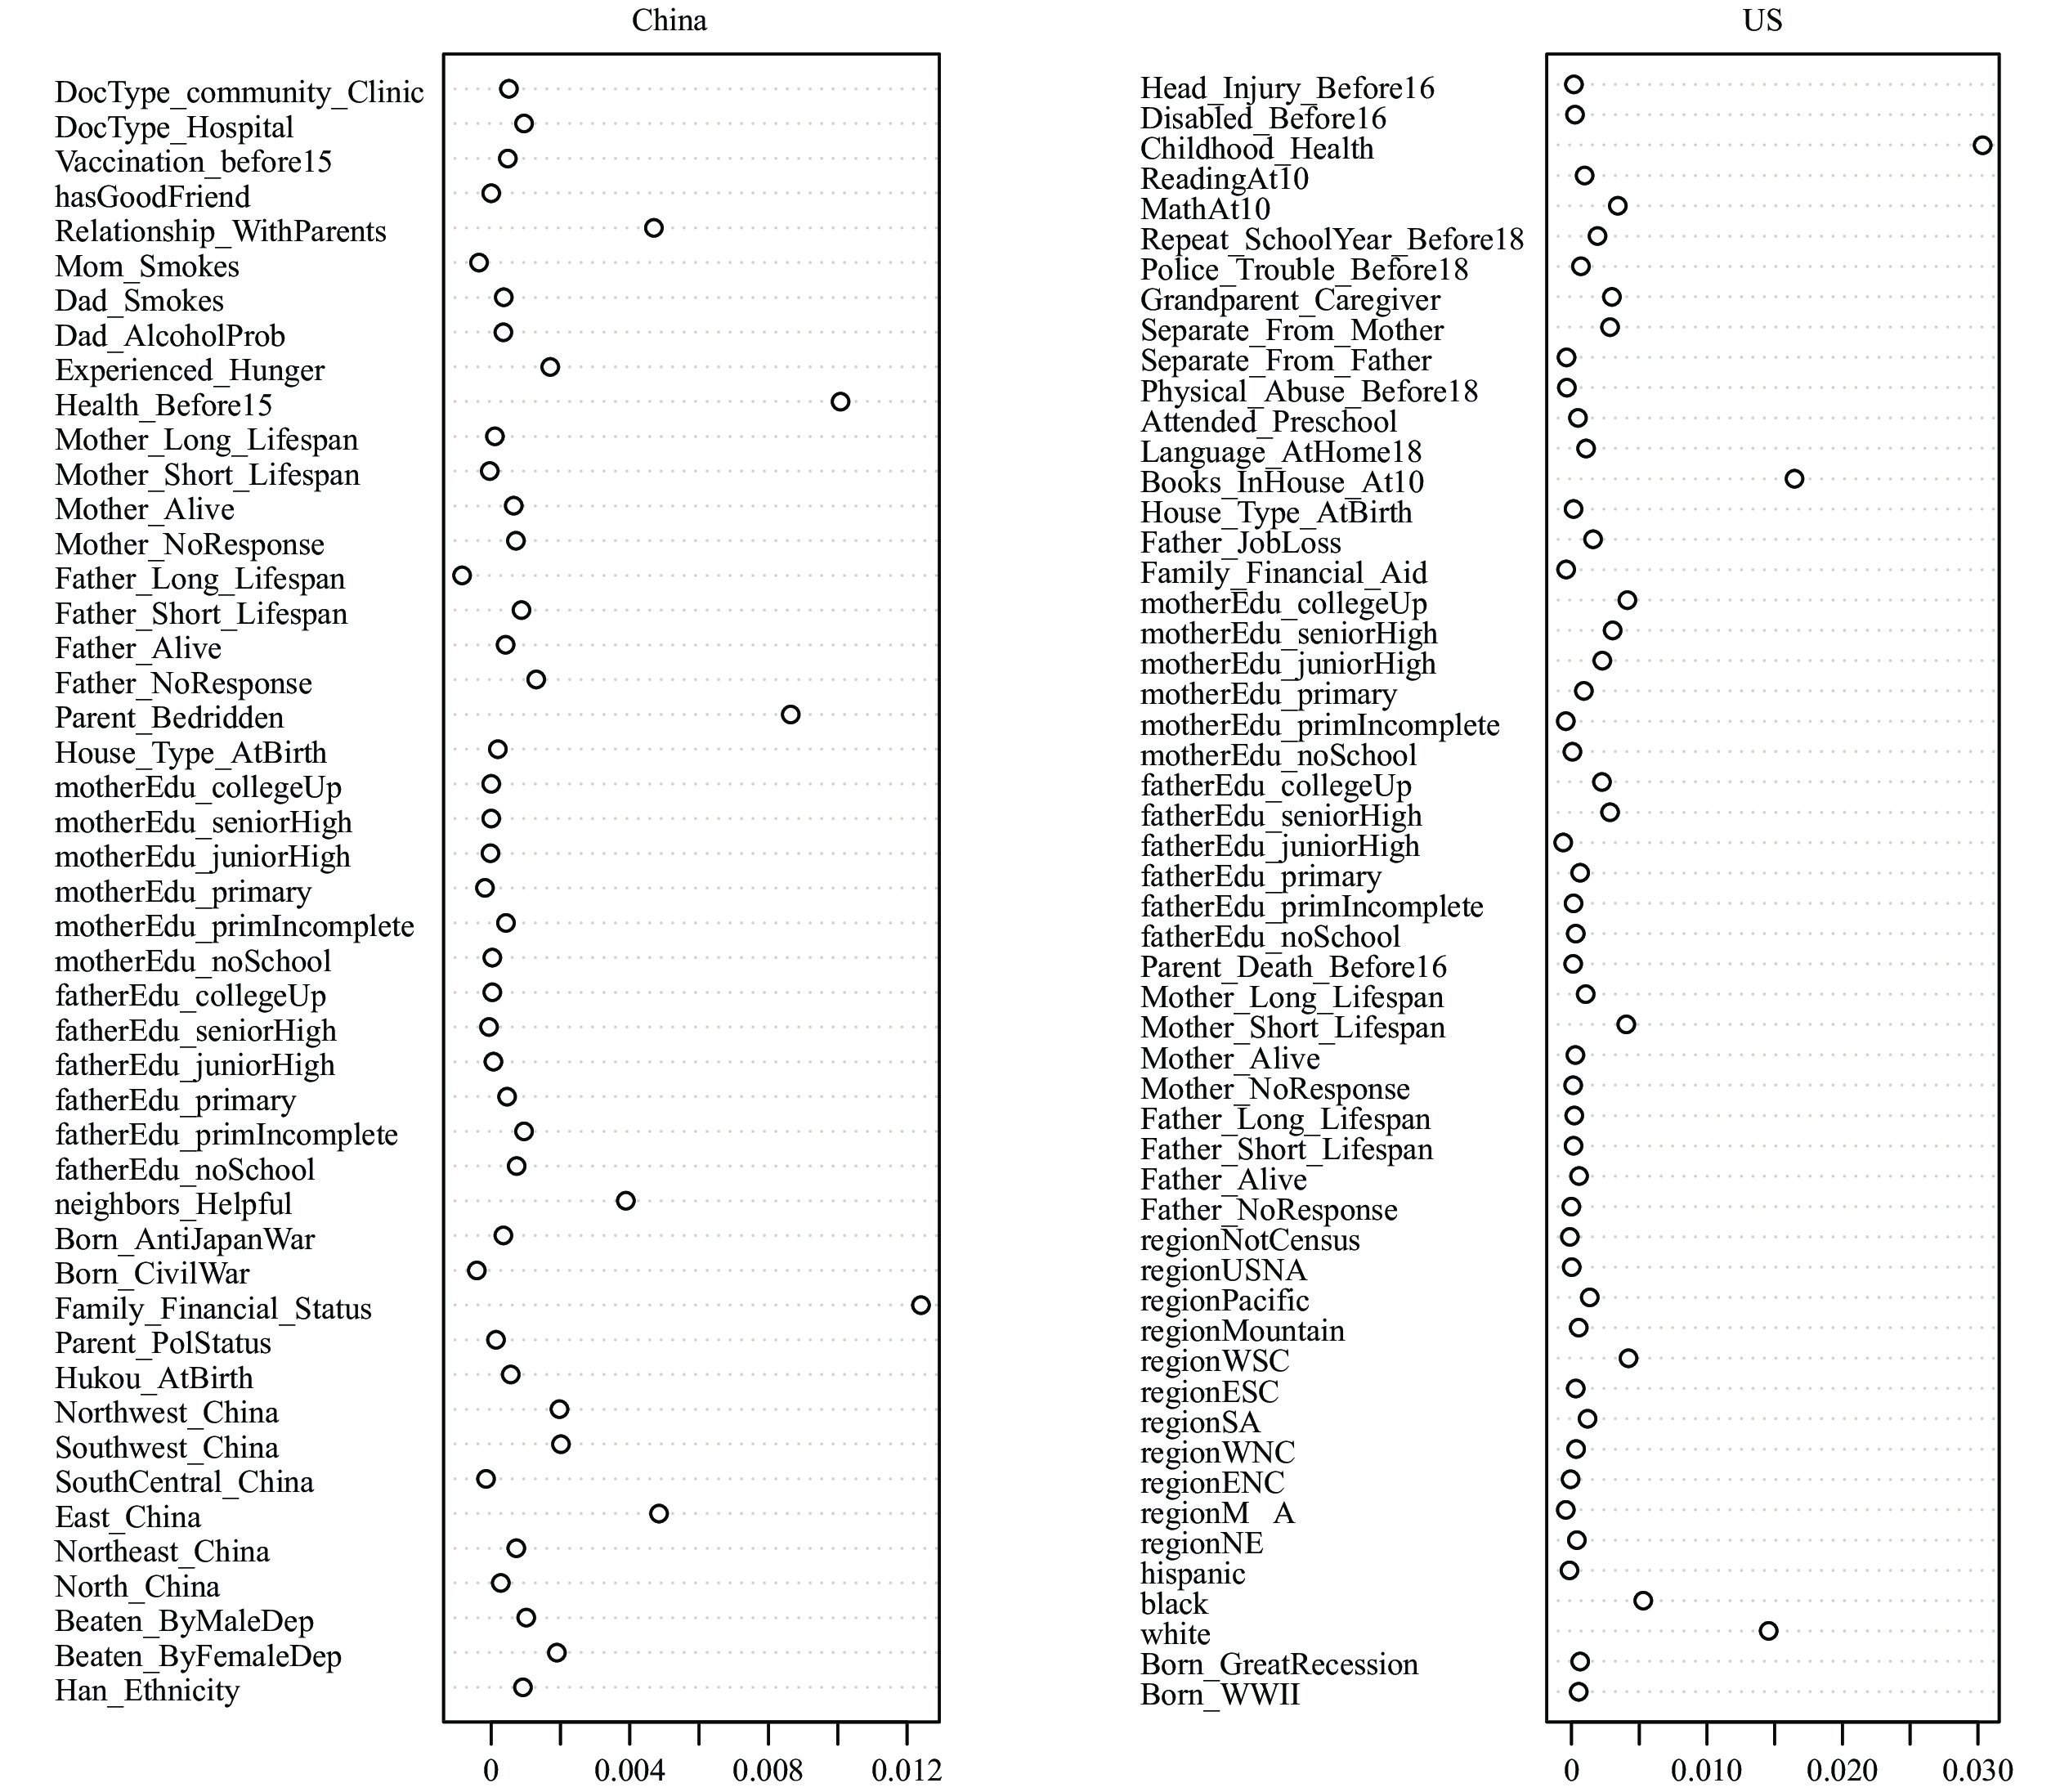 Figure 3.
Importance of childhood circumstances to self-rated health using conditional inference forest. (A) China; (B) the US.
As previously mentioned, all tested models were designed to minimize the mean squared error (MSE). We derived 95% confidence intervals using 200 bootstrap re-samplings of the test data. The MSE for the random forest model was standardized to a value of 1 to facilitate comparison of prediction performance across models. Therefore, an MSE greater than 1 indicated a poorer out-of-sample fit. In terms of self-rated health, both the conditional inference tree and parametric Roemer methods performed worse than the conditional inference forest, as shown in Figure 4A–
B . On average, the conditional inference trees demonstrated lower test error rates compared to the conventional parametric Roemer method.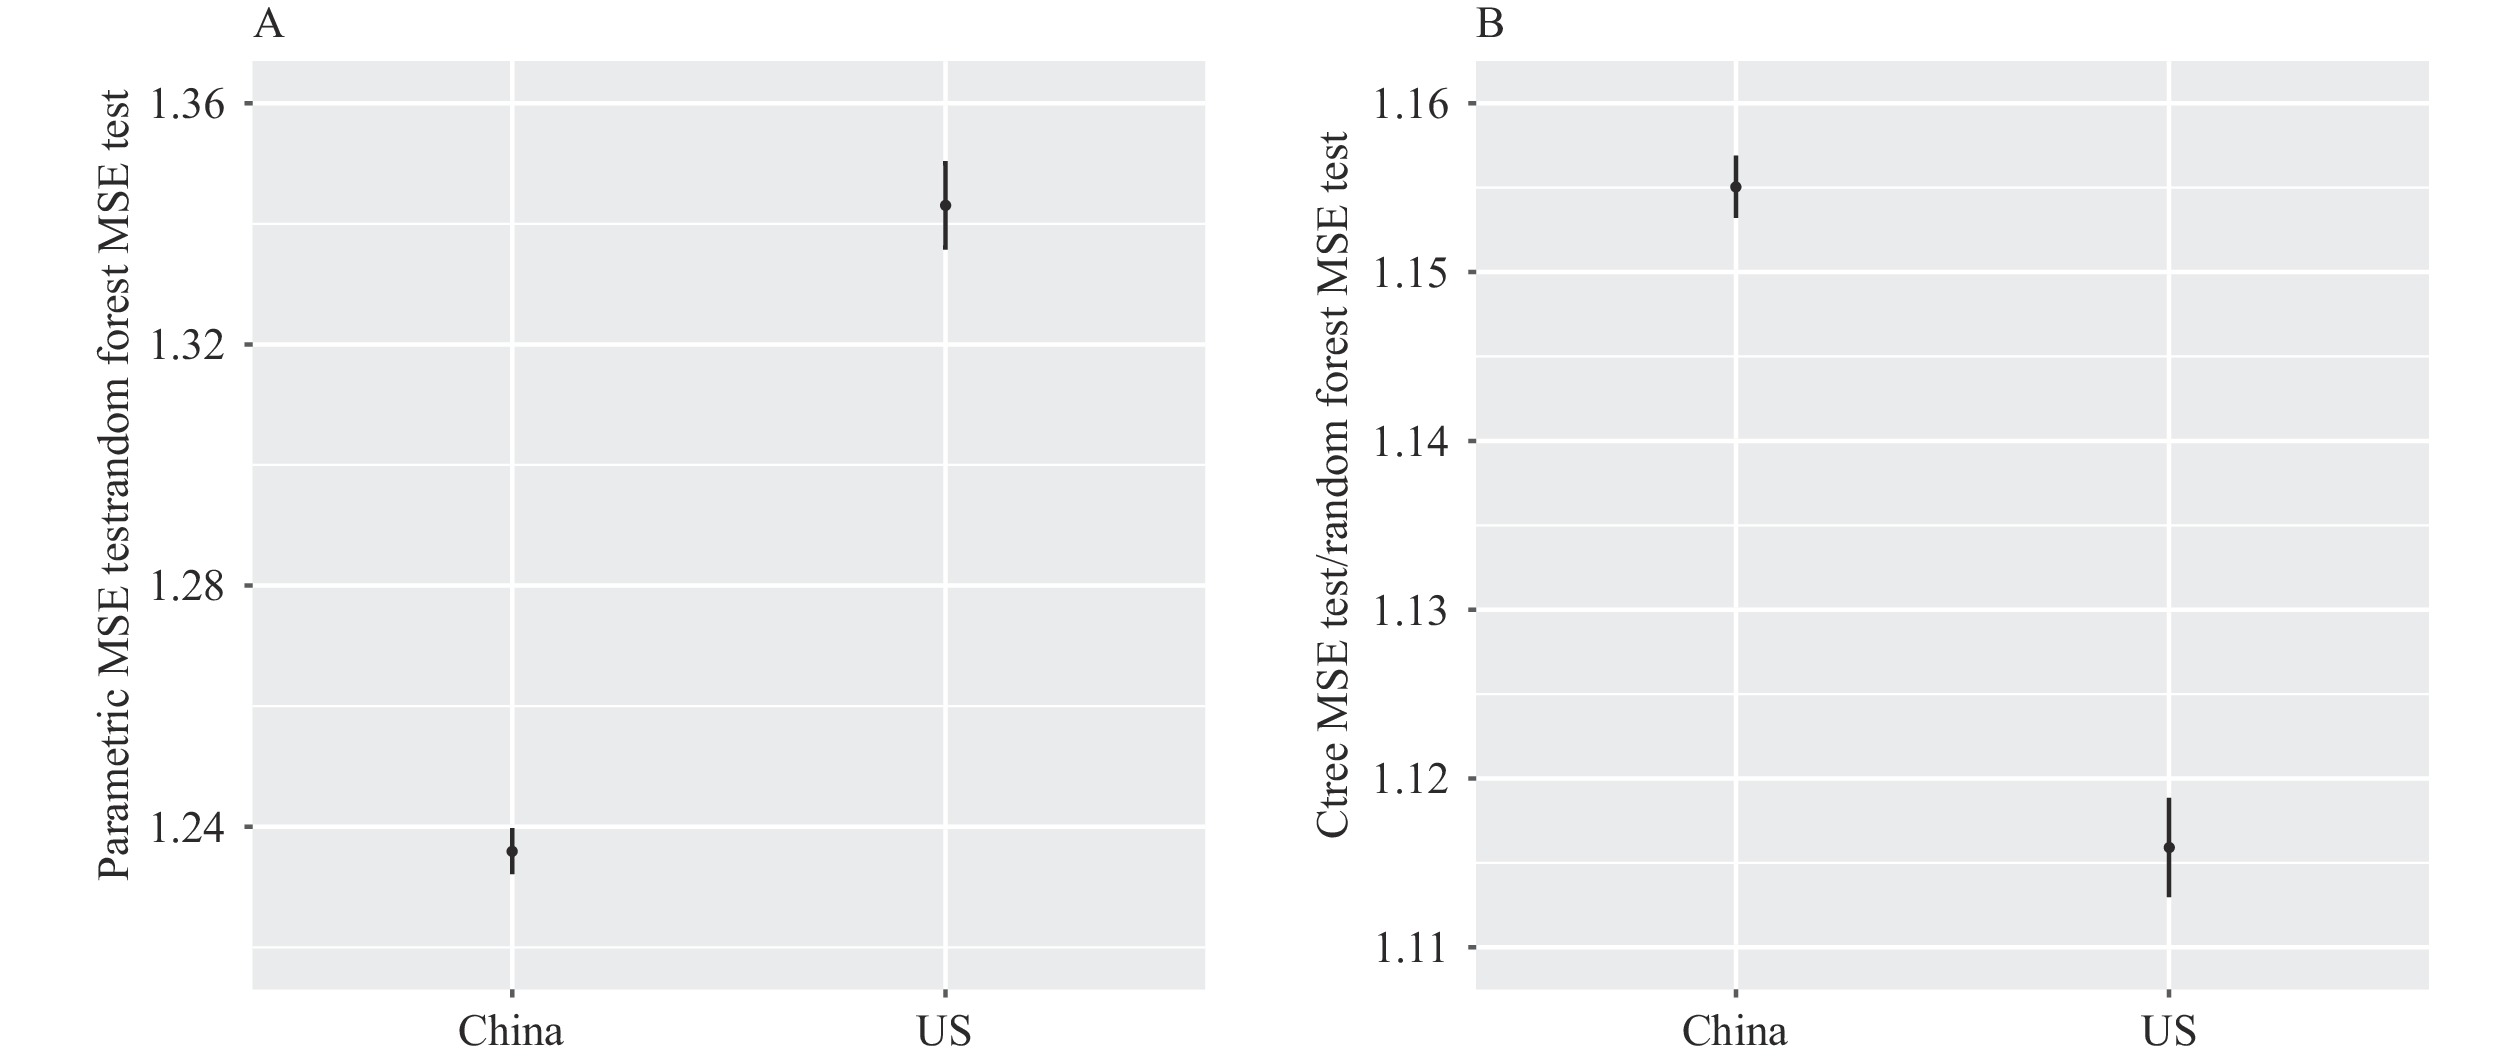 Figure 4.
Comparison of models’ test errors. (A) Parametric method vs. random forest; (B) Conditional inference trees vs. random forest.
Note: All models aim to minimize the MSE. MSE from Random Forest is used as the reference group. Ratios larger than 1 means the corresponding methods and outcome measures generate larger MSE than using Random Forest. The 95% confidence intervals are derived based on 200 bootstrapped re-samples of the test data.
Abbreviation: MSE=mean squared error.
-
This study utilized two machine learning methods, namely the conditional inference tree and forest, to investigate the effects of various childhood circumstances on health disparity among older adults in China and the US. We identified several key predictors of health conditions in older adults, including childhood health, socioeconomic status, number of books at home (in the case of Americans), and birth region (in the case of Chinese). By employing these methods, we aimed to address concerns regarding the arbitrary selection of childhood circumstances and mitigate potential biases in our estimates of the impact of childhood circumstances on health. Our findings emphasize the importance of mitigating health disparities stemming from childhood circumstances, and suggest the need for policy and intervention strategies to promote health equity in both China and the US. Implementing preventive measures during childhood can alleviate the economic burden of diseases, enhance quality of life, and improve longevity, particularly in the absence of effective treatments for chronic diseases like Alzheimer's, hypertension, and diabetes.
The conditional inference forest (CIF) demonstrates superior out-of-sample performance compared to other methods, resulting in the most accurate estimates of childhood circumstances on health inequality in old age. This finding is in line with previous studies in various fields (14–15). While conditional inference trees provide a simpler model and a visually accessible representation of childhood circumstances, the CIF leverages information on childhood circumstances more effectively, yielding results consistent with the trees in terms of importance and estimates of influence on health outcomes. These machine learning methods employ explicit algorithms to interpret health outcomes and do not rely on strong assumptions regarding the significance of specific childhood circumstances. By utilizing statistical techniques such as K-fold cross-validation and bootstrap, our modeling approach becomes more transparent and generalizable.
There are several limitations to this study. First, the life course approach used in this study only focuses on current older adults, which may not accurately reflect the experiences of younger cohorts. Therefore, future research should also consider monitoring younger cohorts. Second, it is important to note that the associations identified in this study should not be interpreted as causal. It is possible that unobservable childhood circumstances may introduce bias to our estimates. Therefore, further research is needed to identify the causal mechanisms at play. Lastly, the data used in this analysis are from the most recently released CHARLS (2020) and HRS (2020–2021) surveys, which overlap with the coronavirus disease 2019 (COVID-19) pandemic. This may introduce bias to self-rated health measures. However, our robustness checks using CHARLS/HRS pre-pandemic waves have yielded consistent results, providing reassurance.
In conclusion, our study utilized a life course approach and machine learning techniques to identify key factors influencing health in older adults. We applied this approach to the two largest economies and aging societies in the world. Our findings underscore the importance of incorporating a life course perspective in public health research and policy development.
-
No conflicts of interest.
HTML
FootNote
| ① |
|
| Citation: |

|