

 Download:


-
Anemia represents a significant global public health concern, being identified as the third most prevalent cause of disability worldwide according to the Global Burden of Disease Study (1). Women are disproportionately affected by anemia compared to men. In China, the emphasis of governmental and research efforts on anemia has predominantly centered on pregnant women and those of reproductive age, with insufficient attention given to anemia in other groups, such as elderly women. Previous studies have primarily focused on anemia prevalence among Chinese women, with a lack of comprehensive data for non-pregnant women across all age groups (2–4). This study aimed to assess the prevalence of anemia by severity among non-pregnant women in urban areas of China at both national and provincial levels, while also evaluating the socioeconomic disparities in anemia prevalence. The research included a total of 6,034,533 non-pregnant women aged 18 years and above from all 31 provincial-level administrative divisions (PLADs) in China’s urban regions between January 1, 2021, and December 31, 2021. Findings revealed that 14.8% of non-pregnant women aged 18 years and above in urban China experienced anemia, with 5.7% classified as having moderate to severe anemia. Anemia prevalence exhibited significant variations correlated with factors such as age, body mass index (BMI), geographic location, and economic status. It is imperative for comprehensive anemia intervention strategies to specifically target non-pregnant women aged 30–49 years and those aged 70 years and above, adapting to the varying levels of socioeconomic development and geographical disparities.
The data for this study were obtained from the Meinian Healthcare Group system, which, as China’s largest health exam chain, offers extensive services with facilities in 231 prefecture-level cities across 31 PLADs (5). The population investigated was comprised primarily of employees (70%) and non-working urban residents. Standardized procedures were employed to collect socio-demographic data, physical measurements, and biochemical indices from venous blood samples. Within the period from January 1, 2021, to December 31, 2021, a total of 6,034,533 non-pregnant women aged 18 years and above were eligible for and included in the analysis. The World Health Organization (WHO) defines anemia in non-pregnant women aged 15 years and over as a hemoglobin concentration below 120.0 g/L. Levels ranging from 110.0 to 119.0 g/L are classified as mild anemia, 80.0–109.0 g/L as moderate, and below 80.0 g/L as severe (6). Hemoglobin levels were adjusted for the mean altitude of the prefecture-level cities. Socioeconomic factors were represented by the city-level Engel coefficient and gross domestic product (GDP), which were categorized into quartiles and merged with individual participant data. For analytical purposes, China’s geographic regions were segmented into six areas: the northern, eastern, central, southwestern, northwestern, and northeastern.
Using the sample structure as a reference and adjusting for population distribution by PLAD and age, we calculated standardized prevalence rates and their 95% confidence intervals (CIs). We employed the χ2 test with the Rao-Scott correction to assess differences across groups. To explore the relationship between anemia and various socioeconomic factors, we adjusted for age, BMI, history of cesarean delivery, GDP, systolic blood pressure, total cholesterol, hyperuricemia, glomerular filtration rate, and geographic region using multivariable logistic regression that accounted for clustering effects. SAS software (version 9.4, SAS Institute Inc., Cary, NC, USA) was used for all statistical analyses. We conducted two-sided statistical tests, with a P-value of less than 0.05 considered to indicate statistical significance. The Peking University Institutional Review Board (IRB-0000152-19077) provided ethical approval for this study.
The average age of eligible women was 48.4 years [standard deviation (SD)=14.5], with 2,834,987 aged 50 years and older. Among them, 43.1% were overweight or obese, 3.9% had a history of cesarean delivery, and 59.8% lived in eastern or central China.
In 2021, an estimated 14.8% (95% CI: 13.9%, 15.5%) of non-pregnant women were found to have anemia, with 5.7% (95% CI: 5.4%,6.0%) experiencing moderate to severe anemia (Table 1). The prevalence of anemia varied based on factors such as age and region. Urban non-pregnant women aged 40–49 years showed the highest prevalence of moderate to severe anemia at 10.6% (95% CI: 10.1%, 11.1%), followed by those who had a prior cesarean delivery (8.4%, 95% CI: 7.7%, 9.1%), were underweight (6.6%, 95% CI: 6.1%, 7.0%), and resided in the northwest region (6.3%, 95% CI: 5.5%, 7.1%).
Variable Number (%) Anemia (%, 95% CI) P value Moderate-severe anemia (%, 95% CI) P value Overall 6,034,533 (100.0) 14.8 (13.9, 15.5) 5.7 (5.4, 6.0) Age group (years) <0.001 <0.001 18–29 554,856 (9.2) 13.4 (12.4, 14.3) 4.6 (4.3, 5.0) 30–39 1,371,860 (22.7) 18.4 (17.5, 19.4) 7.7 (7.2, 8.1) 40–49 1,272,830 (21.1) 21.3 (20.4, 22.3) 10.6 (10.1, 11.1) 50–59 1,382,241 (22.9) 10.1 (9.4, 10.9) 3.4 (3.1, 3.6) 60–69 930,278 (15.4) 8.5 (7.7, 9.3) 1.6 (1.4, 1.8) 70+ 522,468 (8.7) 13.8 (12.8, 14.8) 3.6 (3.2, 4.0) BMI <0.001 <0.001 Underweight 253,928 (4.2) 16.7 (15.8, 17.6) 6.6 (6.1, 7.0) Normal 3,176,775 (52.6) 18.5 (17.3, 19.6) 6.4 (6.0, 6.7) Overweight 1,926,434 (31.9) 12.5 (11.9, 13.2) 5.0 (4.8, 5.3) Obesity 677,392 (11.2) 10.7 (10.1, 11.3) 4.5 (4.2, 4.7) History of cesarean delivery <0.001 <0.001 Yes 232,645 (3.9) 18.5 (17.2, 19.9) 8.4 (7.7, 9.1) No 5,801,888 (96.1) 14.6 (13.8, 15.4) 5.6 (5.3, 5.9) GDP 0.016 0.108 Lowest 1,714,069 (28.4) 15.6 (13.9, 17.3) 6.2 (5.6, 6.9) Up to median 1,714,528 (28.4) 13.5 (12.3, 14.6) 5.5 (4.9, 6.0) Above median 1,165,930 (19.3) 13.9 (12.7, 14.9) 5.4 (4.8, 5.9) Highest 1,440,005 (23.9) 15.9 (14.4, 17.6) 5.8 (5.3, 6.3) Engel coefficient 0.950 0.420 Highest 2,020,415 (33.5) 15.1 (13.6, 16.6) 5.6 (5.0, 6.2) Above median 1,496,599 (24.8) 14.6 (12.6, 16.6) 5.4 (4.8, 6.1) Up to median 1,471,689 (24.4) 14.7 (13.4, 16.0) 5.9 (5.4, 6.4) Lowest 1,045,831 (17.3) 14.5 (13.4, 15.6) 6.1 (5.6, 6.7) Geographic region <0.001 0.001 Northern 768,980 (12.7) 13.8 (12.4, 15.2) 6.1 (5.5, 6.7) Eastern 1,914,120 (31.7) 15.1 (13.9, 16.4) 5.8 (5.4, 6.2) Central 1,697,789 (28.1) 16.5 (15.3, 17.8) 6.2 (5.8, 6.6) Southwestern 785,872 (13.0) 13.5 (10.6, 16.5) 4.7 (3.4, 6.0) Northwestern 407,411 (6.8) 14.4 (11.9, 16.8) 6.3 (5.5, 7.1) Northeastern 460,362 (7.6) 10.5 (9.6, 11.5) 4.4 (4.2, 4.6) Note: hemoglobin concentration between 110.0 and 119.0 g/L was considered mild, 80–109 g/L as moderate, and lower than 80 g/L as severe.
Abbreviation: CI=confidential interval; BMI=body mass index; GDP=gross domestic product.Table 1. Prevalence of anemia by severity among non-pregnant women in urban China, 2021.
The prevalence of anemia varied among PLADs, ranging from 5.6% to 38.0% (Figure 1), with the highest rates observed in Xizang, Guangxi, and Hubei PLADs. Moderate to severe anemia prevalence ranged from 3.5% to 15.6%. Anemia prevalence by PLAD exhibited distinct patterns across various age groups of women.
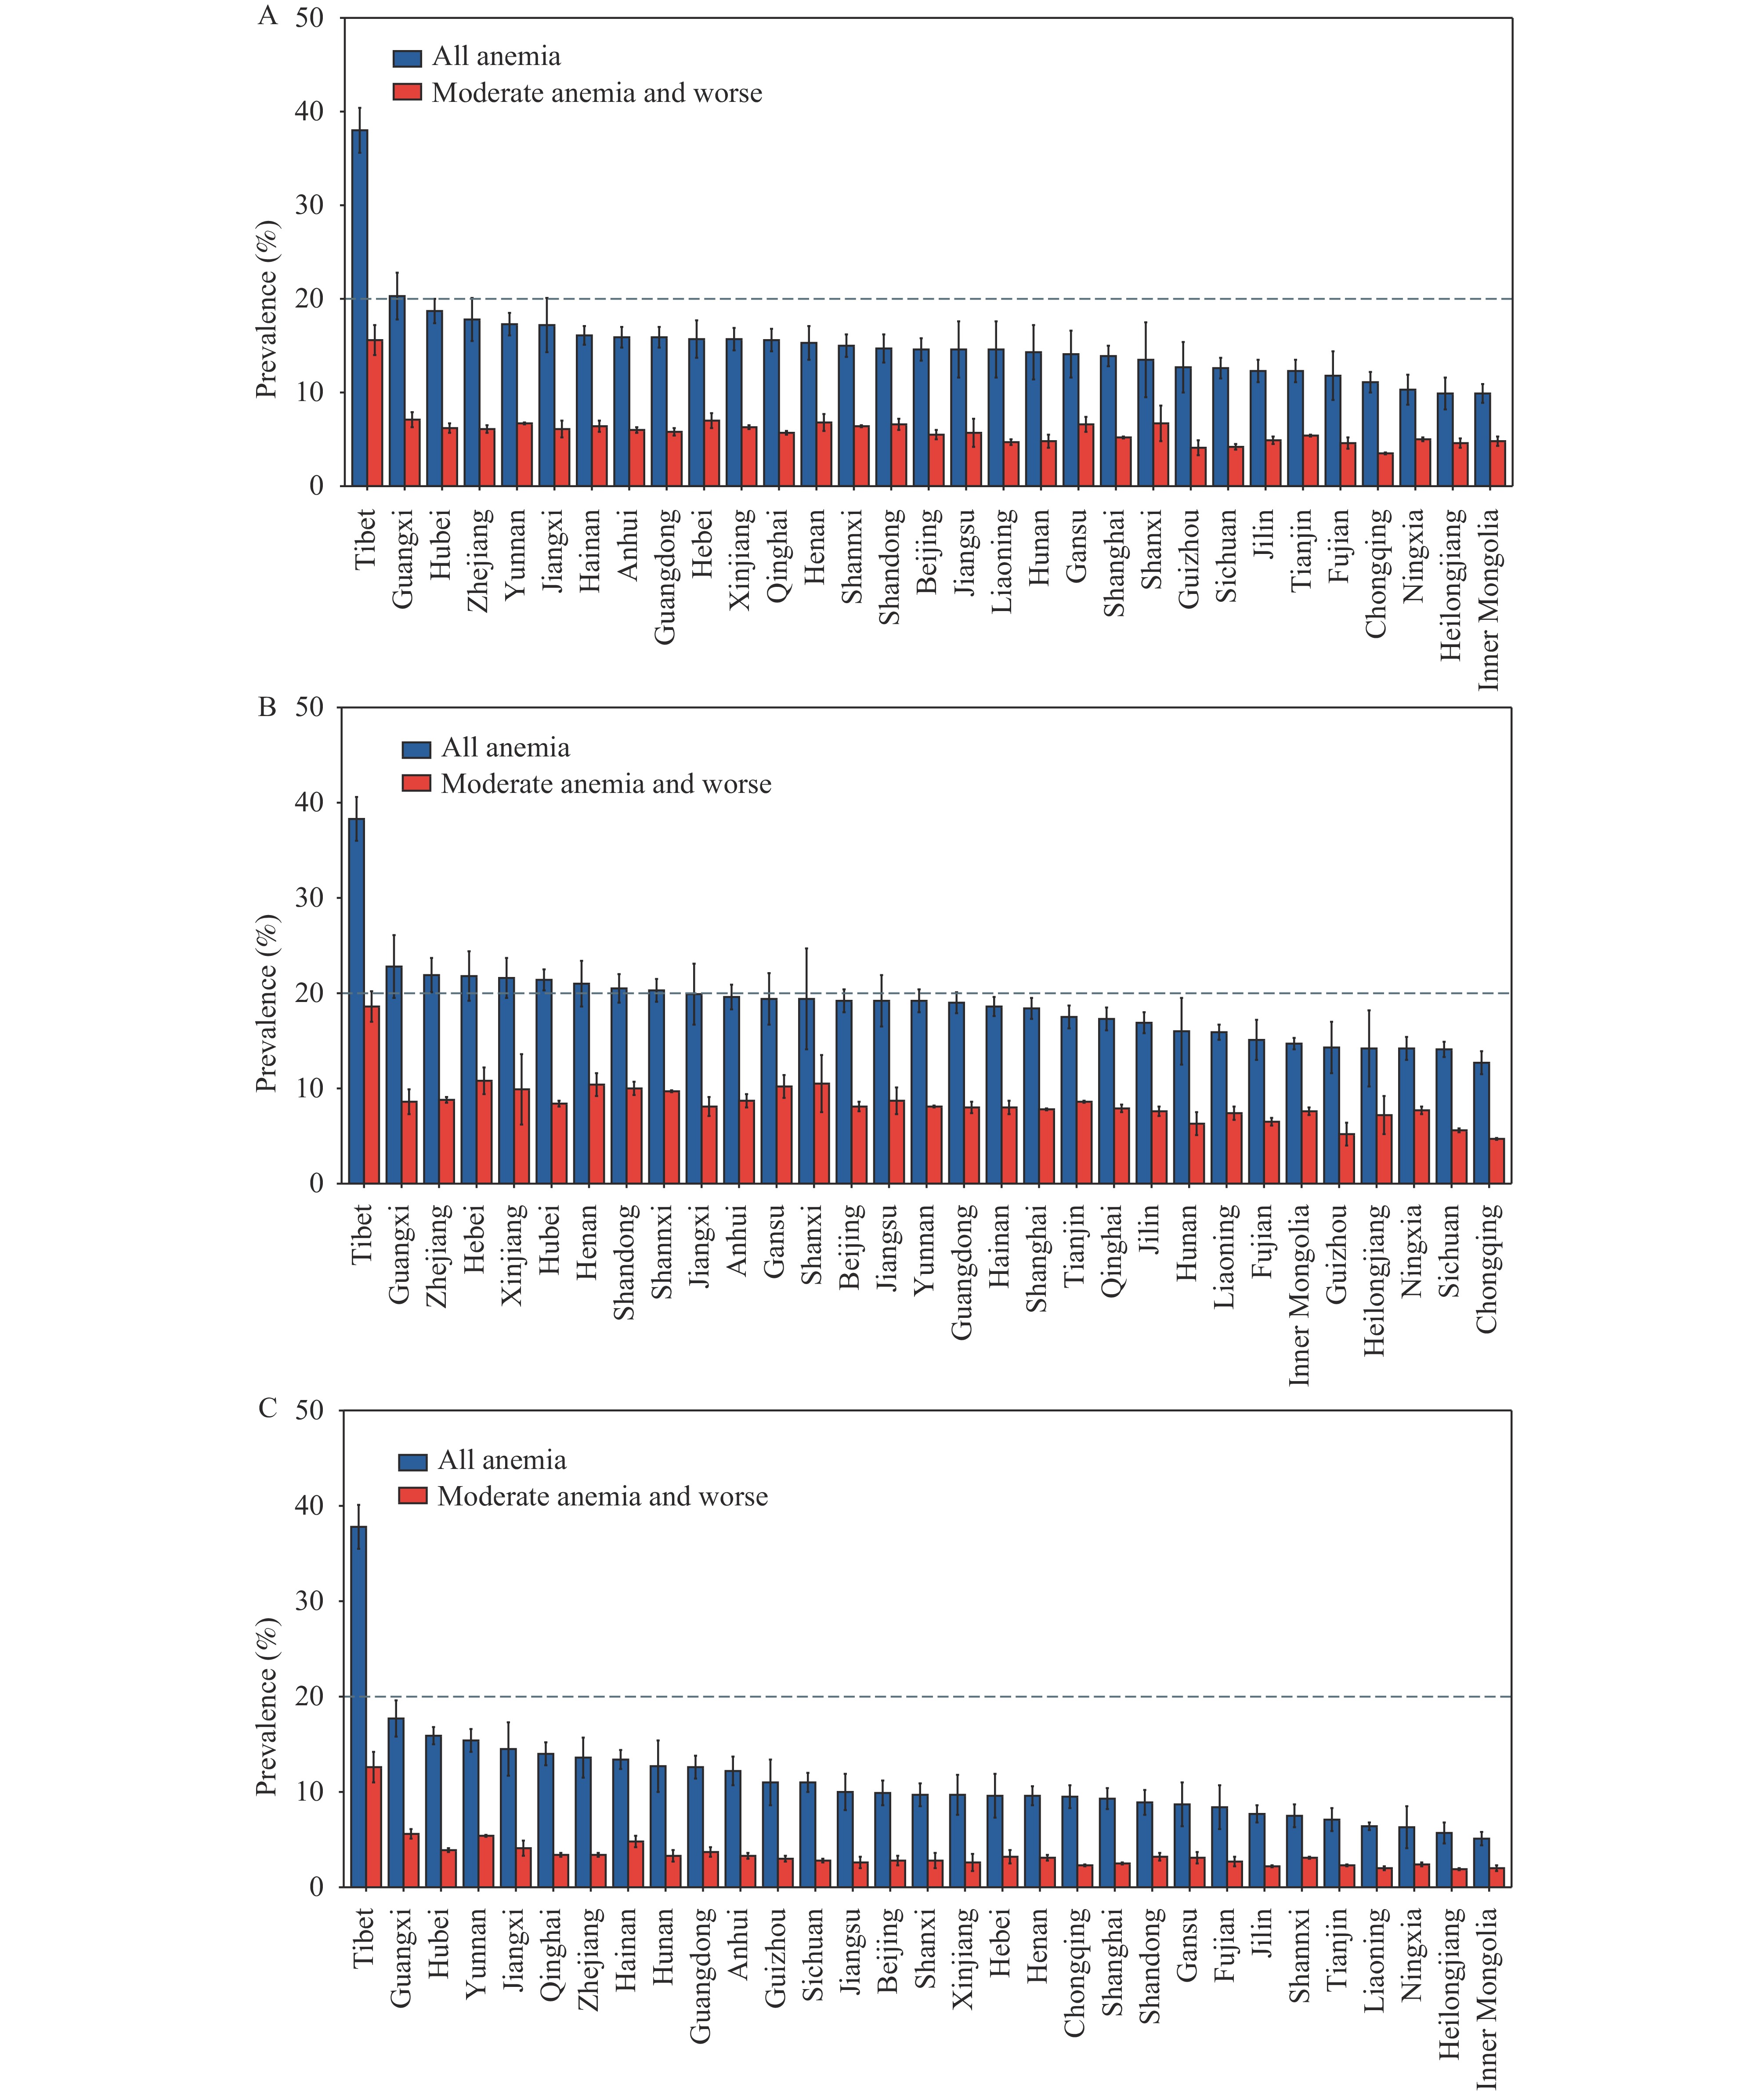 Figure 1.
Regional disparities in the prevalence of anemia among non-pregnant women in urban China, standardized by age, 2021. (A) Anemia among all women; (B) Anemia among women aged 18–49; (C) Anemia among women aged 50 and over.
Multivariable logistic regression analysis revealed that individuals aged 30–49 and those 70 years and older, along with those who are underweight, were significantly more likely to have anemia when compared to their respective reference groups. Additionally, residents in the central, eastern, northern, and northwestern regions of China displayed a higher prevalence of anemia (Table 2). Women residing in regions with the lowest GDP had an increased likelihood of moderate to severe anemia, with odds ratios (OR) of 1.18 (95% CI: 1.04, 1.34) for both the age groups of 18–49 years and those above 49 years. In separate analyses, urban non-pregnant women aged 18–49 living in the lowest GDP areas (OR=1.16, 95% CI: 1.03, 1.31), with a history of cesarean delivery (OR=1.06, 95% CI: 1.01, 1.12), and those who are obese (OR=1.03, 95% CI: 1.01, 1.06) were found to have a greater risk of moderate to severe anemia. For non-pregnant women aged 50 years and above, a lower Engel coefficient (OR=1.24, 95% CI: 1.05, 1.47) and being underweight (OR=1.71, 95% CI: 1.63, 1.79) were associated with an increased risk of anemia.
Variable Overall 18–49 years 50 years and above Anemia Moderate-severe anemia Anemia Moderate-severe anemia Anemia Moderate-severe anemia OR (95% CI) OR (95% CI) OR (95% CI) OR (95% CI) OR (95% CI) OR (95% CI) Age group (years) 18–29 Reference Reference 30–39 1.54 (1.49, 1.59)** 1.74 (1.68, 1.81)** 40–49 2.12 (2.03, 2.21)** 2.81 (2.68, 2.94)** 50–59 1.05 (0.99, 1.11) 0.99 (0.94, 1.05) 60–69 0.95 (0.87, 1.04) 0.50 (0.44, 0.56)** 70+ 1.60 (1.48, 1.73)** 1.07 (0.94, 1.21) BMI Underweight 1.12 (1.09, 1.16)** 1.04 (1.01, 1.08)* 1.02 (1.00, 1.04)* 0.96 (0.93, 0.98)* 1.71 (1.63, 1.79)** 1.72 (1.58, 1.87)** Normal Reference Reference Reference Reference Reference Reference Overweight 0.83 (0.81, 0.85)** 0.95 (0.93, 0.97)** 0.92 (0.90, 0.93)** 1.01 (0.99, 1.03) 0.73 (0.72, 0.75)** 0.83 (0.80, 0.86)** Obese 0.76(0.73, 0.79)** 0.93 (0.90, 0.96)** 0.89 (0.86, 0.92)** 1.03 (1.01, 1.06)* 0.64 (0.61, 0.67)** 0.78 (0.74, 0.82)** History of cesarean delivery Yes 1.04 (0.99, 1.09) 1.06 (1.01, 1.08)* 1.04 (1.00, 1.09)* 1.06 (1.01, 1.12)* 1.03 (0.96, 1.10) 1.07 (0.98, 1.17) No Reference Reference Reference Reference Reference Reference GDP Lowest 1.10 (0.94, 1.27) 1.18 (1.04, 1.34)* 1.10 (0.96, 1.2t6) 1.16 (1.03, 1.31)* 1.07 (0.89, 1.29) 1.22 (1.03, 1.45)* Up to median 0.92 (0.79, 1.06) 1.01 (0.90, 1.15) 0.94 (0.93, 1.07) 1.01 (0.89, 1.15) 0.86 (0.71, 1.04) 1.03 (0.87, 1.22) Above median 0.95 (0.82, 1.10) 1.04 (0.92, 1.18) 0.96 (0.84, 1.09) 1.02 (0.91, 1.15) 0.94 (0.78, 1.13) 1.08 (0.91, 1.28) Highest Reference Reference Reference Reference Reference Reference Engel coefficient Highest 1.03 (0.91, 1.17) 0.94 (0.84, 1.05) 0.94 (0.83, 1.06) 0.87 (0.78, 0.99)* 1.24 (1.05, 1.47)* 1.16 (0.98, 1.37) Above median 1.06 (0.91, 1.24) 0.95 (0.84, 1.07) 0.98 (0.84, 1.14) 0.91 (0.80, 1.03) 1.23 (1.03, 1.47)* 1.10 (0.94, 1.28) Up to median 1.06 (0.93, 1.20) 0.98 (0.87, 1.10) 1.02 (0.91, 1.14) 0.97 (0.86, 1.10) 1.15 (0.98, 1.36) 1.02 (0.87, 1.20) Lowest Reference Reference Reference Reference Reference Reference Geographic region Northern 1.34 (1.12, 1.60)* 1.30 (1.14, 1.47)** 1.25 (1.07, 1.46)* 1.23 (1.07, 1.41)* 1.44 (1.11, 1.87)** 1.45 (1.17, 1.79)* Eastern 1.47 (1.27, 1.70)** 1.31 (1.20, 1.43)** 1.30 (1.15, 1.46)** 1.19 (1.10, 1.29)** 1.79 (1.46, 2.20)** 1.66 (1.42, 1.94)** Central 1.58 (1.36, 1.84)** 1.36 (1.23, 1.49)** 1.32 (1.16, 1.51)** 1.18 (1.08, 1.29)** 2.11 (1.72, 2.59)** 1.96 (1.65, 2.31)** Southwestern 1.29 (0.97, 1.71) 1.03 (0.77, 1.39) 1.01 (0.77, 1.33) 0.85 (0.65, 1.11) 1.82 (1.33, 2.49)** 1.57 (1.08, 2.28)* Northwestern 1.32 (1.02, 1.72)* 1.30 (1.08, 1.57)** 1.24 (0.97, 1.60) 1.25 (1.04, 1.50)* 1.40 (1.02, 1.91)* 1.41 (1.11, 1.78)* Northeastern Reference Reference Reference Reference Reference Reference Note: hemoglobin concentration between 110.0 and 119.0 g/L was considered mild, 80–109 g/L as moderate, and lower than 80 g/L as severe.
Abbreviation: OR=odds ratio; CI=confidential interval; BMI=body mass index; GDP=gross domestic product.
* P<0.05; ** P<0.01.Table 2. Multilevel logistic regression analysis for the factors associated with anemia prevalence among non-pregnant women in urban China, 2021.
-
In 2021, the prevalence of anemia among non-pregnant, urban women in China was 14.8%. This rate aligns with the WHO’s classifications as a mild public health concern (6). However, in certain demographics, such as non-pregnant women between the ages of 18 and 49, 9 PLADs exhibit anemia prevalence rates over 20%, indicating a moderate public health issue. Moreover, the incidence of moderate to severe anemia — which has substantial health and economic repercussions — stood at 5.7% among non-pregnant women. Prior research indicates that anemia prevalence is lower in urban women compared to their rural counterparts (4,7), suggesting that the anemia burden may be more pronounced across the broader population of non-pregnant women nationwide.
This study found that the prevalence of anemia in non-pregnant women varied by age, with the highest risk observed in the 40–49 year age group, followed by those aged ≥70 years, and then the 30–39 year age group. These findings suggest that women of reproductive age remain particularly vulnerable to anemia. The increased risk in women aged 40–49 may be attributed to menorrhagia common during the perimenopausal period, while the elevated risk in women aged ≥70 years could be related to the higher incidence of chronic diseases and inflammation accompanying aging (6,8–10). Consistent with other research, our study confirmed regional variations in anemia prevalence. Non-pregnant women in the central, eastern, northern, and northwestern regions of China were found to have a higher likelihood of anemia compared to their counterparts in the northeastern region. Additionally, in the population aged 50 and above, the prevalence of anemia was notably higher in the southwestern than in the northeastern region, underscoring the significant impact of anemia in these regions. These regional disparities may be influenced by local characteristics, dietary practices, prevalence of chronic illnesses, and existing health interventions (11–12). In terms of body weight, being underweight was associated with an increased risk of anemia, while being overweight or obese appeared to be protective. This trend aligns with previous research, possibly because overweight and obese women may consume a high-energy diet that adequately supplies iron (12–13). Previous studies have reported inconsistent findings concerning the association between economic status and anemia in women (2,11). Our study revealed that residing in areas with the lowest GDP correlates with a heightened risk of moderate to severe anemia across various age groups among non-pregnant women.
This study is subject to some limitations. Its predominantly urban participant base may lead to underestimating anemia prevalence among non-pregnant Chinese women, limiting a comprehensive understanding of their anemia status. Additionally, the cross-sectional design impedes establishing causal relationships between anemia risk and influencing factors. Furthermore, the absence of etiological data restricts the study’s capability to offer specific intervention recommendations.
This research is the first to utilize extensive data to determine anemia prevalence among non-pregnant women in urban China, enhancing the estimate’s reliability and representativeness. In conclusion, anemia is a significant public health concern among non-pregnant women of all ages in urban China. Intervention strategies should focus on high-risk groups. Particularly, priority should be given to the 9 PLADs where anemia prevalence exceeds 20%. A nationwide survey is essential to design customized interventions aimed at reducing anemia effectively.
-
No conflicts of interest.
HTML
| Citation: |

|