
 Download:


-
Numerous studies in the fields of life sciences and epidemiology have demonstrated that women differ significantly from men in terms of physiology, psychology, and social function. Moreover, the aging process and its mechanisms vary between genders, with women being more susceptible to aging and more interested in preventive measures (1–2). The concept of the longevity inflection point proposes that there is a specific stage in life where degenerative changes occur (3). As a result, research investigating changes in women aging at a microscopic level has emerged in recent years. Predicting the aging process and identifying the inflection point through biomarker analysis has become a prominent research trend. However, these microscopic studies have limitations, including small sample sizes and high workloads. In this study, we conducted a comprehensive assessment of the aging level among middle-aged and elderly women in Jiangxi Province, China, from January 2020 to December 2022. We utilized big data epidemiological surveys and employed statistical analysis through numerical modeling to calculate the inflection ages in the physiological, psychological, social, and overall dimensions for middle-aged, young, and elderly women [(48.0–53.2) vs. (66.3–70.0) vs. (78.4–81.2) years old].
Based on the recent gross domestic product (GDP) level and social development status of Jiangxi Province, nine urban and rural communities that meet the specified criteria were selected as research sites for this project. A multi-stage stratified cluster sampling approach was employed, following the county-district-community three-level management model. The final sampling was conducted at each community health service center. The inclusion criteria for the study were as follows: 1) Women aged 40 years or older who have resided in Jiangxi Province for more than three years; 2) Women who can actively participate in the study, cooperate with the survey, and provide the required information; 3) The sampling proportion for different age groups should not exceed the proportion of the age composition of the women population in Jiangxi Province. Exclusion criteria included individuals with serious illness, disabilities, mental disorders, or the inability to participate in the entire study.
In this study, we assessed an individual’s level of aging using the Physiological-Psychological-Social Three-Dimensional Human Aging Scale (PPSHAS). This scale comprehensively evaluates aging in the physical, psychological, and social dimensions, encompassing factors such as wrinkles, hearing, cognition, mood, social participation, and organizational interactions. The scale produces a standardized score for the overall level of aging, which has shown excellent reliability and validity (Cronbach’s α=0.930, retest reliability=0.856) (4).
Based on the pre-survey results (4), the percentage of women classified as “obviously young” ranged from 11.96% to 35.94%. The proposed median value of 23.95% was deemed to be the positive probability (p), with a bilateral test level α of 0.05 and an allowable error (δ) of 0.1p. Taking into account potential non-compliance of participants, the original sample size was increased by 20%, resulting in a final sample size of 1,500.
Ethical clearance for this study was obtained from the Second Affiliated Hospital of Nanchang University, and participants and their legal guardians were informed about the study goals. A total of 1,785 women from nine cities were surveyed, and 1,720 valid questionnaires were collected, yielding an effective response rate of 96.36%.
According to the age groups defined by the World Health Organization (WHO), participants were categorized into three groups: middle-aged (45–59 years old), young elderly (60–74 years old), and elderly (≥75 years old). The participants were further divided into more specific age groups using the PPSHAS tools, with individuals scoring below the standardized P50 score for their respective age group considered not to be aging. Statistical analysis was carried out using R software (version 4.2.1; R Foundation for Statistical Computing, Vienna, Austria), including fitting Locally Weighted Regression smooth curves (LOESS) and conducting data analysis.
The age at which aging began was determined using the receiver operator characteristic curve (ROC) and the approximate Youden index. The binary logistic regression model was used to control for the confounding effects of education level, occupation, and marital status. The odds ratios (ORs) from the logistic regression model were utilized to compare the degree of aging, with an OR>1.000 indicating a deepening of aging beyond the inflection point age. The model’s effectiveness in predicting the degree of aging was assessed using the C index. The model’s consistency was evaluated using the Hosmer-Lemeshow test (α=0.05).
To ensure the reliability of the research results, all investigators underwent a strict selection process and received specialized training. Regular data checks were conducted during the survey, and all data were reviewed individually to eliminate any invalid questionnaires.
Among the 1,720 participants, the average age was 62.73±10.88 years. The age group of 65–69 accounted for the largest proportion at 17.73%. The highest education level was primary school or below at 55.58%, followed by junior high school at 25.00%. In terms of occupation, 23.72% of participants were workers, 39.77% were farmers, and 20.47% were cadres. Regarding marital status, 82.67% were married, 16.34% were widowed, and 0.99% were unmarried. In addition, 57.33% of the participants were from rural areas and 42.67% were from urban areas.
A one-way analysis of variance (ANOVA) was conducted to assess the standardized scores of aging in the physiological, psychological, social, and total dimensions. The results indicated significant differences in the standardized scores of aging degree across different age groups within the same group and between different age groups, except for the psychological dimension of middle-aged individuals. The P was less than 0.05 (Table 1).
Age groups Age (years) N (%) Dimension Total dimension Physiological Psychological Social Middle-aged ≥40 221 32.74 23.77±5.50 14.59±2.47 5.15±0.94 43.51±6.99 ≥50 210 31.11 26.57±4.59 14.67±2.72 5.36±1.03 46.59±6.34 ≥55 244 36.15 28.79±4.75 14.61±2.73 5.72±2.49 49.11±6.57 N 675 100.00 26.46±5.38 14.62±2.64 5.42±1.70 46.49±7.03 F – – 54.958* 0.049 6.742 41.305 P-value <0.001 0.952 <0.001 <0.001 Young
elderly≥60 277 34.07 30.66±4.47 14.63±2.67 5.57±0.99 50.86±6.52 ≥65 305 37.52 32.65±4.45 14.85±2.82 5.77±1.13 53.27±6.43 ≥70 231 28.41 35.43±4.80 15.3±2.79 6.19±1.38 56.92±7.43 N 813 100.00 32.76±4.92 14.9±2.77 5.82±1.19 53.49±7.16 F – – 68.940 3.774 16.545* 50.806 P-value <0.001 0.023 0.001 <0.001 Elderly ≥75 119 51.29 37.24±4.97 14.78±3.12 6.46±1.58 58.48±8.20 ≥80 113 48.71 40.56±5.22 15.73±3.15 7.08±1.98 63.38±8.94 N 232 100.00 38.86±5.35 15.24±3.16 6.76±1.81 60.86±8.90 F – – 24.658 5.374 6.998 18.936 P-value <0.001 0.021 0.009 <0.001 N 1,720 100.00 31.11±6.67 14.84±2.78 5.79±1.56 51.74±8.82 F – – 576.997 4.396* 49.806* 329.209* P-value <0.001 0.013 <0.001 <0.001 Note: The F-distribution is approximated using the Welch method.
“–” indicates that no value is available here.
* indicates that the variance is uneven for Levene statistics.Table 1. Distribution and comparison of standardized scores of aging among different age groups in Jiangxi Province, China, 2020–2022.
We plotted scatter plots of chronological age (X) and the normalized score of aging degree in different dimensions (Y) for three age groups. The LOESS local weighted regression method was used for smoothing. Our observation indicated that the score of aging degree in the physiological, psychological, social , and overall dimensions increased in a zigzag pattern with age (Figure 1).
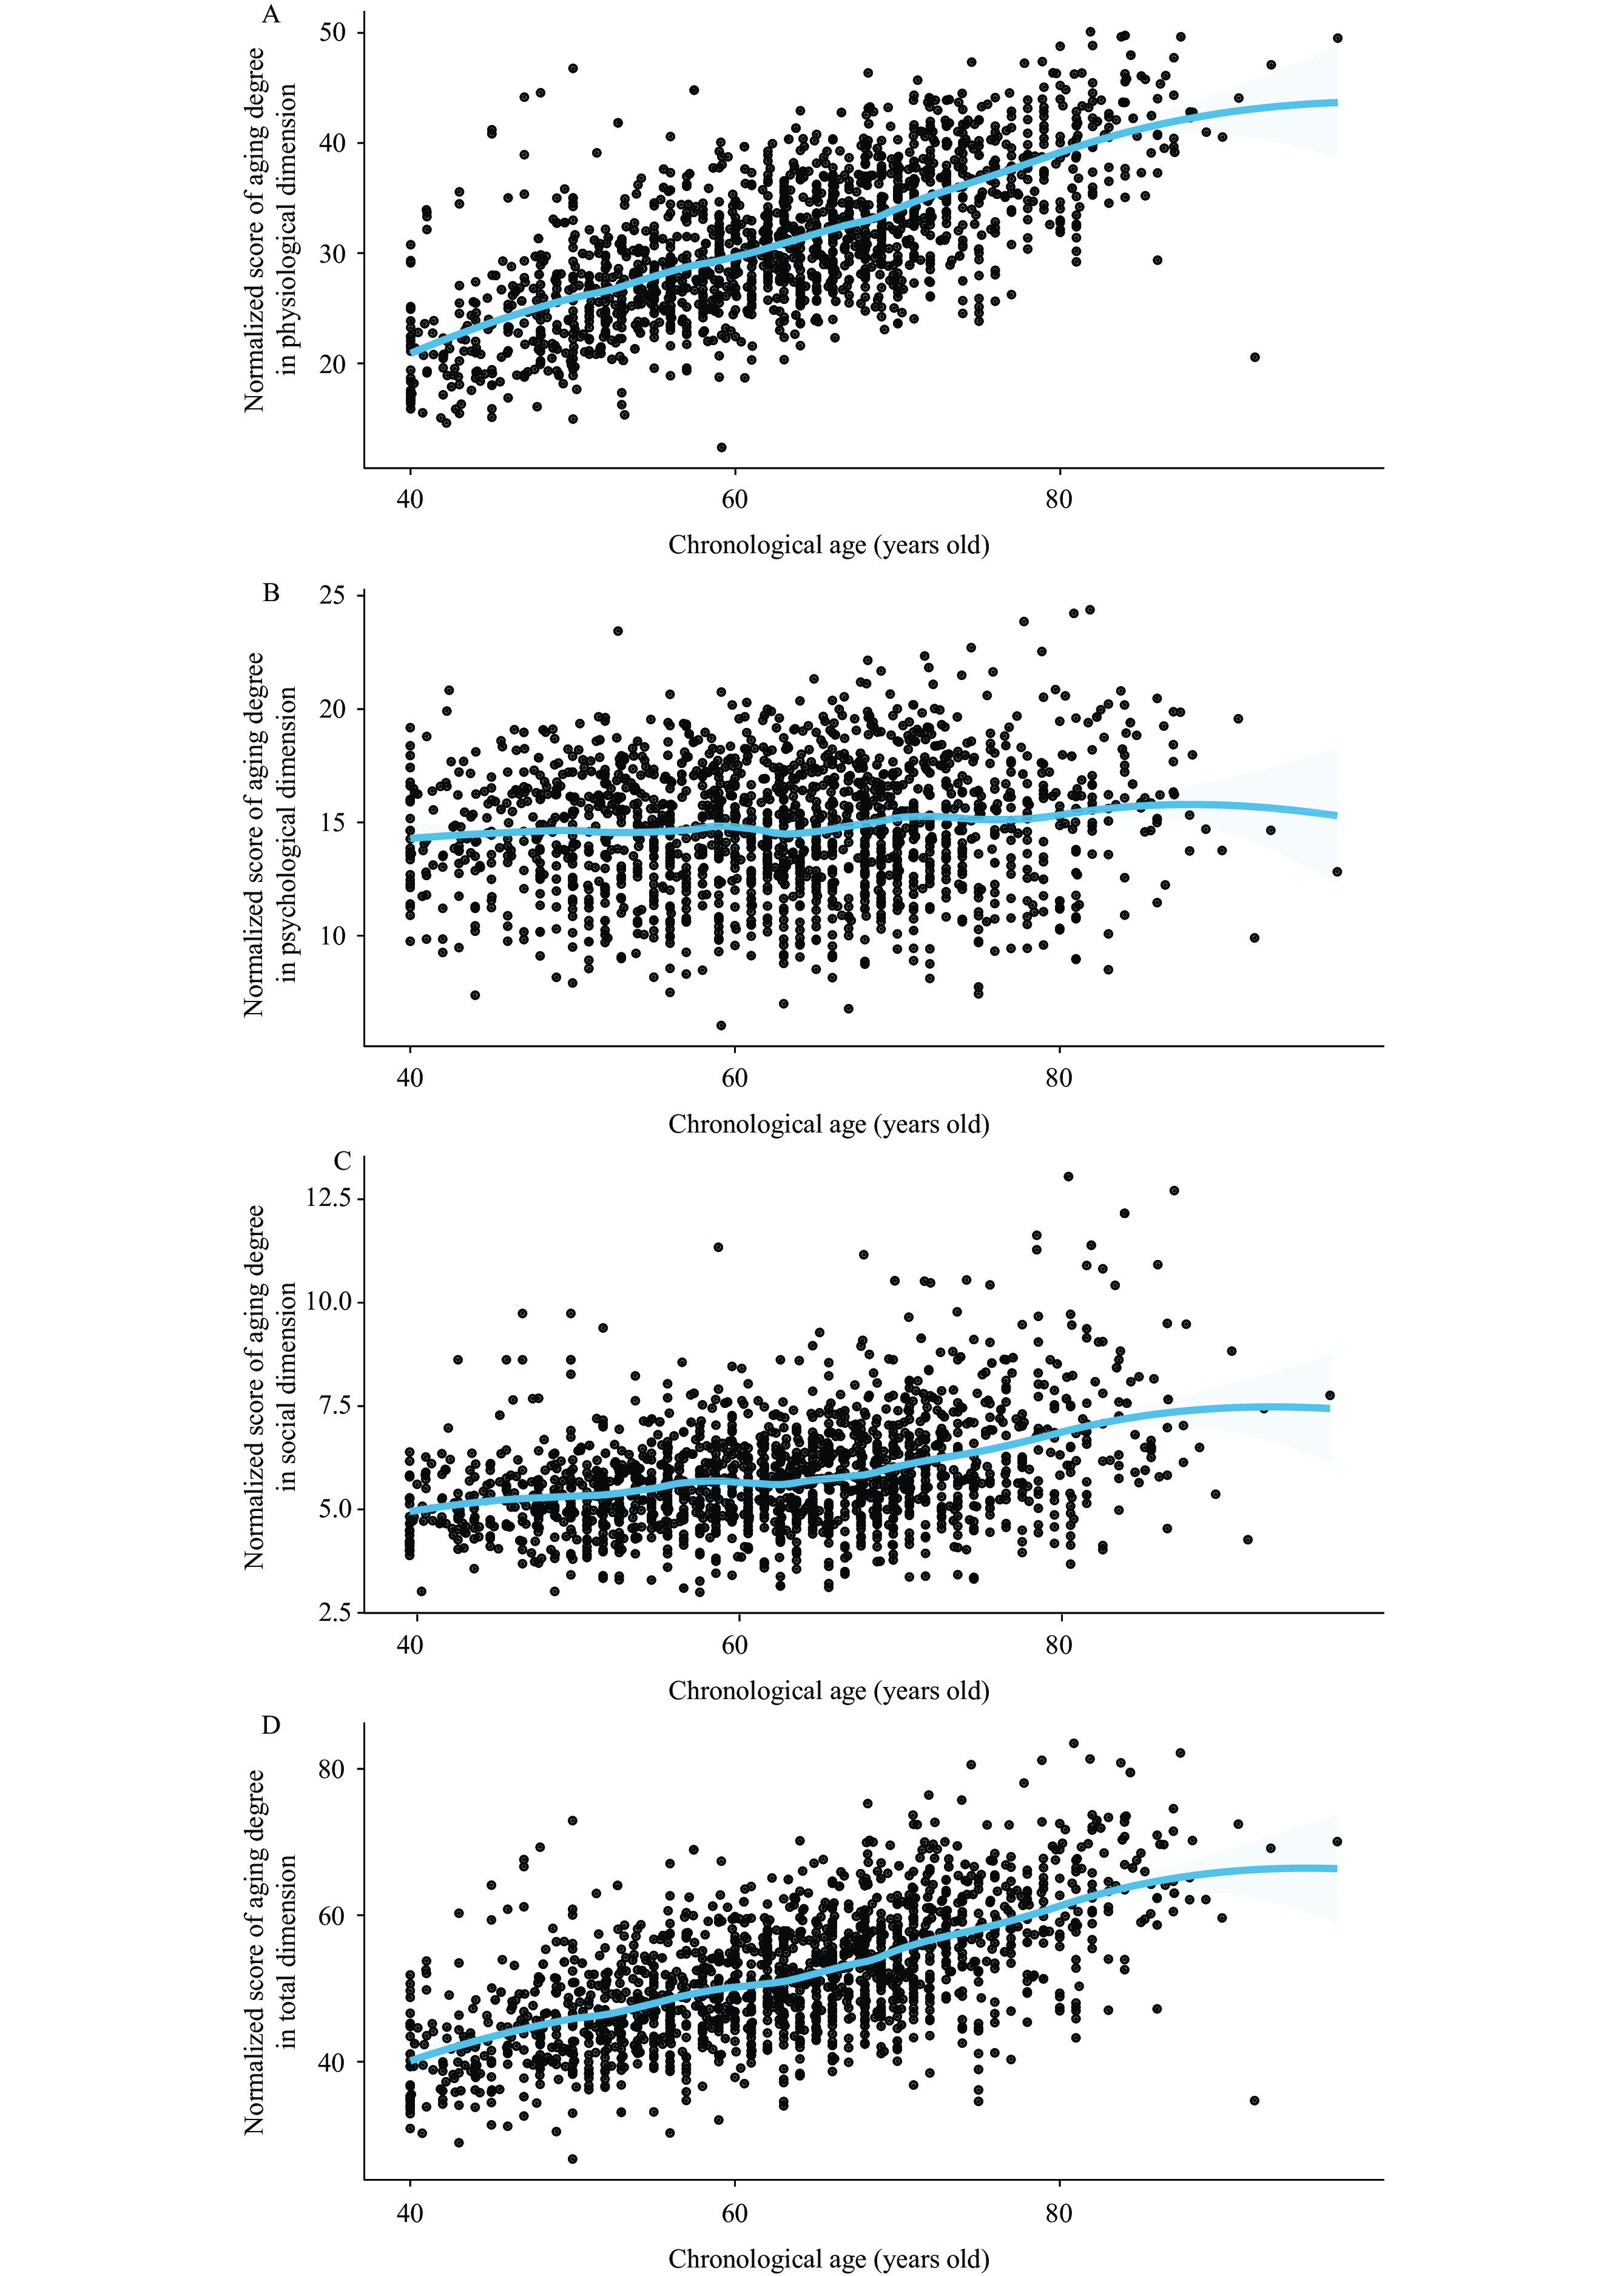 Figure 1.
LOESS curve smoothing chart of different dimensions of aging scores among different age groups in Jiangxi Province, China, 2020–2022. (A) LOESS curve smoothing chart of physiological dimension aging score among different age groups; (B) LOESS curve smoothing chart of psychological dimension aging score among different age groups; (C) LOESS curve smoothing chart of social dimension aging score among different age groups; (D) LOESS curve smoothing chart of total dimension aging score among different age groups.
Abbreviation: LOESS=locally weighted regression.In the figure, the black scatter plots represent the standardized scores (Y) for different aging dimensions at each individual’s chronological age (X). The blue curves represent the LOESS curve fits for the overall chronological age (X) and the standardized scores (Y) in different aging dimensions.
Based on the LOESS fitting results, we can hypothesize that there is an inflection point in the aging process at different ages. Furthermore, our analysis using the ROC curve demonstrated that, except for the psychological dimension in the young elderly group, the predictive value of the inflection point age in all dimensions was statistically significant (P<0.05) and had an area under the curve (AUC) greater than 0.500 (Table 2).
Age group Dimension AUC (95% CI) Sensitivity Specificity Youden index Inflection point age P-value Middle-aged Total 0.694 (0.658, 0.729) 0.599 0.713 0.3124 53.16 0.0001 Physiological 0.709 (0.673, 0.743) 0.604 0.724 0.3276 53.18 0.0001 Psychological 0.547 (0.508, 0.585) 0.789 0.311 0.1000 48.00 0.0344 Social 0.661 (0.573, 0.648) 0.548 0.654 0.2019 53.09 0.0001 Young elderly Total 0.658 (0.625, 0.691) 0.645 0.602 0.2473 66.33 0.0001 Physiological 0.703 (0.670, 0.734) 0.608 0.703 0.3111 67.73 0.0001 Psychological 0.539 (0.504, 0.574) 0.279 0.809 0.0878 70.25 0.0547 Social 0.566 (0.531, 0.600) 0.311 0.821 0.1322 70.00 0.0011 Elderly Total 0.697 (0.633, 0.755) 0.483 0.836 0.3190 81.20 0.0001 Physiological 0.745 (0.684, 0.800) 0.776 0.621 0.3966 78.87 0.0001 Psychological 0.610 (0.544, 0.674) 0.440 0.793 0.2328 81.20 0.0029 Social 0.594 (0.528, 0.658) 0.672 0.509 0.1810 78.44 0.0118 Abbreviation: ROC=receiver operator characteristic; AUC=area under curve; CI=confidence interval. Table 2. ROC analysis of aging inflection point age among different age groups in Jiangxi Province, China, 2020–2022.
To investigate the predictive value of the inflection point age on the degree of aging, we conducted a binary logistic regression analysis. The dependent variable Y represented the original aging degree score (0=not aging, 1=aging), while the independent variable X represented the newly divided aging degree score (comparison group: 1=greater than inflection point age, reference group: 2=less than inflection point age). We controlled for three types of confounding effects in the analysis.
The results indicated that the OR values [95% confidence interval (CI)] were consistently greater than 1.000. This suggests that aging deepens in individuals older than the inflection point age, particularly in the physiological dimension of the elderly group. The greatest risk of aging was observed in individuals aged above 78.87 years old (OR=5.290). Considering the overall aging situation, the risk of aging was highest in the elderly group, followed by the middle-aged group, and lowest in the young elderly group (OR elderly: 4.867 >OR middle-aged: 4.472 >OR young elderly: 2.454).
Among the three age groups, the risk of aging in the social dimension was higher than that in the psychological dimension. The logistic regression model had a C-index (95% CI) greater than 0.700, indicating that the age of the inflection point possesses predictive value for the transition of aging. The Hosmer-Lemeshow test confirmed that the predicted results and the actual aging results for each age group were consistent (P1>0.05), suggesting an ideal degree of model calibration (Table 3).
Age group Dimension β S.E. Wald P-value OR 95% CI C-index 95% CI P1 Middle-aged Total 1.498 0.192 60.824 0.001 4.472 3.069, 6.516 0.782 0.749, 0.813 0.340 Physiological 1.540 0.194 63.324 0.001 4.666 3.193, 6.819 0.786 0.753, 0.816 0.254 Psychological 1.413 0.222 40.364 0.001 4.108 2.657, 6.353 0.766 0.733, 0.798 0.550 Social 1.436 0.191 56.745 0.001 4.203 2.893, 6.107 0.779 0.745, 0.809 0.322 Young elderly Total 0.898 0.162 30.734 0.001 2.454 1.787, 3.371 0.775 0.745, 0.803 0.833 Physiological 0.893 0.163 29.966 0.001 2.442 1.774, 3.361 0.773 0.743, 0.802 0.305 Social 1.582 0.364 18.923 0.001 4.867 2.386, 9.929 0.800 0.743, 0.850 0.255 Elderly Total 1.666 0.360 21.375 0.001 5.290 2.611, 10.720 0.809 0.753, 0.858 0.756 Physiological 1.582 0.364 18.923 0.001 4.867 2.386, 9.929 0.800 0.743, 0.850 0.255 Psychological 1.604 0.356 20.269 0.001 4.974 2.474, 10.001 0.807 0.750, 0.855 0.744 Social 1.498 0.192 60.824 0.001 4.472 3.069, 6.516 0.782 0.749, 0.813 0.340 Abbreviation: OR=odds ratio; CI=confidence interval. Table 3. Logistic regression model validation results for the inflection point age of women among different age groups and dimensions in Jiangxi Province, China, 2020–2022.
-
This study found that middle-aged and older adults, younger older adults, and older women experience accelerated aging at 48.0–53.2, 66.3–70.0, and 78.4–81.2 years of age, respectively. However, our findings do not completely align with the classical view regarding the inflection point of aging, which suggests that the peak of aging occurs at 34, 60, and 78 years of age (5). It is important to note that aging rates may differ among races due to variations in lifestyle characteristics, diet, and behavior between Eastern and Western populations. Nevertheless, our results are consistent with those of the Quzhou women’s cohort study, which used a multicohort analysis and observed significant aging changes in women at age 50 (6). It should be emphasized that this particular cohort consisted of only 113 women and required substantial time and labor for physical examinations, transcriptome testing, and plasma metabolic analyses.
The aging process of middle-aged Chinese women is influenced by menopause, which typically occurs between the ages of 48 and 52. During this period, there is a decrease in estrogen secretion, leading to various physiological changes such as decreased sexual function and aging-related symptoms like hot flashes, night sweats, insomnia, anxiety, and nervousness (7).
Furthermore, aging among younger elderly women occurs before the age of 70, which reinforces societal biases and stereotypes associated with being “old and useless.” Retirement often leads to increased responsibilities and stress, reduced leisure time, and limited socialization, all of which can have negative effects on their physical and mental well-being, thus accelerating the aging process (8).
A study has shown that women falls are most common among those aged 75 to 85 (9). These falls often lead to a fear of falling (10), and they account for 45.24% of women injury-related deaths in China (11). This serious decline in quality of life and functional abilities further emphasizes the impact of aging (9).
This study has several limitations. First, our survey only included community-based women residents in Jiangxi Province and did not include hospitalized elderly women. As a result, the actual inflection point of aging may be underestimated in the findings of this study. Additionally, the sample size of elderly women in our survey was small, leading to potential errors and limiting the generalizability of our results. Therefore, further studies with larger sample sizes are needed to calculate the inflection point ages separately for urban and rural women. These future studies should also consider the short-term effects of diseases on aging.
Despite these limitations, our findings are robust for several reasons. First, our study encompassed a large and representative sample, across various regions with different GDP levels in Jiangxi Province. This allows for a comprehensive understanding of the population aging phenomenon in the area. Second, we carefully controlled for confounding factors when fitting our mathematical model, ensuring accurate and reliable results. Lastly, our study adopted a macro-level approach, and the obtained results align with contemporary micro studies. This not only makes our study feasible but also adds validity to our findings. In conclusion, our research contributes to a deeper understanding of aging and the natural laws governing it. It also provides valuable insights for implementing preventive measures against aging in middle-aged and elderly women.
-
No conflicts of interests.
HTML
| Citation: |

|