
 Download:


-
Vitamin A is critical for the growth, development, visual function, and immune response of children, as along with other physiological processes (1). It is a leading cause of preventable childhood blindness and significantly contributes to both child morbidity and mortality (2). A World Health Organization (WHO) report from 2009 revealed that vitamin A deficiency (VAD) affects more than 190 million preschool-aged children globally, with a disproportionately higher prevalence in developing countries (3-4). Previous research has predominantly been focused on VAD in children under five and pregnant women (4-5), with limited data available for school-aged children. Nutrition Improvement Programme for Rural Compulsory Education Students (NIPRCES) is a government-funded plan aiming to improve malnutrition among children and adolescents in primary and secondary schools in Chinese rural areas (6-7). This paper presents findings on the prevalence of VAD and sub-clinical VAD (SVAD) among school-aged children in rural areas served by NIPRCES from 2012 to 2021. The results indicate a slight improvement, yet the issue remains significant and warrants continued attention.
From 2012 to 2017, annual surveys were carried out in 50 pilot counties across 22 provincial-level administrative divisions (PLADs) in rural China. This scope was expanded in 2021 to include 160 counties in all 31 PLADs. The surveys employed a stratified cluster sampling strategy, targeting approximately 360 students aged 6 to 17 years old within each county for the initial period. For the 2021 analysis, this study included data from 55 national pilot counties located in central and western China out of the expanded sample of 160 counties (6).
Morning fasting venous blood samples were collected from all participants to measure vitamin A levels. Serum was promptly separated, stored, and transported in darkness. Serum retinol concentrations were quantified utilizing High Performance Liquid Chromatography-Mass Spectrometry (HPLC-MS). VAD and SVAD were identified according to the standards set out in the Chinese Method for Vitamin A Deficiency Screening (WS/T 553-2017); concentrations below 0.70 µmol/L indicated VAD, while concentrations ranging from 0.70 µmol/L to 1.05 µmol/L indicated SVAD (8). Statistical analysis was performed with SAS software (version 9.4, SAS Institute Inc., Cary, NC, USA). Serum retinol concentrations were reported as medians with 25th and 75th percentiles. The Wilcoxon test and the Kruskal-Wallis rank-sum test were applied to assess differences between groups.
The total number of subjects from 2012 to 2021 was 7,531, 8,586, 10,468, 12,143, 12,955, 6,224, and 18,023, respectively. Table 1 presents the serum retinol levels across various age categories, sexes, and geographical locations. There was a notable increase in the median serum retinol concentration from 1.07 µmol/L in 2012 to 1.22 µmol/L in 2021. An age-associated rise in serum retinol was observed consistently over the study period (P<0.05). Females exhibited higher serum retinol levels than males from 2014 through 2021 (P<0.05), although the differences were not significant in 2012 and 2013. Geographically, serum retinol concentrations were higher in the western regions compared to central regions in 2012, 2015, and 2016, and lower in the years 2013, 2014, and 2021 (P<0.05).
Variable 2012 2013 2014 2015 2016 2017 2021 N P50 P25–P75 N P50 P25–P75 N P50 P25–P75 N P50 P25–P75 N P50 P25–P75 N P50 P25–P75 N P50 P25–P75 Total 7,531 1.07 0.9–1.27 7,586 1.11 0.94–1.31 10,468 1.13 0.94–1.40 12,143 1.12 0.94–1.29 12,955 1.08 1.05–1.40 6,224 1.19 1.01–1.40 18,023 1.22 1.03–1.43 Gender* Male 2,501 1.09 0.92–1.29 2,422 1.09 0.92–1.29 5,371 1.12 0.94–1.40 6,233 1.12 0.94–1.29 6,562 1.05 1.05–1.40 3,210 1.15 0.98–1.36 9,058 1.21 1.01–1.41 Female 2,424 1.11 0.91–1.31 2,328 1.11 0.93–1.31 5,097 1.15 0.95–1.40 5,910 1.12 0.94–1.33 6,393 1.12 1.05–1.40 2,973 1.19 1.01–1.40 8,965 1.24 1.05–1.46 Age group (years)* 6–8 730 0.99 0.86–1.16 792 1.00 0.86–1.16 1,907 1.05 0.87–1.26 2,101 0.98 0.84–1.15 2,261 1.05 0.91–1.22 1,003 1.08 0.94–1.26 3,081 1.12 0.95–1.32 9–11 1,221 1.05 0.88–1.23 1,378 1.05 0.89–1.23 3,017 1.08 0.94–1.33 3,907 1.05 0.91–1.22 4,092 1.05 0.98–1.40 2,035 1.12 0.98–1.33 5,980 1.17 1.00–1.37 12–14 1,121 1.19 0.99–1.38 1,192 1.14 0.98–1.36 3,561 1.19 0.98–1.46 3,792 1.15 0.98–1.36 4,248 1.26 1.05–1.40 2,113 1.22 1.05–1.40 6,000 1.28 1.08–1.48 15–17 770 1.30 1.08–1.54 700 1.26 1.06–1.49 1,983 1.23 1.05–1.54 2,343 1.22 1.05–1.43 2,304 1.40 1.05–1.47 1,057 1.29 1.12–1.50 2,879 1.36 1.13–1.59 Region Central 2,990 1.06 0.9–1.25 2,910 1.13 0.96–1.33 3,999 1.19 0.99–1.47 5,492 1.08 0.94–1.29 5,373 1.05 1.05–1.40 1,384 1.19 0.98–1.36 4,642 1.22 1.05–1.43 Western 4,541 1.08 0.9–1.29 4,676 1.10 0.93–1.3 6,469 1.08 0.91–1.37 6,651 1.12 0.94–1.33 7,582 1.15 1.05–1.40 4,840 1.19 1.01–1.40 13,381 1.22 1.02–1.43 * Variables of age group and genders have some missing data in 2012, 2013, 2017 and 2021. Table 1. Serum retinol concentrations of vitamin A (µmol/L) based on age, gender and region from 2012–2021.
The prevalence rates of SVAD and VAD fluctuated over the seven-year period, as illustrated in Figure 1. The highest occurrence of SVAD and VAD was recorded in 2013, at 38.1% and 4.1%, respectively, while the lowest rates were observed in 2016, at 20.0% for SVAD and 1.5% for VAD.
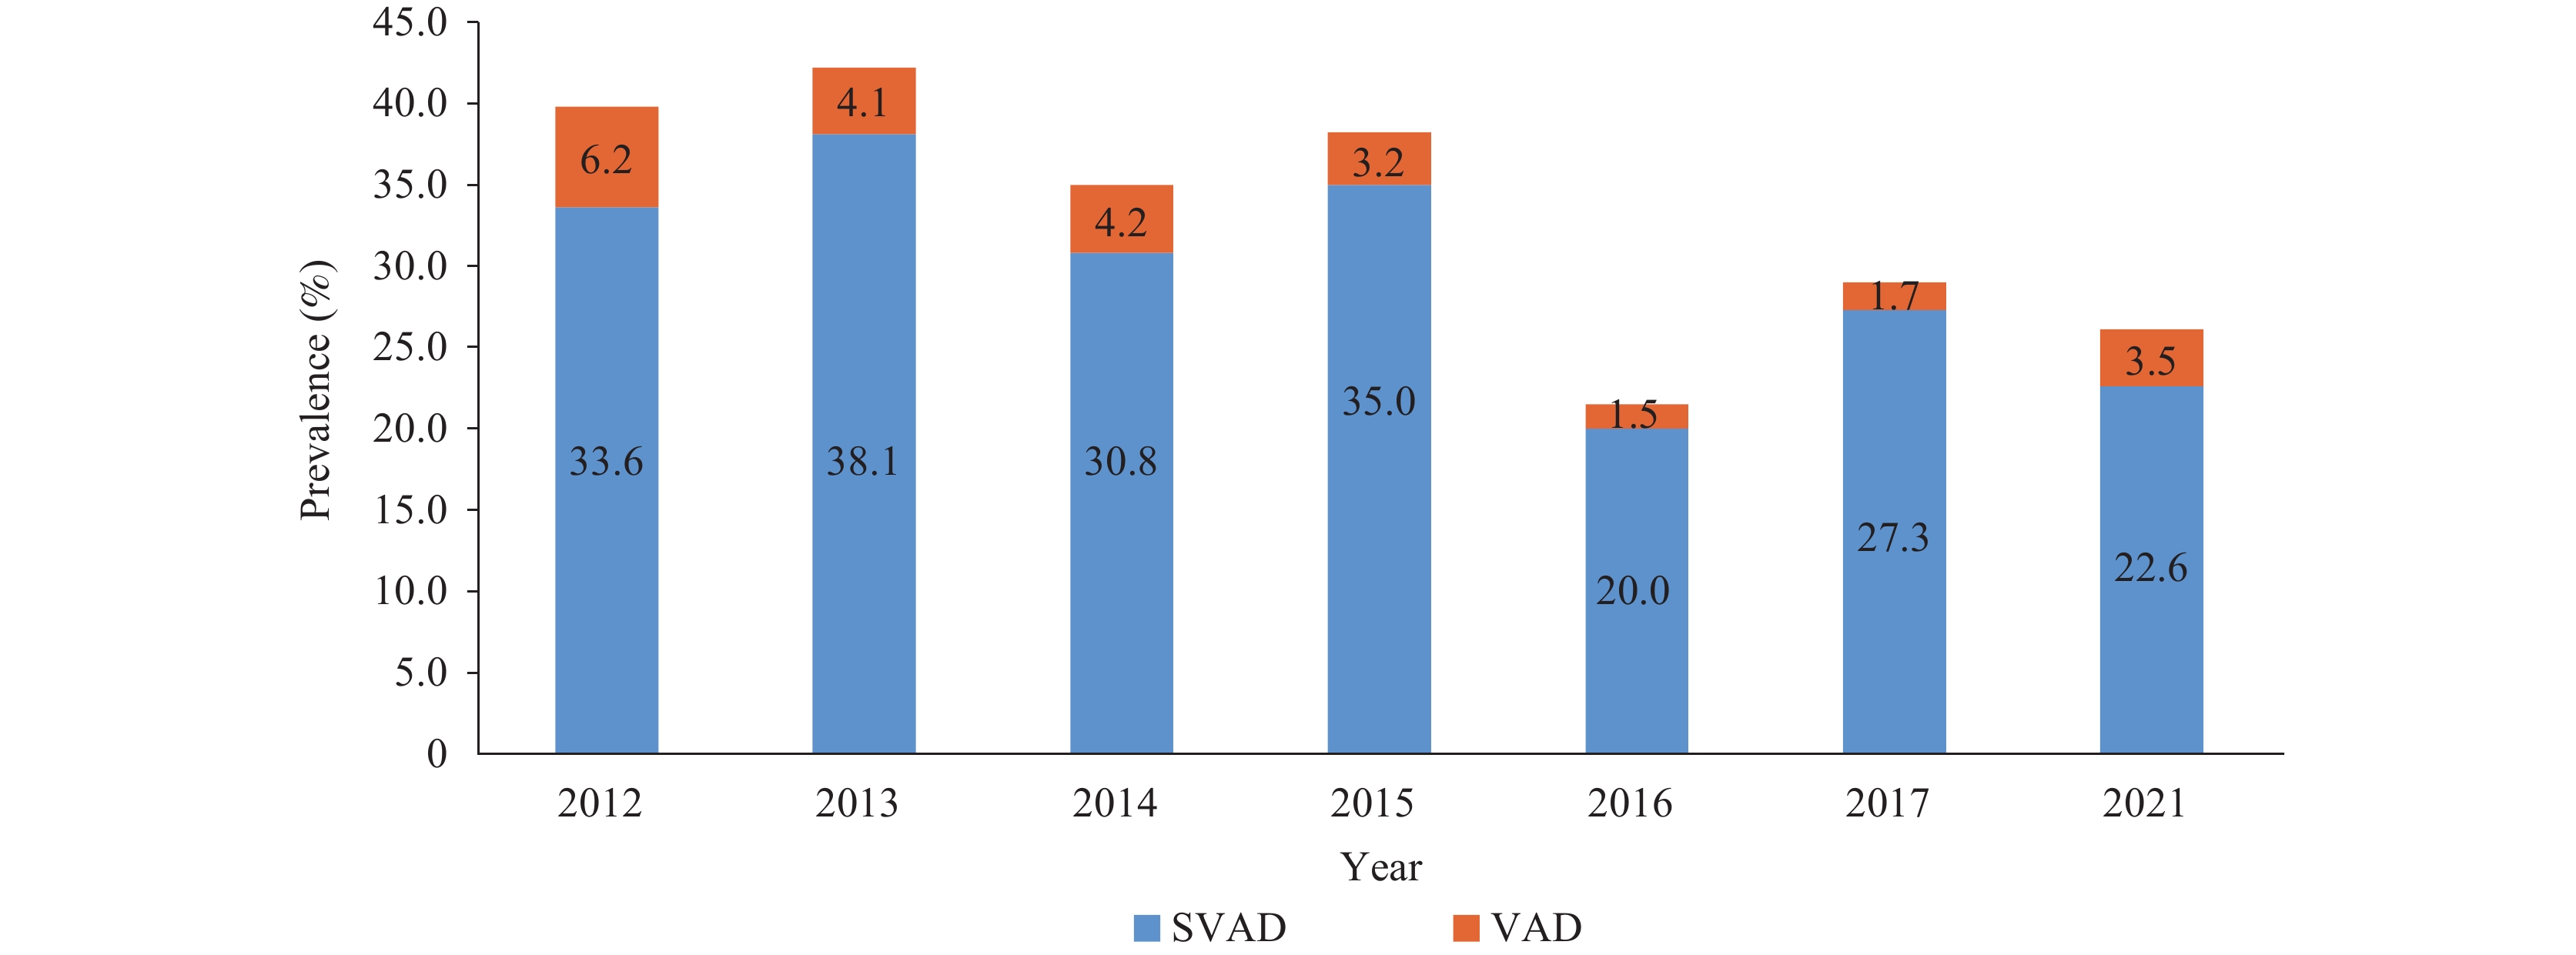 Figure 1.
Prevalence of sub-clinical VAD and VAD in children aged 6 to 17 years from 2012 to 2021.
Abbreviation: VAD=vitamin A deficiency; SVAD=sub-clinical vitamin A deficiency.In Figure 2, prevalence of SVAD and VAD among different age groups from 2012 to 2021 is depicted. For the age group of 6–8 years, VAD prevalence decreased from 8.1% to 4.6%, and for the 15–17 years age group, it decreased from 2.6% to 1.7%.
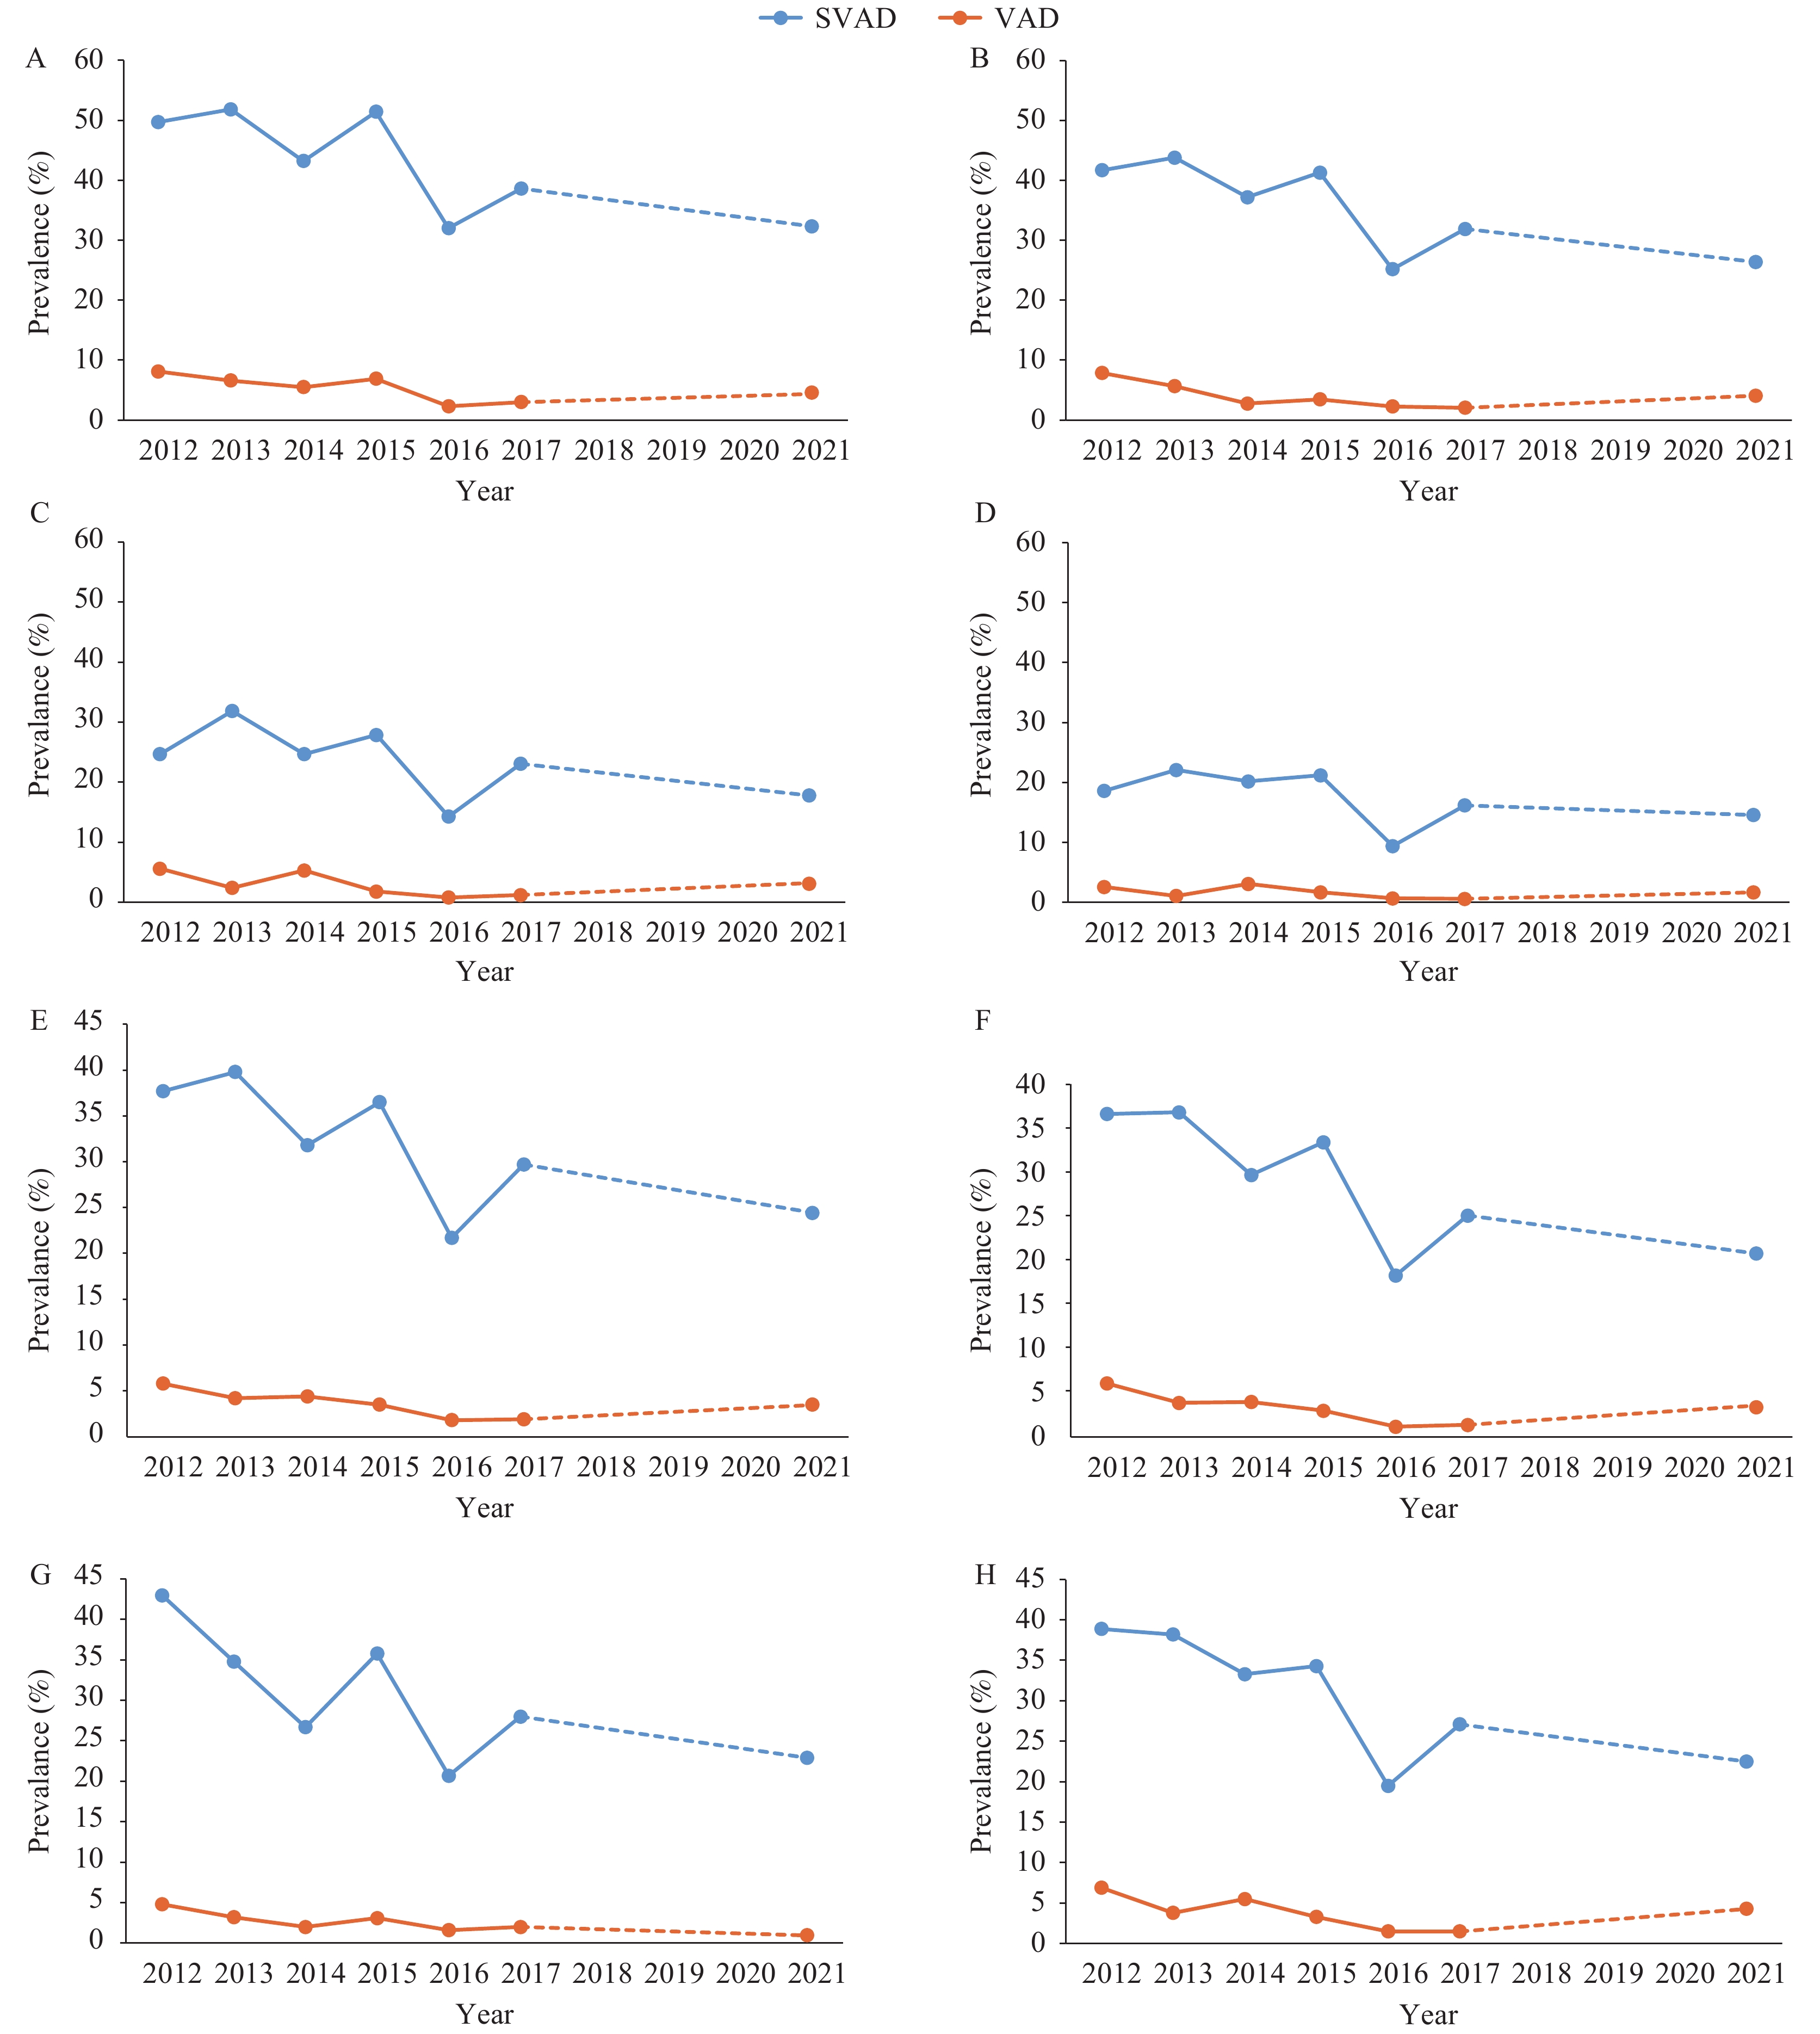 Figure 2.
Prevalence of SVAD and VAD in different age groups, sexes, and areas from 2012 to 2021. (A) 6–8 years age group; (B) 9–11 years age group; (C) 12–14 years age group; (D) 15–17 years age group; (E) Male; (F) Female; (G) Central area; (H) Western area.
Abbreviation: VAD=vitamin A deficiency; SVAD=sub-clinical vitamin A deficiency.The VAD in males from 2012 to 2021 was recorded as follows: 5.8%, 4.2%, 4.4%, 3.5%, 1.8%, 1.9%, and 3.5%, respectively. Correspondingly, the rates for females were 6.1%, 3.9%, 4.0%, 3.0%, 1.2%, 1.4%, and 3.4%. During the period from 2013 to 2021, the prevalence of VAD was consistently higher in males compared to females, evidencing a decline from 5.8% to 3.5% in males, and a decrease from 6.1% to 3.4% in females (Figure 2).
The VAD of western areas from 2012 to 2021 was 6.9%, 3.8%, 5.5%, 3.3%, 1.5%, 1.5% and 4.3%, and that of central areas was 4.8%, 3.2%, 2.0%, 3.1%, 1.6%, 2.0% and 1.0%, respectively. Notably, the VAD prevalence was higher in western regions compared to central regions in 2013, 2014, and 2021, but the differences were not statistically significant in 2012, 2015, 2016, and 2017 (Figure 2).
-
This study revealed a modest improvement in vitamin A status among students aged 6–17 years in the central and western regions of China enrolled in the NIPRCES over a decade (2012–2021), with VAD prevalence declining from 6.2% to 3.5%. Nonetheless, the rates of severe VAD (SVAD) and VAD reported here exceeded those found in two other contemporary nationwide surveys in China. The Chinese Health and Nutrition Survey (2010–2012) recorded VAD and SVAD prevalence rates of 5.5% and 18.8%, respectively, in rural areas, while the rates were 1.2% and 18.1% according to the China Nutrition and Health Surveillance of Children and Lactating Mothers (2016–2017) (9-10). Additionally, a 2017 survey in Beijing documented lower prevalence rates of 0.1% for VAD and 10.5% for SVAD, compared to our findings (11). Dietary intake, as the primary risk factor for VAD, is influenced by economic conditions, healthcare access, food fortification, and dietary habits (3-4). The areas surveyed in our study, with their less developed economies, limited transportation, and traditional diets relying heavily on plant-based foods, might contribute to the observed higher VAD rates (12). Nevertheless, China exhibits lower VAD prevalence when compared to other developing nations, such as India, where VAD affects 19.3% of school-aged children as reported in the National Nutrition Survey 2016 (5,13). Furthermore, our results indicated a higher prevalence of VAD in the western regions compared to central areas, likely due to the aforementioned factors.
Our study revealed an increase in serum retinol concentration with age in both male and female subjects, consistent with the findings reported in other studies (9-11,13). The WHO and data from various developing nations typically concentrate on the vitamin A nutritional status of children under five years old, where the incidence of VAD is relatively higher (14). Our data suggest that VAD in preschool children could persist into later childhood but may gradually improve with the diversification of diet that comes with age. Between 2012 and 2021, the prevalence of SVAD and VAD among the four age groups studied showed a marginal decline. Specifically, the prevalence of SVAD in the 6–8 year age group dropped from approximately 50% to one-third, mirroring the trend observed in VAD prevalence. This positive change could stem from the enhanced quality of school meals subsidized by the NIPRCES (6). Furthermore, from 2014 to 2021, male subjects exhibited a higher prevalence of VAD compared to females, aligning with findings from other Chinese studies (12). The period from 2012 to 2021 saw more pronounced reductions in SVAD and VAD among females compared to males. Consequently, there is a need to focus on improving the vitamin A nutritional status in males and younger children.
Our study is subject to several limitations. First, the sample size over the seven-year period was inconsistent, potentially affecting the comparability across different years. Second, the assessment of serum retinol levels was not conducted continuously between 2012 and 2021, precluding a comprehensive evaluation of the trend of VAD throughout the entire decade.
In conclusion, following the implementation of the NIPRCES in 2012, which offered meal subsidies to students in rural areas, there has been a marked improvement in the VAD nutritional status among rural children in China. Despite these advancements, the prevalence of VAD and SVAD remains relatively high, particularly among male students, younger children, and those residing in the western regions of the country. To address this issue, strategies such as providing expert nutritional planning for school meals, enhancing nutrition education to promote healthier eating habits, and the fortification of foods with vitamin A are essential steps toward eradicating VAD.
-
No conflicts of interest.
-
Our gratitude to project teams at the China CDC, as well as provincial, city, and county-level CDCs, the Ministry of Education, local school staff, and all participants. Dr. Kun Zhu for his invaluable comments and suggestions.
HTML
| Citation: |

|