

 Download:


-
As the population ages steadily in most countries around the world, it has become an increasing research priority to quantify the deaths associated with population aging globally, nationally, and locally. All existing decomposition approaches use changes in age structure to approximate population aging (1–3). This method does not precisely measure deaths associated with population aging and becomes especially problematic in situations where the proportion of old adults increases but the number decreases, such as when conflicts or wars cause more deaths among young and middle-aged adults than among older adults. Recent situations in Iraq and Syria offer examples (1,4-5).
To address gaps in available research evidence caused by methodological limitations in existing decomposition methods, we developed a novel decomposition method. This new method was applied to data from the Global Burden of Disease Study 2019 (GBD 2019) to calculate the worldwide deaths related to population aging between 1990 and 2019. Additionally, we evaluated whether the benefits of improving population health through mortality reduction were greater than the health loss associated with population aging.
-
Unlike previously published decomposition methods that approximate changes in age structure as population aging (1–3), the new method defines the increase in the number of old adults as population aging. Detailed derivation of the new decomposition method and a comparative evaluation of its performance versus two of the most-cited decomposition methods (number-based and rate-based methods) can be found in
Supplementary Material . We chose the number-based method developed by Cheng et al. (3) as a comparator because it has clear advantages compared to alternatives. We also selected the widely-used rate-based decomposition method as the other comparator (6). Four countries, which experienced inconsistent changes in the number and proportion of old adults between 1990 and 2019, were selected to create four scenarios for comparing the performance across the three decomposition methods.All data were derived from online resources of the GBD 2019, which provides estimates for multiple health outcomes across 369 diseases and injuries, and sex-specific population sizes for 204 countries and territories from 1990 to 2019. Detailed estimation methods for GBD 2019 appeared elsewhere (7-8).
Based on World Bank classifications, we categorized the 204 countries and territories into four income groups: low-income countries (LICs), lower middle-income countries (LMICs), upper middle-income countries (UMICs), and high-income countries (HICs). We conducted disease-specific analyses using the level-3 disease categorization (134 subcategories) defined by the GBD 2019. Populations were divided into 20 age groups, ranging from under 5 years to 95 years and older.
We utilized the novel decomposition method to compute global sex-, disease-, and country/territory-specific fatalities linked to population aging from 1990 to 2019. Bar charts and maps were utilized to visually depict subgroup disparities and geographic variances.
We examined the counteracting effect of reducing mortality rates in relation to population aging by using the ratio (denoted as R) of the number of deaths attributed to mortality reduction divided by that associated with population aging based on previous literature (3,9). As the numbers of deaths attributed to population aging and to reduced age-specific mortality are in opposite directions and sum to the net change in total deaths, R has a clear epidemiological interpretation in measuring the relative effect of mortality reduction and population aging. For the 200 out of 204 countries and territories that experienced population aging between 1990 and 2019, “R≤−1”, “−1<R<0” and “R=0” respectively suggest that the benefit achieved due to mortality reduction “clearly exceeded”, “partially balances” or “does not alleviate” the loss associated with population aging. “R>0” indicates that the mortality increase exacerbates the loss associated with population aging.
All data analyses were performed using R4.2.2 (R Foundation, Vienna, Austria), and the package ‘maps’ was used to draw the maps. The study protocol was approved by the Ethics Committee of Xiangya School of Public Health, Central South University on 26 July 2022 (No. XYGW-2022-46).
-
Global deaths associated with population aging between 1990 and 2019 total approximately 23.3 million, with 12.0 million among men and 11.3 million among women (Figure 1A). UMICs have the largest number of deaths associated with population aging during 1990–2019, with 10.0 million, followed by LMICs (7.0 million), HICs (5.5 million), and LICs (0.8 million) (Figure 1B).
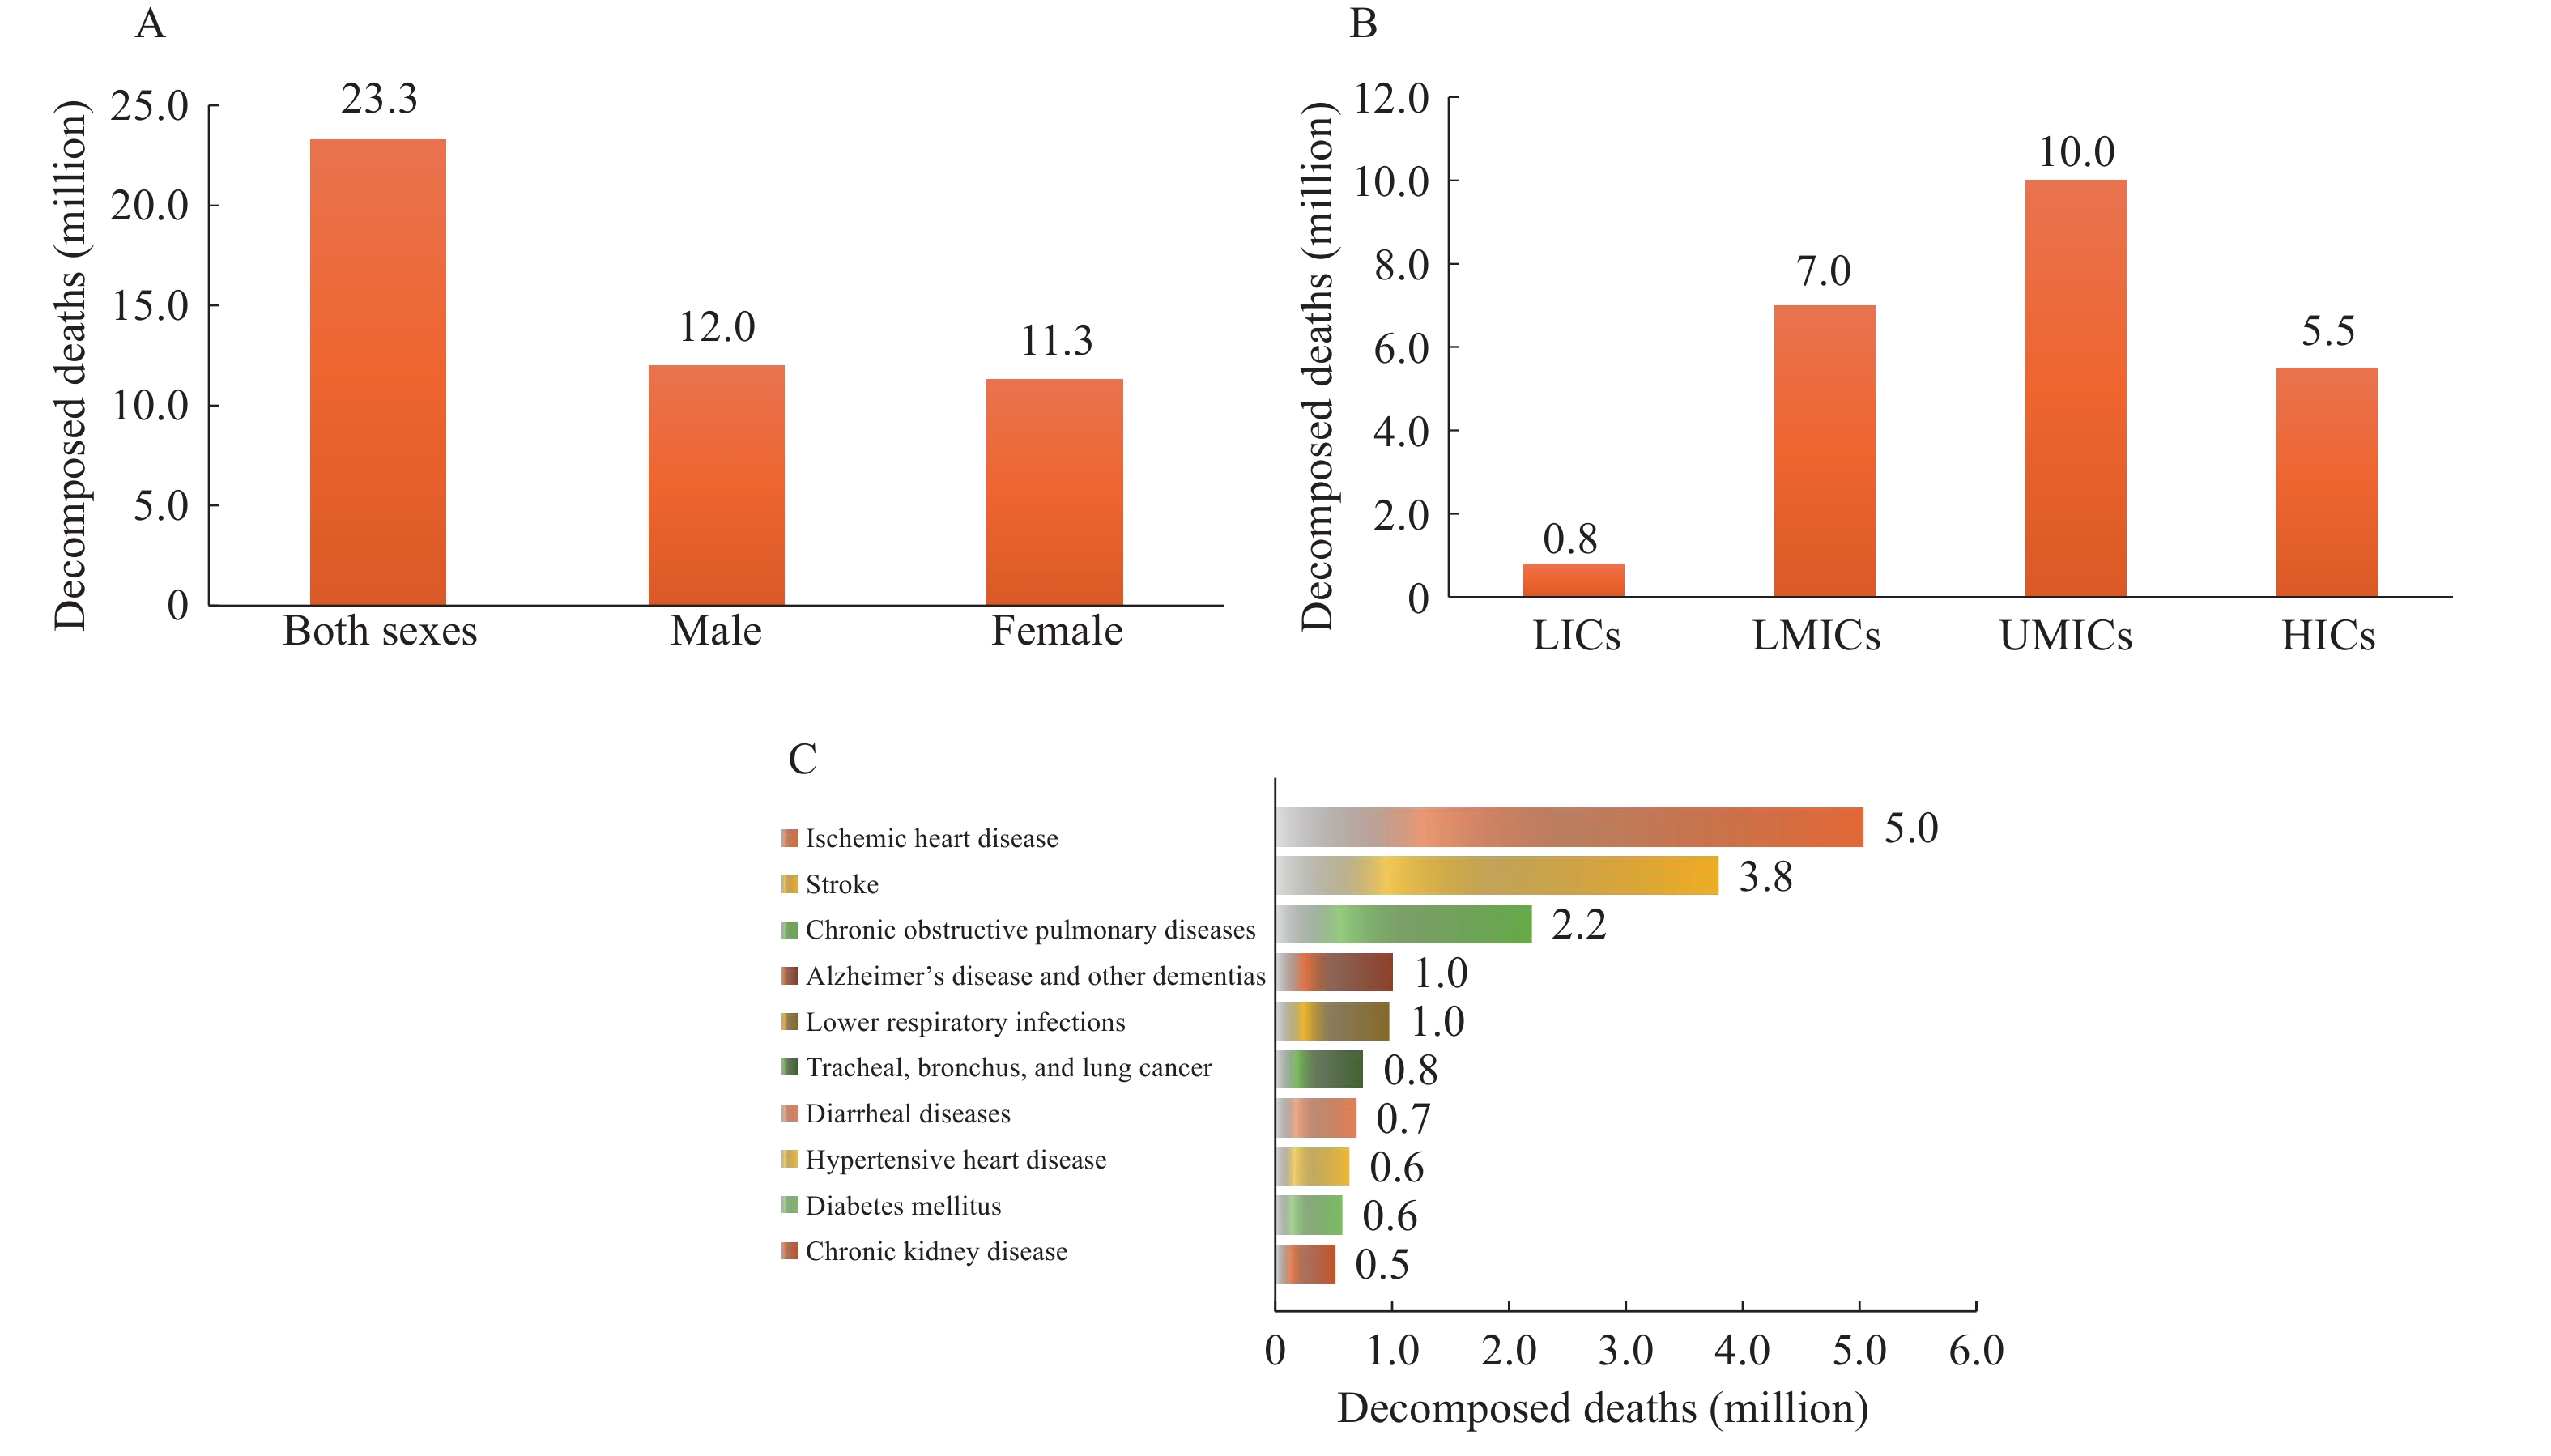 Figure 1.
Global deaths related to population aging between 1990 and 2019 by (A) sex; (B) country income; (C) type of dise.
Abbreviation: LICs=low-income countries; LMICs=lower middle-income countries; UMICs=upper middle-income countries; HICs=high-income countries.The number of deaths associated with population aging vary greatly across different types of diseases between 1990 and 2019 (Figure 1C). The top ten causes of disease accounted for a total of 16.1 million global deaths related to population aging (69.2%); these included ischemic heart disease (5.0 million); stroke (3.8 million); chronic obstructive pulmonary disease (COPD, 2.2 million); Alzheimer’s disease and other dementias (ADOD, 1.0 million); lower respiratory infections (1.0 million); tracheal, bronchus, and lung (TBL) cancer (0.8 million); diarrheal diseases (0.7 million); hypertensive heart disease (0.6 million); diabetes mellitus (0.6 million); and chronic kidney disease (0.5 million).
Of the 200 countries and territories that experienced population aging between 1990 and 2019, the number of deaths associated with population aging varied substantially across countries and territories. China, India, Japan, the United States, and Brazil had the largest number of deaths related to population aging and together accounted for 58.8% of global decomposed deaths. Respective numbers of deaths in those five countries were 6.4 million, 4.4 million, 1.1 million, 1.0 million, and 0.7 million.
Between 1990 and 2019, the number of global deaths averted by reductions in mortality exceeded those associated with population aging (−23.5 million vs. 23.3 million) (Figure 2A). Subgroup analyses show that the decrease in deaths due to mortality reduction completely offsets the increase associated with population aging among males (−12.5 million vs. 12.0 million) and in both LMICs (−8.9 million vs. 7.0 million) and LICs (−3.1 million vs. 0.8 million), but the counteracting effect is only partial in UMICs (−7.8 million vs. 10.0 million) and HICs (−3.6 million vs. 5.5 million) (Figure 2B).
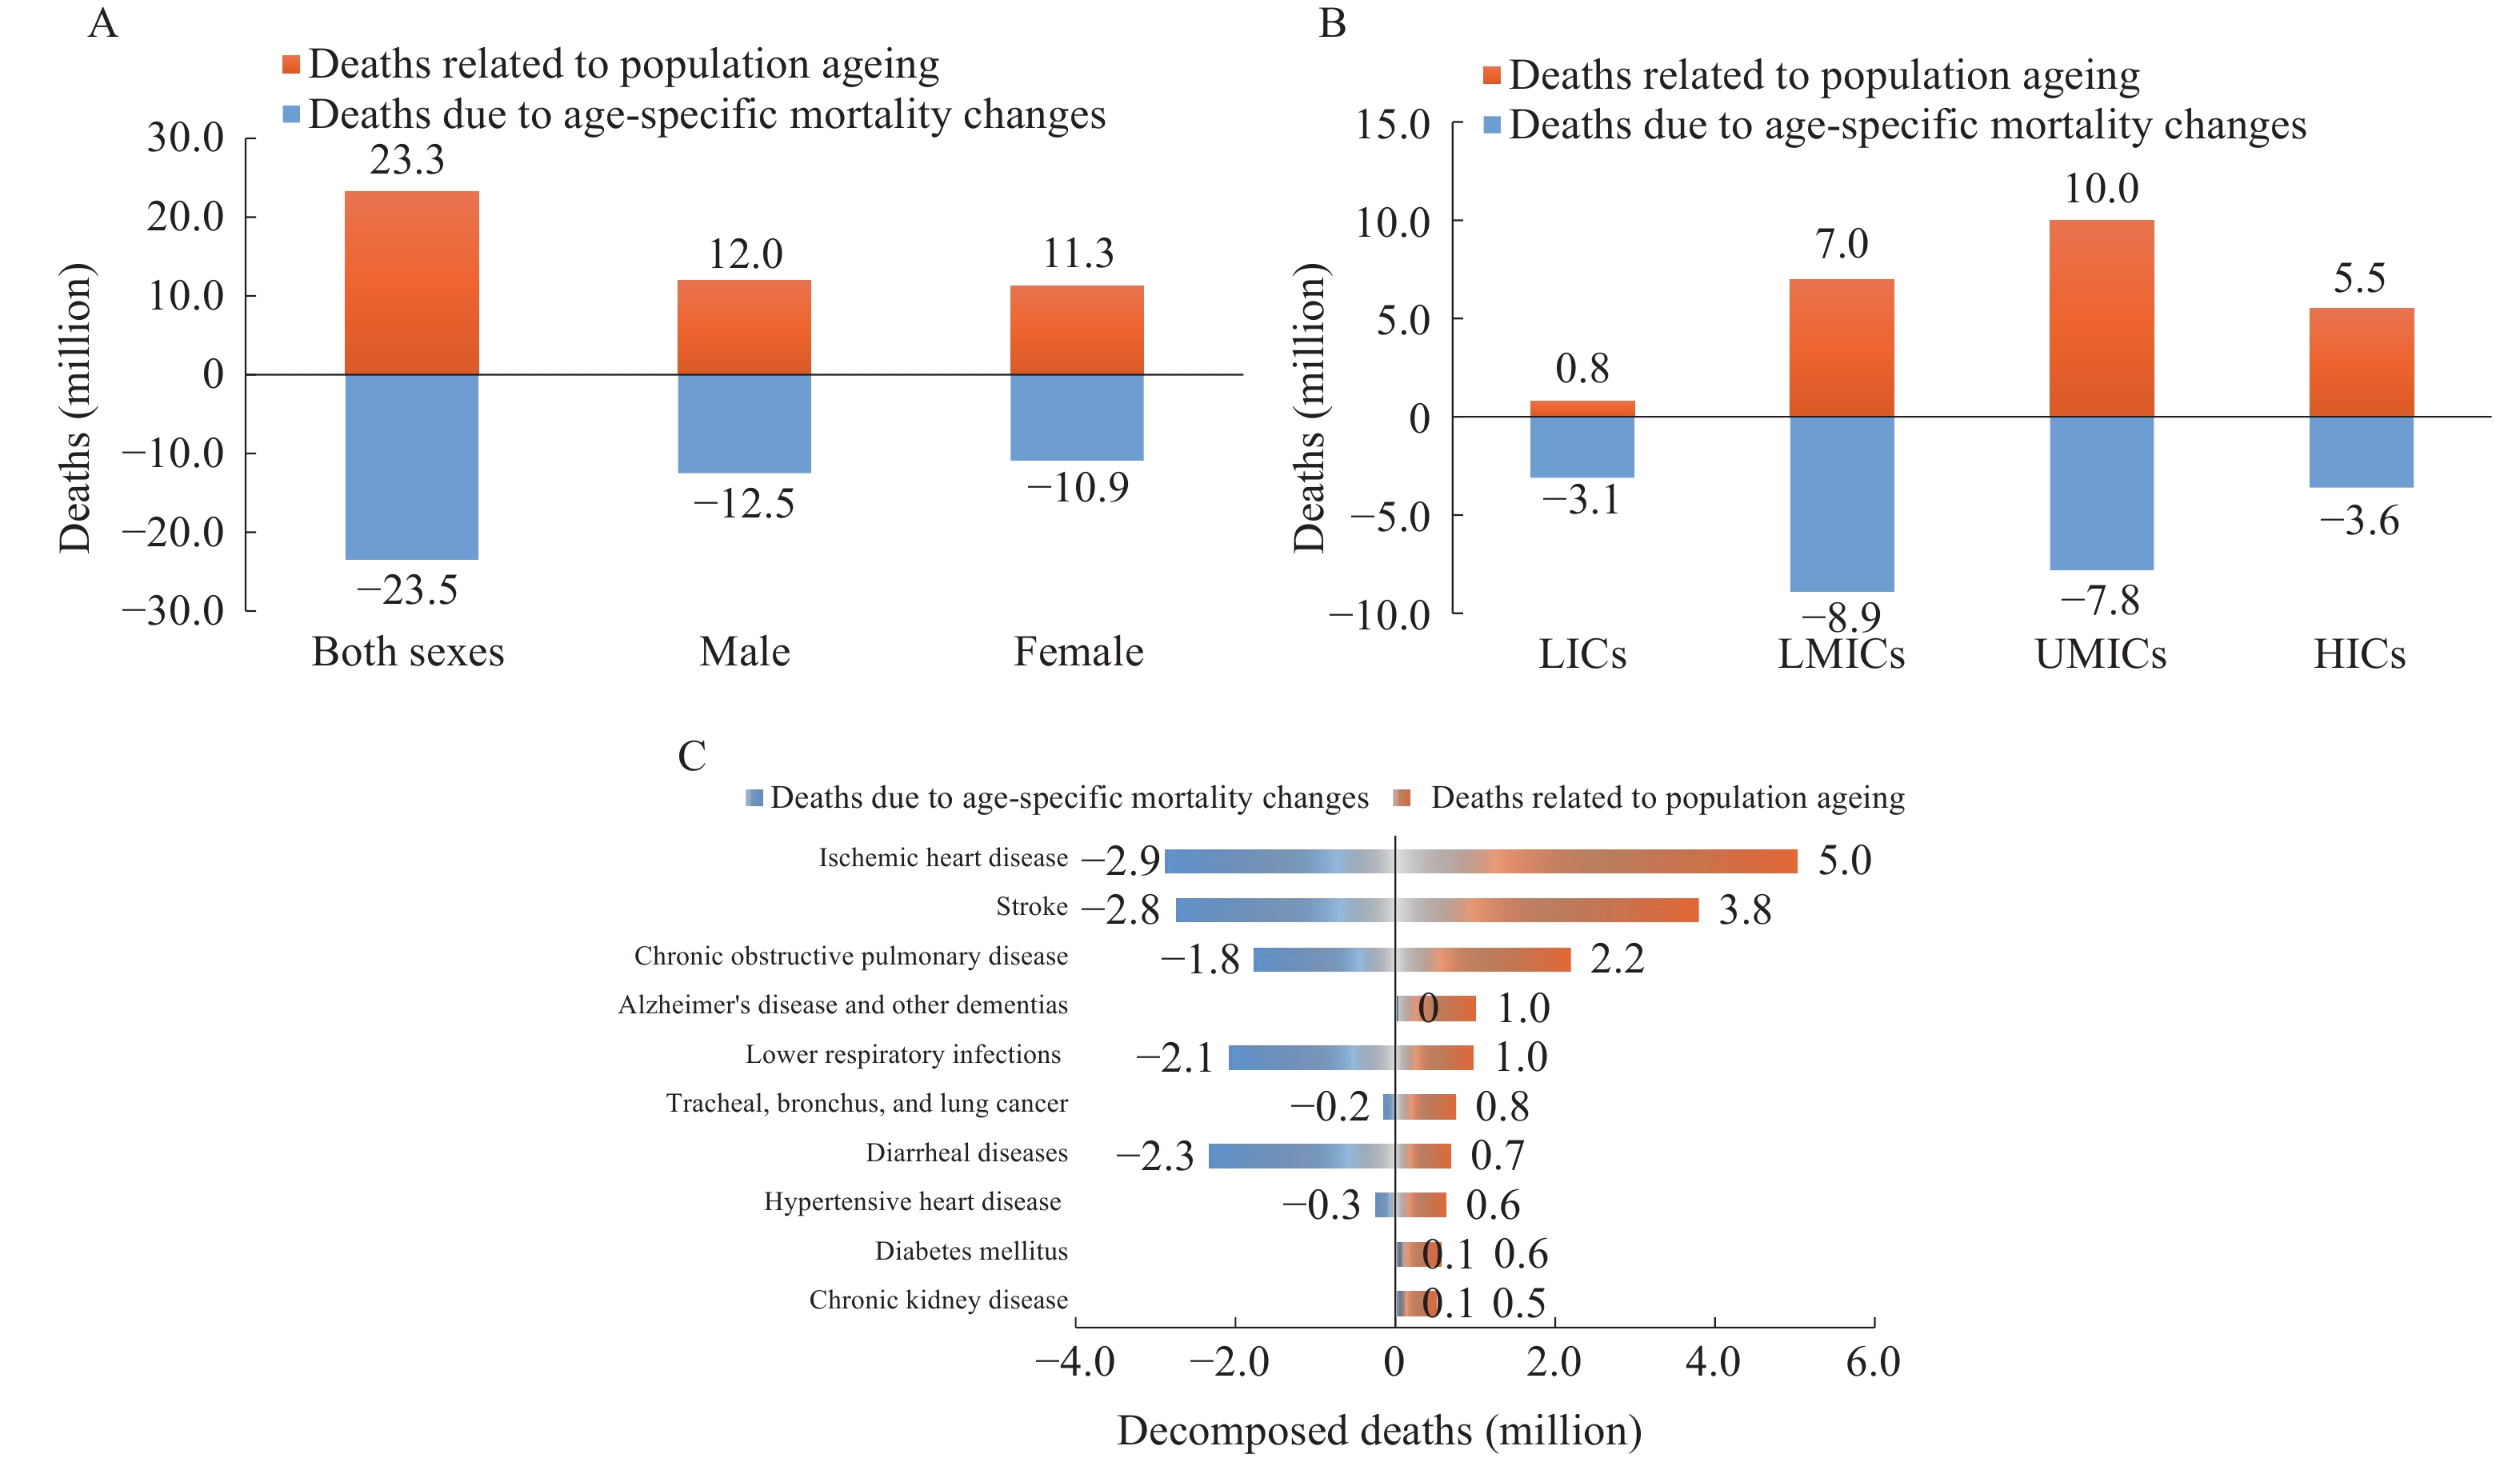 Figure 2.
The counteracting effect of mortality reduction against the loss related to population aging between 1990 and 2019. (A) by sex; (B) by country income; (C) by type of disease.
Among the top ten diseases with the highest mortality rates associated with population aging, the counteracting effect of reduced mortality is most pronounced for lower respiratory infections (−2.1 million vs. 0.96 million) and diarrheal diseases (−2.3 million vs. 0.7 million) (Figure 2C). The reduction in mortality was insufficient to counteract the effects of population aging for five disease types: ischemic heart disease (−2.9 million vs. 5.0 million); stroke (−2.8 million vs. 3.8 million); COPD (−1.8 million vs. 2.2 million); TBL cancer (−0.2 million vs. 0.8 million); and hypertensive heart disease (−0.3 million vs. 0.6 million). Importantly, the increase in mortality intensified the impact of population aging on three disease types: ADOD (0.03 million vs. 1.0 million), diabetes mellitus (0.08 million vs. 0.6 million), and chronic kidney disease (0.1 million vs. 0.5 million).
Of the 200 countries and territories that experienced population aging between 1990 and 2019, the health loss associated with population aging was outweighed by the benefits from mortality reduction in 44.0% (88 of 200 countries/territories, R≤−1), and was partially counteracted in 53.5% (107 of 200, −1<R≤0). The most notable counteracting effect occurred in Tajikistan, with an R of −40.8. In contrast, the health loss related to population aging was not offset at all in five countries (5 of 200, R>0): Lesotho, Eswatini, Zimbabwe, Montenegro, and Ukraine.
-
This study presents two main findings. First, the new decomposition method produced decomposed results that align more closely with logical expectations compared to traditional decomposition methods, estimating a total of 23.3 million deaths associated with global population aging. Second, the number of deaths related to population aging was completely or partially offset by the lives saved as a result of mortality reduction in 195 out of the 200 countries and territories with aging population between 1990 and 2019.
The new decomposition method produces more reliable estimates that align with logical expectations compared to the two most cited methods, as supported by both its theoretical foundation and data illustration (
Supplementary Material andSupplementary Table S1 ). First, it employs the number of elderly individuals to measure population aging, whereas existing decomposition methods use changes in the age structure as a proxy of population aging. This proxy does not accurately reflect the impact of population aging in certain situations, and it can lead to misleading decomposed results. Second, it equally separates the interaction of age-specific population size and age-specific rate, ensuring the robustness of the results regardless of the decomposition order of these two factors, as outlined in theSupplementary Materials .A total of 23.3 million deaths associated with population aging reflects the significant impact of population aging on our society. Substantial differences in the number of deaths associated with population aging across sex, country/territory, country income level, and type of disease generally reflect the combined effects of varying demographics and disparities in socio-economic development. The former is related to the steady rise of older adults due to reduced birth rate and prolonged life expectancy in many countries, while the latter country/territory differences are attributed to variations in economic development, migration, education, and healthcare services (10). For instance, the United States accounted for 23.9% of the global gross domestic product (GDP) (11), but only 4.7% of the global deaths associated with population aging.
Despite the alarming 23.3 million global deaths associated with population aging, our findings also demonstrate that the lives saved due to mortality reduction have completely or partially offset the increased deaths associated with population aging between 1990 and 2019 in almost all countries and territories (195 of 200). However, the counteracting effect of mortality reduction varied across subgroups. Specifically, overall mortality increased in five countries (Lesotho, Eswatini, Zimbabwe, Montenegro, and Ukraine) between 1990 and 2019, exacerbating deaths associated with population aging. These findings highlighted the importance and urgency of reducing mortality disparities across countries and territories.
Our findings have at least three important policy implications. First, we recommend the use of the new decomposition method to calculate health outcome counts associated with population aging. Second, our findings highlight the importance and urgency of taking prevention and control actions to curb the large loss of life related to population aging globally and nationally. Field-proven and cost-effective prevention measures, along with medical treatments for high-mortality diseases among the elderly, should be prioritized and implemented worldwide. Third, globally coordinated efforts and investments should be undertaken to reduce disparities in morbidity and mortality associated with population aging across countries and territories.
This study is primarily limited by the availability and quality of estimates from the GBD 2019 public database. In addition, due to the unavailability of complete data on mortality rates, we are unable to provide 95% uncertainty intervals for our estimates. These limitations could be addressed by including high-quality raw data and methodological innovations in future research.
-
The new method we developed is robust and consistent with logical expectations in calculating deaths associated with population aging compared to the two most cited decomposition methods. Therefore, we recommend researchers and policymakers to use the new decomposition method to calculate deaths (and other health losses) associated with population aging. We also call for coordinated global efforts to address the challenge of population aging, which should include prioritization of preventing and treating leading types of disease, implementation of empirically-supported and cost-effective prevention and treatment measures worldwide, and distribution of international aid to support the most affected countries and territories.
-
No conflicts of interest.
-
Supported by the National Key R&D Program of China (grant number: 2022YFC3603000). The funding source had no role in the study design, data collection, data analysis, data interpretation, the writing of the report, or the decision to submit the article for publication.
HTML
| Citation: |

|