

 Download:


-
The prevalence of diabetes has seen a swift escalation over the past few years. Global age-standardized prevalence for this disease was projected at 6.1% in 2021, with forecasts implying an upsurge to 10% by 2050 (1). Notably, in China, the estimated prevalence of diabetes in adults was 12.4% as of 2018 (2), leading to a substantial health and economic impact on the population.
Dietary habits play a crucial role in both the prevention and management of diabetes (3). Numerous meta-analyses consistently highlight a strong association between the consumption of unprocessed red meat or processed meat and the increased risk of diabetes among Western populations (4-5). However, the results are less conclusive in stratified analyses for Asian populations (5). Given the significant differences in types and quantities of red and processed meats consumed (6), findings from Western demographics may not necessarily hold for Asian populations. Therefore, this meta-analysis examines the relationships between the intake of unprocessed red meat or processed meat and the incidence of diabetes, focusing specifically on prospective cohort studies within Asian populations.
We conducted a thorough search of PubMed, Web of Science, EMBASE, and the Cochrane Library, in addition to perusing the reference lists of retrieved articles up until July 8, 2023, imposing no restrictions on language. Detailed search strategies for each database can be found in
Supplementary Table S1 . Briefly, we focused our search on prospective cohort studies examining the link between the consumption of red and/or processed meat and diabetes risk, restricting our sample population to adults located in Asian countries. Information regarding study registration, inclusion and exclusion criteria, and data extraction procedures are elucidated in theSupplementary Methods .The χ2 and I2 tests were implemented to assess the heterogeneity between studies, with a Pheterogeneity value <0.10 and I2>50% denoting significant heterogeneity. If substantial heterogeneity was established, random-effects models were employed to collect hazard ratios (HRs) and 95% confidence intervals (CIs) for the highest versus the lowest consumption group. If not, fixed-effects models were utilized. The inverse-variance method was invoked to calculate study weights.
Restricted cubic spline regression models were used to configure dose-response relationships between red and/or processed meat consumption and diabetes risk. Publication bias and small-study effects were evaluated using Egger’s test and by visually inspecting funnel plots. Statistical significance was noted with a two-tailed test where P<0.05. All statistical analyses were executed using STATA (version 17.0; STATA Corp., College Station, TX, USA).
In conclusion, we identified a total of 14,125 citations, of which 14,118 were excluded after conducting a thorough examination of the titles, abstracts, or the full text. Finally, seven cohort studies were included in our meta-analysis (
Supplementary Figure S1 ). The populations under study comprised East Asians from China, Japan, and the Republic of Korea, along with Chinese adults living in Singapore. Notably, no study was found from other regions in Asia. Further characteristics of the included studies are demonstrated inSupplementary Table S2 . In six studies, dietary information was garnered through food frequency questionnaires, while a single study employed three consecutive 24-hour dietary recalls.The assessment included a total of 570,296 participants for the evaluation of both red and processed meat consumption, with a further 243,296 participants for unprocessed red meat, and 251,914 for processed meat. Cases of diabetes reported were 21,316, 13,584, and 14,252 for each category, respectively (Table 1). When comparing the highest and lowest consumption groups, the combined HRs and 95% CIs of diabetes were 1.12 (0.98, 1.27) for overall red and processed meat consumption, 1.03 (0.89, 1.20) for unprocessed red meat, and 1.12 (1.06, 1.19) for processed meat consumption (Table 1; Figure 1).
Characteristics No. of studies No. of cohorts No. of cases/ subjects Pooled HR 95% CI P Heterogeneity,
I2 (%)Pheterogeneity P for Egger’s test Total red and processed meat† 3 3 21,316/ 570,296 1.12 0.98, 1.27 0.085 73.0 0.011 0.941 Unprocessed red meat† 4 5 13,584/ 243,296 1.03 0.89, 1.20 0.665 71.1 0.008 0.810 Processed meat§ 5 6 14,252/ 251,914 1.12 1.06, 1.19 <0.001 40.5 0.135 0.876 * Pooled hazard ratios (HRs) and 95% confidence intervals (CIs) for diabetes were comparing the highest intake groups to the lowest groups of red and/or processed meat consumption.
† Results from a random-effects model.
§ Results from a fixed-effect model.Table 1. Meta-analysis of red and/or processed meat consumption and risk of diabetes*.
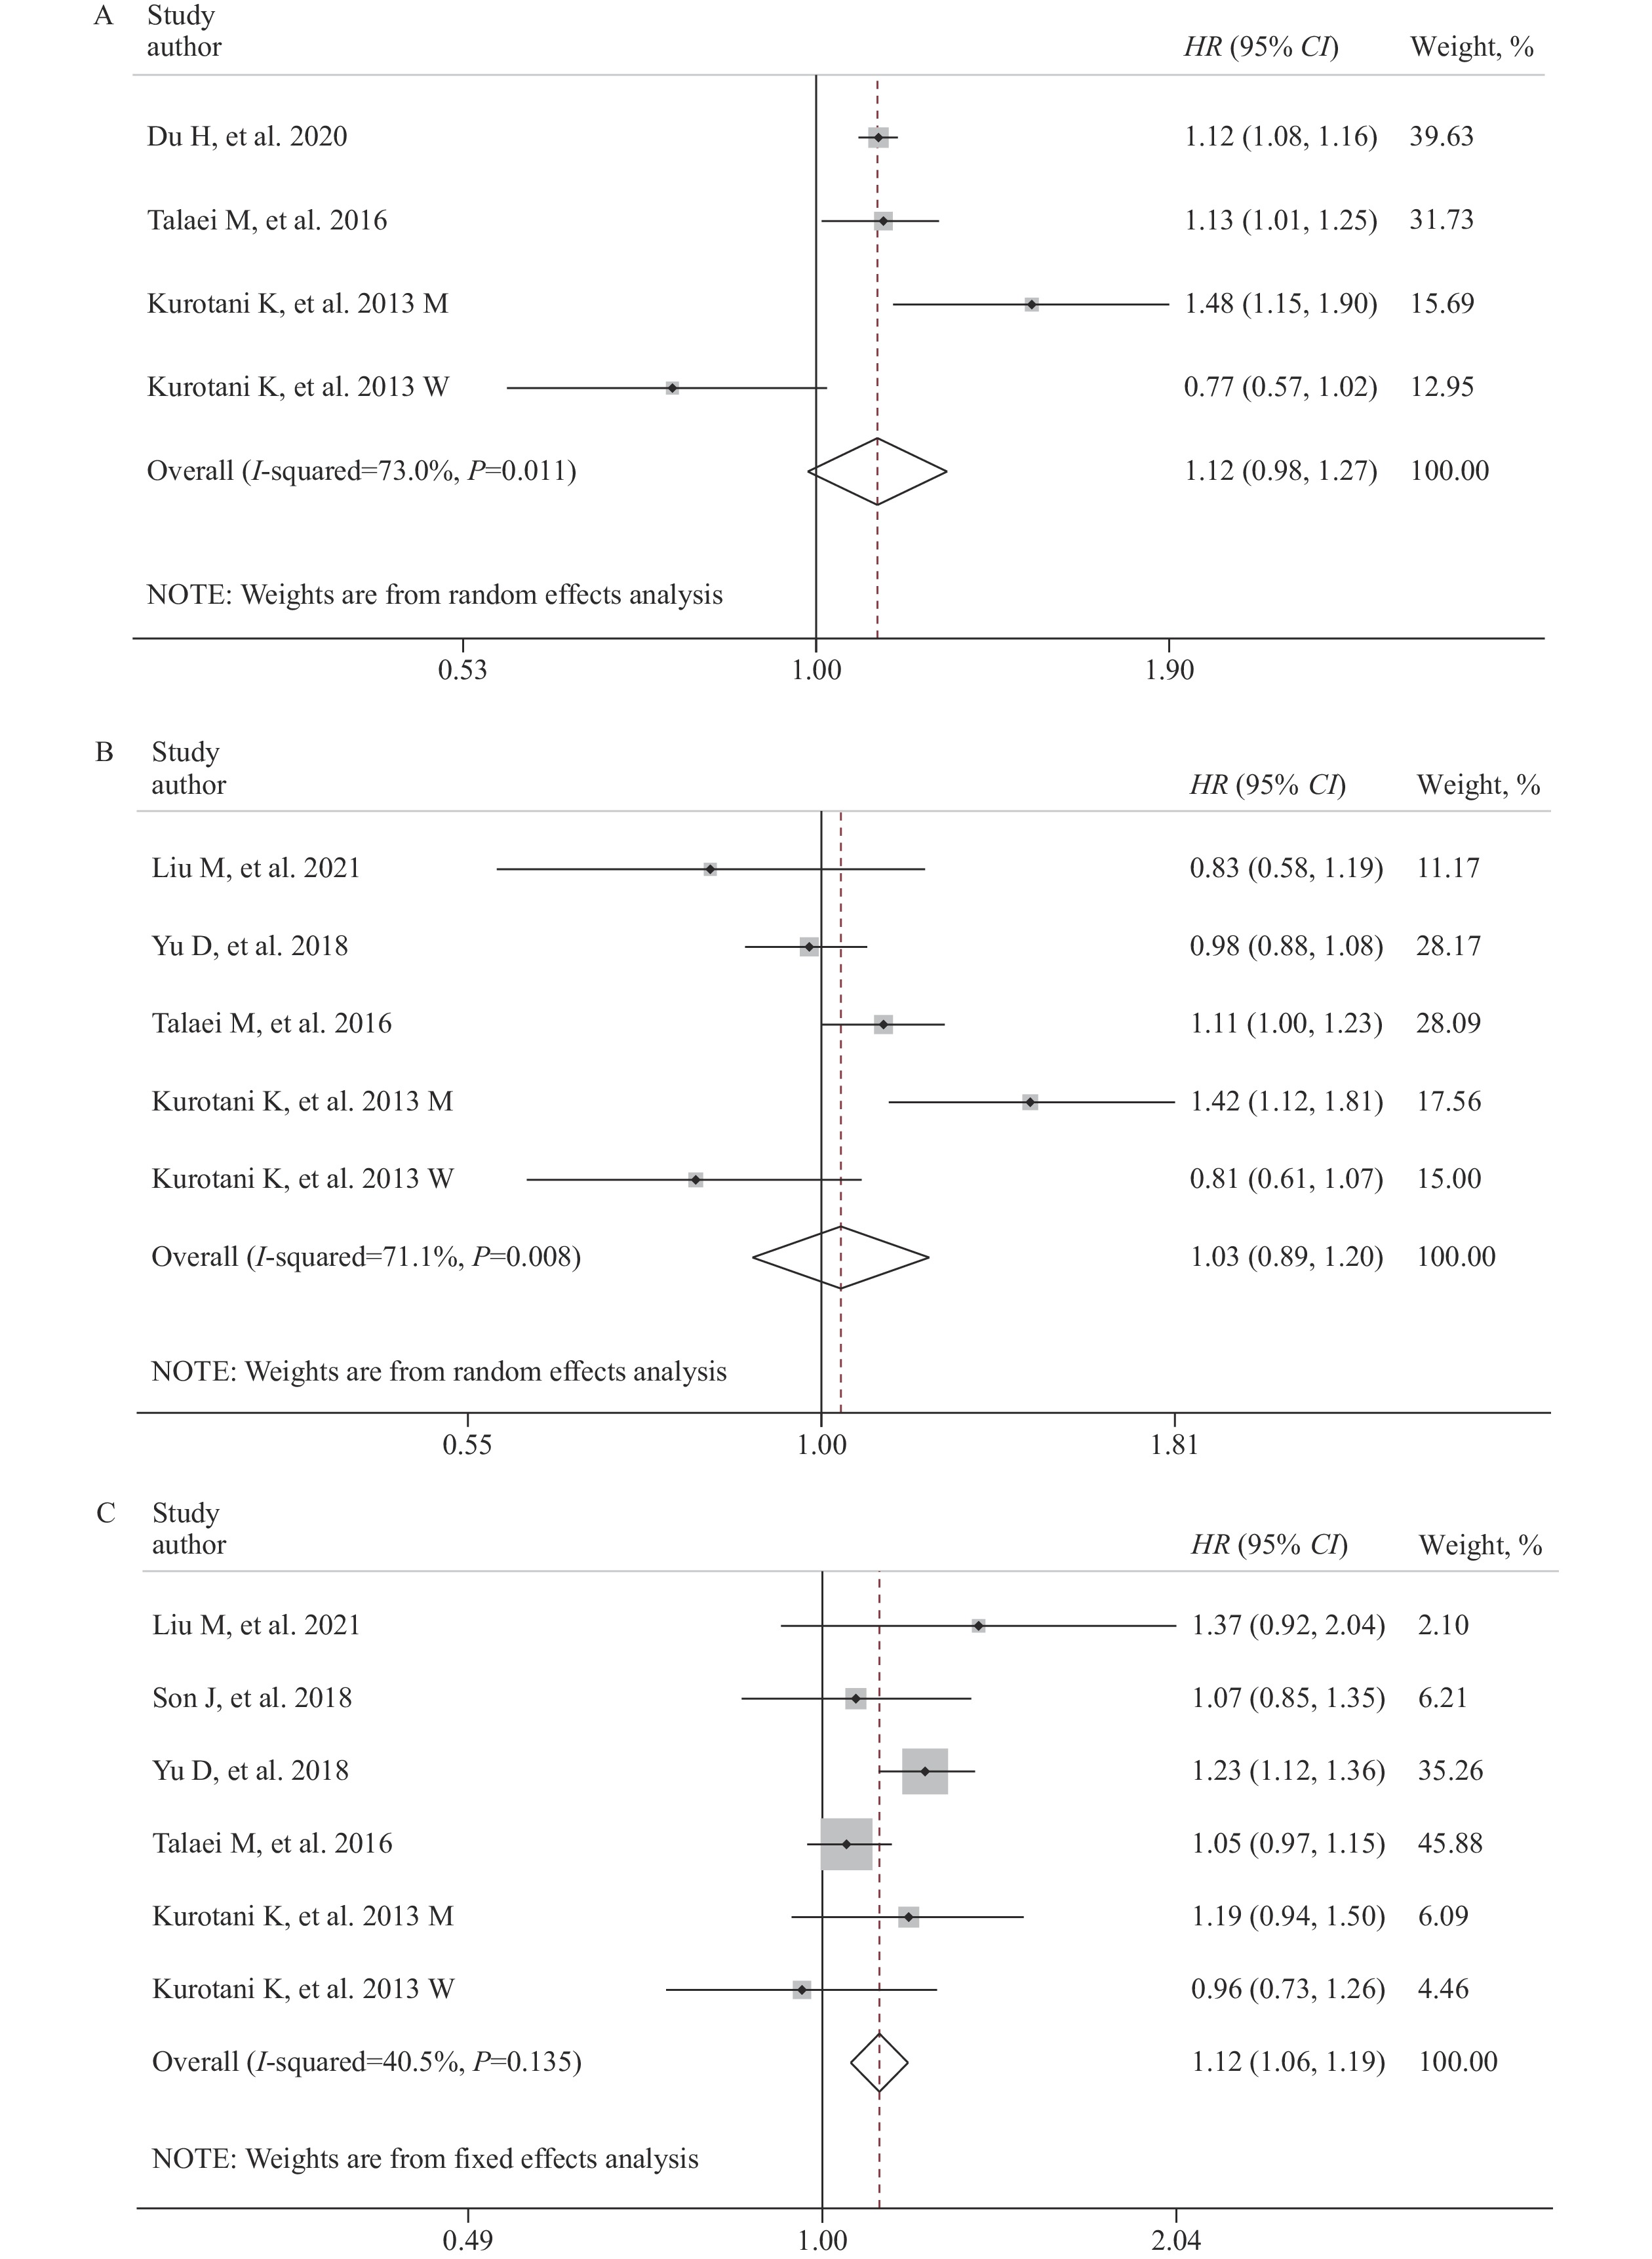 Figure 1.
Hazard ratios (HRs) and 95% confidence intervals (CIs) associated with diabetes for the highest versus the lowest consumption categories of (A) total red and processed meat, (B) unprocessed red meat, and (C) processed meat.
Note: (A) 570,296 individuals with 21,316 cases from the China Kadoorie Biobank, the Singapore Chinese Health Study (SCHS) and the Japan Public Health Center-based Prospective Study (JPHC), (B) 243,296 individuals with 13,584 cases from the China Health and Nutrition Survey (CHNS), the Shanghai Women’s and Men’s Health Study (SW&MHS), SCHS and JPHC, and (C) 251,914 individuals with 14,252 cases from CHNS, the Korean Genome Epidemiology Study, SW&MHS, SCHS and JPHC were included. The black squares represent the study-specific HRs, with the size of each square proportional to the study’s weight in the overall meta-analysis; the horizontal lines extending from these squares indicate the respective 95% CIs; the open diamond in each graph symbolizes the pooled HR, with the diamond’s width illustrating the 95% CIs for these pooled results.Significant heterogeneity was observed in the associations of total red and processed meat (I2=73.0%, P=0.011), as well as unprocessed red meat consumption and diabetes risk (I2=71.1%, P=0.008). However, there was no significant heterogeneity in the association between processed meat consumption and diabetes risk (I2=40.5%, P=0.135; Table 1; Figure 1). Egger’s test detected no evidence of publication bias or small-study effects (all P>0.05; Table 1). Nonetheless, the funnel plots suggested potential publication bias for the associations of both red and processed meat, as well as unprocessed red meat consumption with diabetes risk (
Supplementary Figure S2 ).We observed significant non-linear relations between the consumption of total red and processed meat (Pnon-linearity=0.015), and unprocessed red meat (Pnon-linearity<0.001), with diabetes (Figure 2). A J-shaped relationship was found between the consumption of total red and processed meat and the risk of diabetes. An accelerated increase in diabetes risk was noticed when consumption surpassed approximately 40 grams per day. As for the consumption of unprocessed red meat, a U-shaped pattern emerged in relation to diabetes risk, with a linear increase when daily consumption exceeded roughly 40 grams (Figure 2). However, the P value for non-linearity between processed meat consumption and diabetes risk was not statistically significant (Pnon-linearity=0.065; Figure 2).
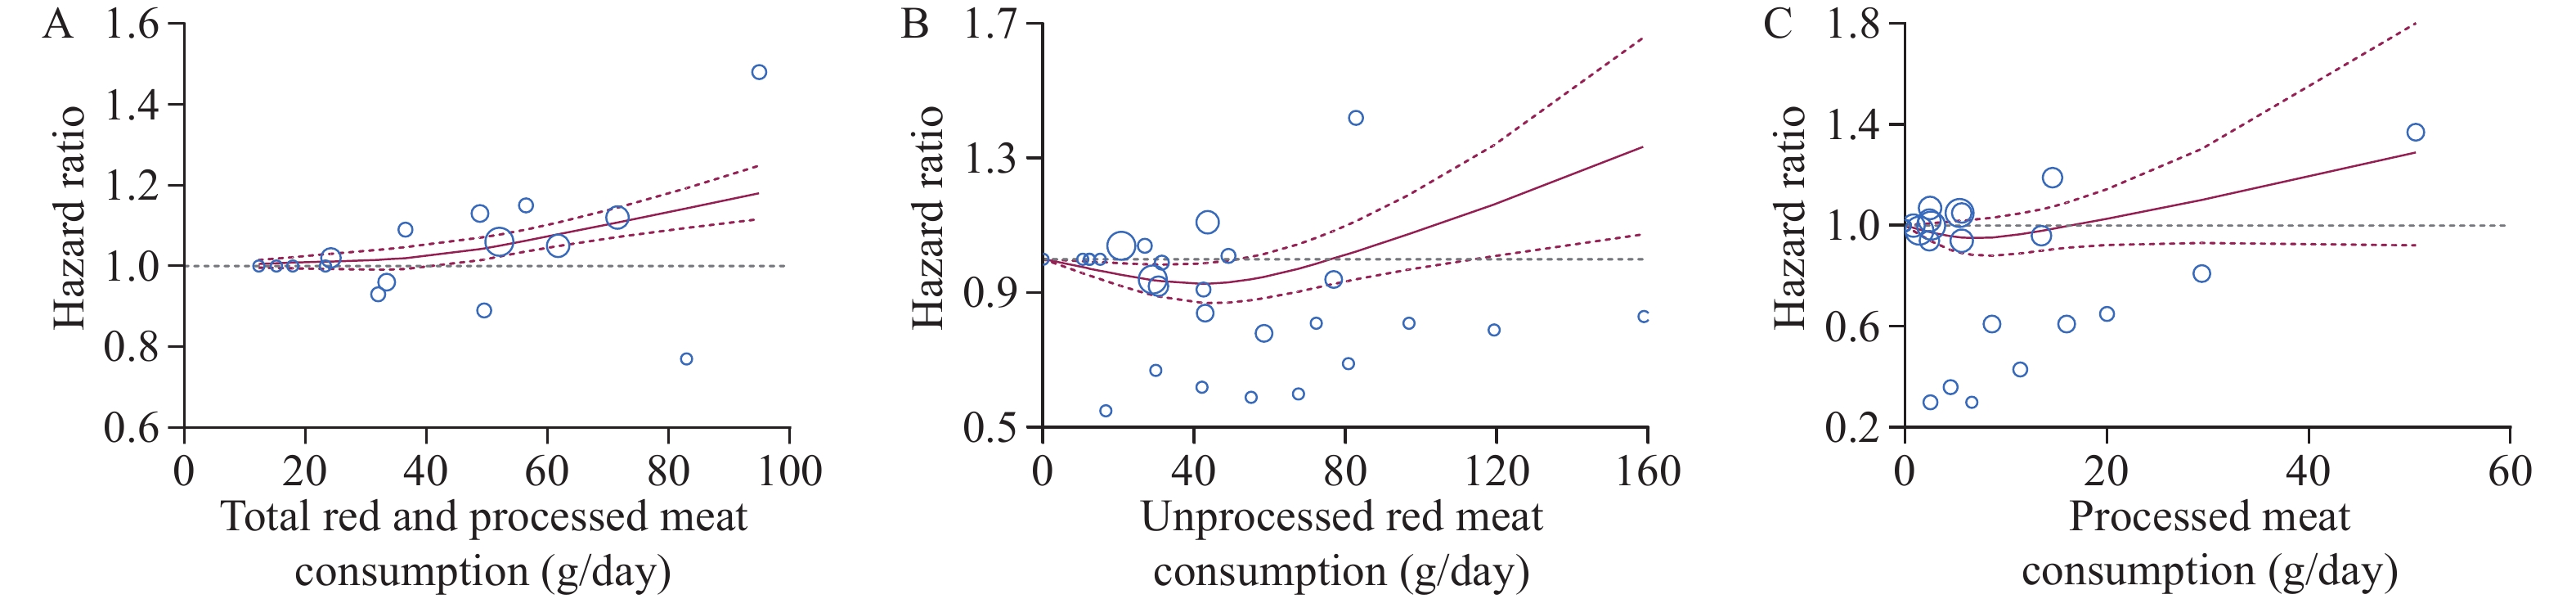 Figure 2.
Non-linear dose-response relationship (HRs and 95% CIs) between (A) total red and processed meat (Pnon-linearity=0.015), (B) unprocessed red meat (Pnon-linearity<0.001) and (C) processed meat (Pnon-linearity=0.065) daily intakes and risk of diabetes.
Note: Results from the Singapore Chinese Health Study (SCHS), the Japan Public Health Center-based Prospective Study (JPHC) and the China Kadoorie Biobank were included in (A); SCHS, the China Health and Nutrition Survey (CHNS), JPHC and the Shanghai Women’s Health Study (SWHS) in (B); the Korean Genome Epidemiology Study, SCHS, CHNS, and JPHC in (C). The solid line represents the fitted dose-response curve, and the dashed line is the 95% CI; the position of each bubble represents the corresponding dose and effect in the included studies, and the size of the bubble represents the weight; the weight of the reference category is considered as half of the minimum weight of other categories.
Abbreviation: HRs=hazard ratios; CIs=confidence intervals; g=grams.
-
Our study indicates a significant relation between high processed meat consumption and an elevated risk of diabetes in East Asian populations. Furthermore, non-linear associations were observed between total red and processed meat intake, unprocessed red meat consumption and the risk of diabetes.
A recent meta-analysis revealed no significant association between the consumption of unprocessed red meat (per 100 grams/day increment; pooled HR: 0.98; 95% CI: 0.72, 1.33) or processed red meat (per 50 grams/day increment; pooled HR: 0.96; 95% CI: 0.83, 1.10) and type 2 diabetes risk within the stratified analysis of the Asian population (5). However, these findings come under scrutiny due to the exclusion of several Asian cohorts with absent dose-response data from the meta-analysis. In an attempt to address these limitations, additional data was assimilated from the Shanghai Men’s Health Study (SMHS) and the Japan Public Health Center-based Prospective Study (JPHC). This was exclusively for the unprocessed red meat in the extreme-category comparison analysis along with data obtained from the SMHS, JPHC, and the Singapore Chinese Health Study for processed meat (
Supplementary Material ). After incorporating data from all available Asian prospective cohorts, the current study showed an increased risk of diabetes related to increased consumption of processed meat.The dose-response investigations have unveiled a U-shaped relationship between the consumption of unprocessed red meat and the risk of diabetes, with the lowest level of risk at about 40 grams per day. This pattern may originate from the potential nutritional benefits of a moderate intake of unprocessed red meat, such as the provision of protein, iron, and various vitamins. Conversely, high consumption of red meat could potentially result in excessive intake of saturated fat, cholesterol, and heme iron, which may negatively impact insulin sensitivity and escalate diabetes risk. The non-significant impact tied to the daily increment of 100 grams of unprocessed red meat, as previously stated in an earlier meta-analysis (5), may be partially attributed to the existence of a non-linear dose-response relation. As of 2007, the United States had an average meat consumption of 122.8 kg/year, contrasted with China, Japan, and the Republic of Korea’s consumption ranging between 46.1 kg/year and 55.9 kg/year (6). Therefore, applying large daily increments, as used in the previous study (5), may not be suitable for Asian populations. Notably, certain studies did not have available dose-response data, resulting in these investigations not being included in the dose-response examination. This accounted for a lower number of included studies in this analysis as opposed to the extreme-category comparison analysis, potentially causing discrepancies between the two analyses. For instance, the Shanghai Women and Men’s Health Study findings (
Supplementary Material ) displayed a positive association (HR comparing highest to the lowest category: HR: 1.23; 95% CI: 1.12, 1.36) between processed meat consumption and the risk of diabetes. However, due to data limitations, this study was not incorporated into the dose-response analyses.In Western populations, an increase in daily consumption of unprocessed red meat by 100 grams and processed red meat by 50 grams was associated with a 36% and 51% escalated risk of type 2 diabetes, respectively (5). The variation in correlations between consumption of red and processed meat and diabetes risk in Western and Asian populations could partially be due to various exposure factors such as the quantity and type of meat products (6), cooking methods (7), and dietary patterns (8). For example, the median daily intake of unprocessed red meat and processed meat in an included Chinese cohort was respectively 58.9 grams and 0 grams (9), considerably lower than that in the United States (10). Nonetheless, there has been an extraordinary surge in the levels of red meat consumption in Asian countries in recent decades due to economic development (6,10). Accordingly, findings from the cohorts incorporated in the current study, which were established nearly 20 years ago, may not accurately reflect current conditions. Given the substantial shifts in red meat consumption among Asian populations, there is a continued need for further evidence regarding the association between red and processed meat consumption and diabetes risk.
This study has several limitations. Initially, our capability to conduct sensitivity and subgroup analyses was hindered due to the paucity of prior studies on this topic. Furthermore, a number of studies did not supply the requisite data for accomplishing the dose-response analysis. Another limitation is that most surveys did not collect data concerning potential confounders, such as types of meat consumed and cooking practices. A discordance in diabetes assessment methods (
Supplementary Table S2 ) could introduce potential bias, particularly in the form of misdiagnoses or underdiagnoses among self-reported cases. Moreover, our study population was composed of East Asians, which may limit the extent of generalizability and warrant further exploration into other Asian populations. Therefore, additional research is paramount in further understanding the impact of these factors on the associations between red meat consumption and diabetes risk.In conclusion, our study reveals an association between higher processed meat consumption and elevated risks of diabetes among East Asian populations. Although there was no identifiable relation observed between moderate unprocessed red meat consumption and increased diabetes risk, elevated consumption levels nevertheless exhibited a heightened risk. This finding warrants further exploration. This study furnishes the most current evidence advocating for the avoidance of processed meat and the reduction of unprocessed red meat consumption, specifically for the prevention of diabetes in East Asian populations.
-
No conflicts of interest.
HTML
| Citation: |

|