
 Download:


-
Birth defects (BDs) are a collection of structural, functional, and/or biochemical-molecular anomalies identifiable at birth (1). With advancements in economic and social sectors, mortality rates from infections and malnutrition among children and adolescents have significantly decreased. However, there’s a rising trend in deaths due to BDs (2). Current estimates suggest that BD prevalence is 4.7% in developed countries, 5.6% in middle-income countries, and 6.4% in low-income countries (3). Moreover, disabilities and cancer arising from birth defects pose growing threats to children’s health (4). Given these developments, BDs have become a critical global health concern demanding urgent attention.
In this context, China has also seen a rise in the significance of BDs in public health. According to the 2012 “Birth Defect Prevention Report” published by the Ministry of Health, China’s prevalence rate was 5.6 per 10,000 births in 2011 (5). Notably, 19.1% of infant deaths were attributable to BDs, and BDs were the root cause of 9.6% of disabilities. Furthermore, BDs were established as the second leading cause of infant death in China (6). Given its status as a developing nation with a large population, it is critical for China to reduce the incidence rates of birth defects.
Many Chinese studies have reported on the prevalence of BDs. Current protocols mandate reporting prenatal abnormalities in body structure, function, or metabolism. The extensive use of ultrasound technology in obstetrics has led to an increase in the detection of BDs prior to 28 weeks of gestation. Consequently, there is a compelling need to extend the surveillance period for birth defects.
In Jinan, most expectant mothers typically initiate hospital visits around the 12th week of gestation to secure a maternal record and undergo a medical examination. Therefore, starting birth defect monitoring from this gestational stage is both methodologically robust and practically feasible. As a result, a birth defect monitoring network was established across all district and county levels in Jinan in 2005. Accordingly, a birth defect monitoring network encompassing all district and county levels throughout Jinan was established in 2005. Health centers at the township level and county-level hospitals providing midwifery services were required to report relevant birth defect data. In 2011, the reach of this network was expanded to include all medical institutions offering pregnancy health and midwifery services. Additionally, an information system designed to collect precise birth defect data was implemented in the same year. All information relating to mothers and newborns, inclusive of data on birth defects, was submitted via an online reporting system, enabling accurate and reliable data.
Between 2005 and 2008, BDs were identified from the 28th week of gestation until 7 days post-birth. However, from 2008 to 2022, the period for determining BDs broadened to begin at 12 weeks gestation and extended through to 7 days after birth. Our study holds the potential to inform governmental policy-making with scientifically-based recommendations and serve as a template for developing cities to prevent BDs.
Data was aggregated from registry forms and an electronic information system. Between 2005 and 2015, paper forms were utilized for data collection. However, during 2015–2022, data compilation transitioned to an electronic information system. The collected data encompassed a range of factors such as the total number of births, maternal age, residency location (either urban or rural), and neonate gender. We accounted for 1,463,842 births and 28,537 BDs within our study.
Both external malformations and chromosomal aberrations, encompassed under BDs, were diagnosed under the International Classification of Diseases (10th edition).
To maintain data accuracy, standardized procedures were established for data handling, abstraction, and evaluation. Hospital surveillance teams verified diagnoses, reviewed data, and checked medical records following these standards. Annual surveys revealed a 0.5% underreporting rate of birth defects in Jinan. Missing reports were documented yearly.
The Cochran-Armitage test (CAT) was used to analyze the trends of BD prevalence. Differences in BDs were tested using the Chi-square test. All statistical analyses were executed using SPSS software (version 18.0: IBM Corp., Armonk, NY, USA), with a significance level of P<0.05.
Between 2005 and 2022, there were 1,463,842 recorded births and 28,537 instances of BDs, yielding a prevalence of 194.93 per 10,000 births. Time trend analysis illustrated a rise in BD rates from 99.15 per 10,000 births in 2005 to 290.27 per 10,000 births in 2022. This represents an aggregate increase of 191.21% and an annual increase of 10.70% (P<0.05). The peak birth defect prevalence was in 2022, at 290.27 per 10,000 births. A significant increase inflection point was identified in 2016, with prevalences exceeding 230 per 10,000 births from then on.
During the study period, urban areas had a BD rate of 234.54 per 10,000 births, while rural areas had 161.40 per 10,000 births. The prevalence in urban areas significantly surpassed that in rural areas, averaging 31.17% (P<0.05). A time trend analysis indicated an increase in the incidence of BDs in both urban and rural areas, with the average annual growth rate in rural environments being faster than in urban ones (13.63% vs. 7.85%) (Table 1 and Figure 1).
Year Total* Urban* Rural* Births BDs PRE Births BDs PRE Births BDs PRE 2005 47,302 469 99.15 19,467 255 130.99 27,835 214 76.88 2006 49,964 620 124.09 18,957 331 174.61 31,007 289 93.20 2007 60,206 627 104.14 25,154 375 149.08 35,052 252 71.89 2008 58,797 673 114.46 23,975 400 166.84 34,822 273 78.40 2009 66,767 690 103.34 26,603 376 141.34 40,164 314 78.18 2010 80,960 951 117.47 36,732 545 148.37 44,228 406 91.80 2011 81,422 1,431 175.75 36,700 819 223.16 44,722 612 136.85 2012 89,054 1,347 151.26 39,763 728 183.08 49,291 619 125.58 2013 77,458 1,156 149.24 35,551 600 168.77 41,907 556 132.67 2014 109,211 1,530 140.10 51,363 813 158.29 57,848 717 123.95 2015 76,440 1,420 185.77 35,959 762 211.91 40,481 658 162.55 2016 131,469 3,068 233.36 62,281 1,750 280.98 69,188 1,318 190.50 2017 102,681 2,781 270.84 49,217 1,589 322.86 53,464 1,192 222.95 2018 100,077 2,652 265.00 48,853 1,453 297.42 51,224 1,199 234.07 2019 102,254 2,718 265.81 49,126 1,500 305.34 53,128 1,218 229.26 2020 83,811 2,270 270.85 40,445 1,240 306.59 43,366 1,030 237.51 2021 73,594 2,039 276.31 36,136 1,100 304.41 37,658 939 249.35 2022 72,175 2,095 290.27 35,126 1,111 316.29 37,049 984 265.59 Total 1,463,842 28,537 194.93 671,408 15,747 234.54 792,434 12,790 161.40 AAGR 10.71 7.85 13.63 Abbreviation: BDs=birth defects; PRE=prevalence (per 10,000 births); CAT=Cochran-Armitage trend; AAGR=average annual growth rate.
* CAT P<0.05.Table 1. The prevalence of birth defects in Jinan from 2005 to 2020.
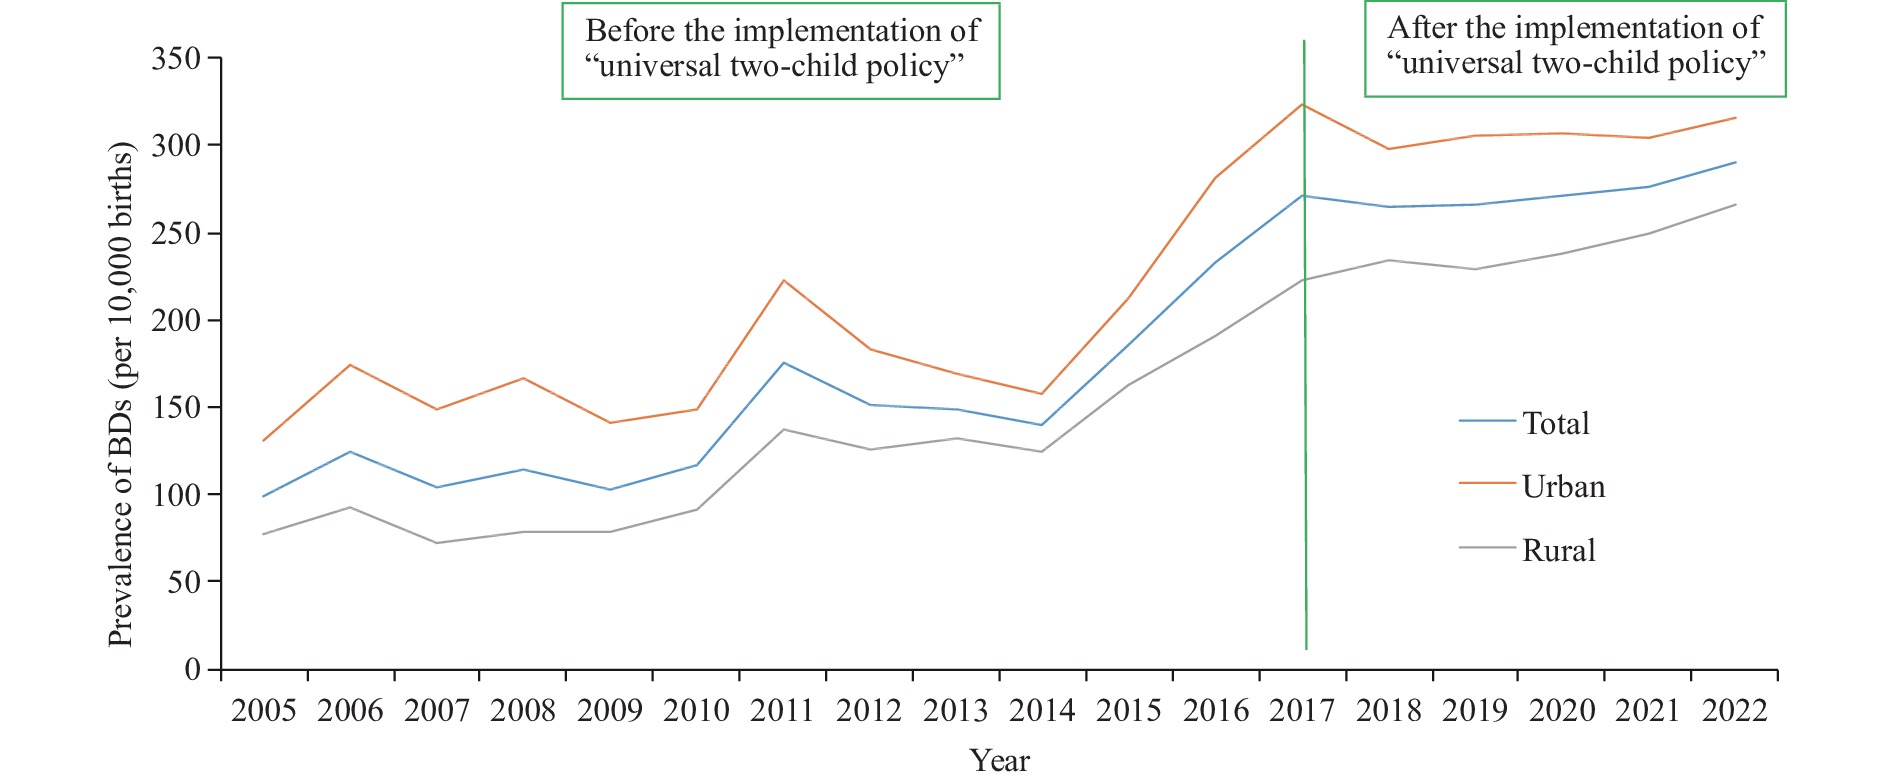 Figure 1.
The prevalence of birth defects between urban areas and rural areas from 2005 to 2020.
Note: Two distinct periods were demarcated based on changes in population policies: 2005–2016, preceding the implementation of the universal two-child policy; and 2017–2022 following the implementation of the universal two-child policy.
Abbreviation: BD=birth defect.
Throughout our study, we observed a significantly higher prevalence of BDs in two specified age groups. Mothers under 20 had a BD rate of 272.91 per 10,000 births, and those over 35 had 236.09 per 10,000 births. These age groups showed significantly higher BD incidences compared to other groups (P<0.05).
From 2005 to 2022, the proportion of pregnant women under 20 surged by 2037.50%, while those over 35 increased by 66.35% (Table 2).
Year <20 years 20−25 years 25−30 years 30−35 years 35+ years Proportion, % PRE† Proportion, % PRE† Proportion, % PRE† Proportion, % PRE† Proportion, % PRE† 2005 0.08 277.78 22.58 108.62 52.78 84.11 19.65 112.96 4.91 172.12 2006 0.11 357.14 26.82 108.96 43.70 117.24 22.43 141.90 6.94 164.41 2007 0.12 269.61 22.69 97.20 43.08 105.01 25.35 92.10 8.76 131.51 2008 0.11 292.23 24.51 98.91 40.72 122.37 24.88 104.84 9.78 126.65 2009 0.24 249.24 27.94 97.06 36.28 108.62 24.92 103.41 10.62 110.11 2010 0.47 235.60 23.22 144.19 40.26 109.21 26.66 101.45 9.39 139.49 2011 0.41 337.42 29.66 162.71 36.59 186.96 24.05 164.98 9.31 215.24 2012 0.35 317.46 24.30 143.71 39.90 152.81 26.29 150.47 9.16 193.61 2013 0.57 273.35 22.08 133.31 41.29 164.14 26.54 145.46 9.52 151.82 2014 0.49 242.54 15.41 135.46 47.81 142.31 27.14 133.60 9.15 158.16 2015 0.69 263.65 13.31 179.91 43.91 189.51 27.67 172.08 14.42 205.03 2016 0.54 252.45 9.32 163.08 32.74 203.40 31.77 136.07 25.63 213.92 2017 0.62 290.70 10.71 233.98 31.48 254.97 29.22 309.57 27.97 314.31 2018 0.64 291.02 10.07 235.62 30.13 226.98 33.84 255.27 25.32 347.89 2019 1.32 293.17 10.92 237.75 31.12 230.58 32.07 249.54 24.57 328.41 2020 1.61 296.90 11.62 239.91 30.59 249.27 29.84 215.05 26.34 295.99 2021 1.63 301.63 12.02 241.63 29.36 251.36 31.63 225.36 25.36 312.36 2022 1.71 305.32 11.68 246.36 25.65 253.69 32.69 226.39 28.27 326.69 Total 0.65 272.91* 18.27 202.76 37.63 182.21 27.59 187.97 15.86 236.09* AAGR 113.19 0.55 −2.68 7.05 −2.86 11.20 3.69 5.58 26.43 4.99 Abbreviation: BDs=birth defects; PRE=prevalence (per 10,000 births); CAT=Cochran-Armitage trend; AAGR=average annual growth rate.
* Chi-squared test P<0.05.
† CAT P<0.05.Table 2. The prevalence of BDs in different maternal age groups from 2005 to 2020 (per 10,000 births).
From 2005 to 2022, the top 5 BDs were congenital heart disease (88.54 per 10,000 births), polydactyly (19.23 per 10,000 births), cleft lip and/or palate (10.41 per 10,000 births), hypospadias (9.84 per 10,000 births), and syndactyly (5.35 per 10,000 births).
Of the 10 major BDs analyzed, 7 showed an upward trend, and 3 declined from 2005 to 2022 (P<0.05). Congenital heart disease exhibited a significant increase at 867.36%, reflecting an average annual growth of 48.19%. The occurrence of Down syndrome similarly increased by 299.14%, with an average annual increase of 16.62%. Polydactyly also rose by 223.09%, averaging an annual increase of 12.39%. On the other hand, Neural Tube Defects demonstrated a stark decrease at 90.35%, with an average annual decline of 5.02%. The rates of Congenital Hydrocephalus similarly fell by 63.81%, with an average annual decrease of 3.54%. Limb Shortening also declined by 53.19%, averaging an annual decrease of 2.96%. (Table 3 and Figure 2).
Rank Types of BDs 2005 2006 2007 2008 2009 2010 2011 2012 2013 2014 2015 2016 2017 2018 2019 2020 2021 2022 Total AAGR 1 Congenital heart disease* 12.47 16.61 17.51 16.22 16.63 23.34 43.97 40.87 35.89 34.06 48.01 62.10 71.20 80.32 90.63 100.23 110.36 120.63 88.54 48.19 2 Polydactyly* 8.88 13.81 9.89 11.70 11.69 15.19 15.6 16.73 15.75 15.11 18.58 21.00 25.71 26.72 27.12 27.60 28.01 28.69 19.23 12.39 3 Cleft lip and/or palate 15.45 20.22 17.52 22.23 17.23 17.42 19.49 16.05 15.49 16.3 15.56 18.74 20.25 19.81 20.33 19.63 20.12 19.68 10.41 1.52 4 Hypospadias* 4.44 8.83 7.69 5.07 6.10 6.78 12.73 4.45 6.12 4.28 7.92 10.10 12.10 11.34 12.10 10.10 12.82 11.73 9.84 9.12 5 Syndactyly 3.38 3.20 3.41 2.68 2.55 3.33 3.32 3.59 3.49 3.57 5.63 6.90 7.89 6.96 6.70 4.80 5.10 5.20 5.35 2.99 6 Down’s syndrome* 2.33 2.10 1.78 1.50 1.20 1.61 2.21 1.68 5.03 3.85 6.93 9.28 13.93 11.66 12.9 11.40 10.80 9.30 5.05 16.62 7 Other malformation of external ear* 1.90 2.40 1.95 3.34 1.35 0.74 2.70 2.47 3.36 3.20 3.53 2.89 6.82 6.56 5.40 3.90 3.70 3.90 4.36 5.85 8 Congenital hydrocephalus* 9.09 8.21 5.84 6.35 4.94 5.93 6.21 5.95 4.91 5.22 4.06 5.01 5.94 5.09 4.10 3.24 4.26 3.29 4.05 −3.54 9 Neural tube defects* 10.99 11.61 9.49 9.29 8.14 4.32 4.54 3.71 4.00 4.94 4.06 4.18 4.72 4.70 3.20 1.67 1.32 1.06 2.12 −5.02 10 Limb shortening* 4.23 5.60 2.92 4.68 2.55 2.47 4.18 3.26 3.61 2.93 4.32 3.19 4.80 4.20 3.90 2.15 2.05 1.98 3.61 −2.96 Abbreviation: BD=birth defect; AAGR=average annual growth rate; CAT=Cochran-Armitage trend.
* CAT P<0.05.Table 3. The prevalence of major birth defects from 2005 to 2020 (per 10,000 births).
 Figure 2.
The prevalence of (A) congenital heart disease, (B) polydactyly, (C) Down’s syndrome, (D) neural tube defects, (E) congenital hydrocephalus, and (F) limb shortening from 2005 to 2020.
Abbreviation: BD=birth defect. -
The results indicated a prevalence rate of BDs in Jinan of 194.93 per 10,000 live births between 2005 and 2022. Furthermore, the prevalence of birth defects was observed to increase at an annual rate of 10.71%, surpassing the growth rates recorded in Jiangsu (7), Hunan (8), and Sichuan (9). This growing issue demands significant attention from relevant governmental sectors.
A significant shift in growth trends was identified in 2016, potentially due to an increase in pregnancies among women of advanced maternal age. Our study indicates a spike in pregnancies among women over 35 in 2016, reaching 25.63% from an earlier 10%. This change likely stems from China’s “universal two-child policy”, allowing all women to have two children. Moreover, the traditional Chinese belief, deeming numerous sons as a source of abundant blessings, deeply entrenched in the society, also pose an effect. Consequently, following the policy’s introduction, many women, particularly those of advanced maternal age, chose to have children. It is widely established through numerous studies that an increased maternal age poses risk factors for BDs (10), highlighting 2016 as a significant turning point in the rising birth defect trends.
Our findings revealed a higher prevalence of BDs in urban areas compared to rural areas, potentially due to increased work-related stress and environmental impacts in urban areas. Furthermore, birth defects grew faster in rural areas, a trend rarely seen in other studies. This observation could potentially be due to the inadequate awareness and application of preventive measures amongst pregnant women in rural areas, compounded by suboptimal lifestyle habits (11).
Our data shows a distinct “U” shaped pattern in the maternal age distribution of the prevalence of BDs, particularly among women under 20 and above 35. This trend mirrors earlier studies (12) and may be attributable to unhealthy lifestyles and reproductive challenges. We also highlight a rapidly growing proportion of pregnancies within these age groups, particularly among women under 20 — a demographic subgroup that has previously garnered little research attention. In China, pregnancies in women under 20 are commonly unintended and frequently result in induced abortion, which poses substantial health risks.
Our time trend analysis examined the prevalence of key BDs, revealing a notable increase in the prevalence of congenital heart disease (CHD), aligning with the findings of numerous studies (13). It is well understood that CHD originates from complex, multifactorial causes. The noted escalation in prevalence can be attributed to advancements in diagnostic and screening techniques, lifestyle behaviors of parents, genetic and environmental contributors to BDs, or a combination thereof. The widespread implementation of ultrasound technology in obstetrics should not be dismissed. A significant growth inflection point was observed for CHDs in our study in 2011. This corresponds with the introduction of free neonatal screenings for CHD in Jinan that year. The percentage of neonatal screenings soared from an average of 35.67% before 2011 to 85.36% thereafter, leading to the detection of previously undiagnosed cases, such as mild VSD or ASD. Similar observations have been reported in other scholarly articles (14).
Our research also indicates a notable decrease in the prevalence of neural tube defects, which can be attributed to the widespread promotion of folic acid programs in Jinan. The protective effect of folic acid is well-supported by multiple studies (15). Following the introduction of free folic acid for expectant mothers into public health initiatives in 2009, nearly 95% of them began a regular intake of folic acid during their pregnancies. This is likely associated with the marked decrease in the prevalence of neural tube defects in Jinan post-2010.
Our study has certain limitations. First, the birth defect data was hospital-based. Although the monitoring phase extended up to 12 gestation weeks, any birth defects occurring prior to this period or outside of hospital settings may have been overlooked. Second, environmental hazards and unhealthy lifestyles play a significant role in the incidence of birth defects. However, due to data limitations, we couldn’t fully assess the impact of these factors on Jinan’s birth defect rates, indicating the need for additional research. Third, the annual variation in the monitoring time duration for birth defects could potentially adversely affect the trend analysis for birth defects. Lastly, given the extended monitoring period, changes in diagnostic criteria or improvements in diagnostic methods were inevitable, meaning that the prevalence of birth defects could be underestimated.
In summary, there has been a notable escalation in the prevalence of BDs in Jinan, with the growth rate in rural areas surpassing that in urban regions. Data indicates that mothers over 35 and under 20 exhibit a pronounced BD prevalence relative to other maternal age groups, and representation within these age groups is also dramatically rising. Furthermore, there is a marked increase in the prevalence of congenital heart disease, while the prevalence of neural tube defects shows a decrease. Targeted interventions for expectant mothers in rural territories, as well as those in the aforementioned age groups, are imperative.
-
Appreciation is expressed to all the participants for their contribution.
HTML
| Citation: |

|