
 Download:


-
Tuberculosis (TB), caused by Mycobacterium tuberculosis (1), globally has a mean incidence rate of approximately 106.7 per 100,000 (2). It also emerges as one of the primary causes of death across the world (3). Despite longstanding preventive and control measures for TB in China (4), the nation ranks third-highest in TB incidence among the 30 countries with the highest TB burden (2). The urgent necessity to explore the disease’s epidemiology and trajectory caters to shortcomings in the breadth of studies assessing long-range trends of respiratory TB mortality in China across geographical areas and genders. Our study seeks to furnish an all-encompassing scrutiny of temporal patterns to aid policymakers in responsibly devising optimization strategies. Data were derived from the National Health Commission (1954–2013, Ministry of Health; 2013–2018, National Health and Family Planning Commission), categorizing deaths in line with the International Classification of Disease 9th revision (ICD-9) and ICD-10 standard — the former being applied until 2002, followed by ICD-10. Utilizing National Health Commission data, via Joinpoint regression analysis and age-period-cohort (APC) models, we investigated the respiratory TB annual mortality rate estimates spanning 1987 to 2021. The Joinpoint regression model, endorsing a timeline trend evaluation method, facilitates a segmented regression formulation based on disease distribution time characteristics — thereby facilitating a more detailed appraisal of varying time spans within the aggregate respiratory TB mortality trend. To tackle the linear functional interrelationship problem between age effects, period effects, and cohort effects, APC models were deployed. Our outcomes indicate a persistent decline in mortality rates over time, particularly in rural zones. However, the gender divide has expanded over the years. For further abatement of respiratory TB mortality rates and to align with global control objectives, focused interventions should strategically prioritize key clusters like men and the elderly.
Table 1 illustrates the longitudinal trends of respiratory TB in China, disaggregated by region and gender. The data spans from 1987 to 2021 and reveals a compelling decrease in both crude and age-specific mortality rates across all specific populations. Higher mortality rates were observed in males versus females and in rural regions as compared to metropolitan ones. However, the disparity between urban and rural areas progressively lessened over time. In 1987, the age-specific mortality rate (ASMR) associated with respiratory TB in urban areas was 12.22 per 100,000, with a breakdown of 16.27 for males and 7.69 for females. Up to the year 2021, the rates witnessed a commendable average annual decline of −7.2%, −6.8%, and −8.3% respectively. As for rural regions, the ASMR stood at 25.16 per 100,000 in 1987 with notable rates of 33.06 per 100,000 for males and 18.41 per 100,000 for females. By 2021, the average annual decline had reached −8.3%, −7.9%, and −9.9%, respectively. Strikingly, despite initiating with higher respiratory TB mortality rates than their urban counterparts, rural regions demonstrated a faster rate of decline.
Tuberculosis Mortality rate
(per 100,000)Total study period§ Period 1 Period 2 Period 3 Period 4 1987 2021 AAPC (%) 95% CI Years APC (%) Years APC (%) Years APC (%) Years APC (%) Crude mortality Urban areas Total 9.83 1.25 −5.5* (−8.5, −2.4) 1987–2000 −9.0* 2000–2003 12.8 2003–2006 −19.2 2006–2021 −2.7* Male 12.88 1.93 −5.3* (−6.4, −4.2) 1987–1997 −8.5* 1997–2021 −3.9* – – – – Female 6.58 0.56 −6.8* (−10.4, −3.0) 1987–2000 −11.1* 2000–2003 18.6 2003–2006 −25.5 2006–2021 −3.3* Rural areas Total 20.21 1.65 −6.6* (−8.4, −4.8) 1987–2001 −6.9* 2001–2005 −21.1* 2005–2021 −2.4* – – Male 25.07 2.52 −6.1* (−7.6, −4.6) 1987–2001 −6.9* 2001–2005 −18.6* 2005–2021 −1.9* – – Female 15.17 0.74 −8.2* (−10.2, −6.2) 1987–2001 −7.4* 2001–2008 −19.9* 2008–2016 2.9 2016–2021 −9.7* Age-standardized mortality† Urban areas Total 12.22 0.78 −7.2* (−10.9, −3.3) 1987–2000 −10.9* 2000–2003 18.5 2003–2006 −26.6 2006–2021 −4.1* Male 16.27 1.29 −6.8* (−10.4, −3.2) 1987–2000 −10.0* 2000–2003 14.7 2003–2006 −23.9 2006–2021 −4.1* Female 7.69 0.32 −8.3* (−13.1, −3.3) 1987–2000 −12.6* 2000–2003 24.7 2003–2006 −31.4 2006–2021 −4.8* Rural areas Total 25.16 1.05 −8.3* (−9.9, −6.6) 1987–2001 −7.7* 2001–2006 −20.1* 2006–2021 −4.6* – – Male 33.06 1.71 −7.9* (−10.0, −5.7) 1987–2002 −8.0* 2002–2005 −23.9* 2005–2021 −4.4* – – Female 18.41 0.44 −9.9* (−12.2, −7.4) 1987–2001 −7.8* 2001–2008 −22.0* 2008–2016 0.5 2016–2021 −12.8* Note: “–” means no joinpoints identified.
Abbreviation: APC=annual percent change; AAPC=average annual percent change; CI=confidence interval.
* Significantly different from zero (P<0.05).
† Standardized to the WHO world standard population.
§ Years 1987 to 2021.Table 1. Joinpoint analysis of crude and age-standardized mortality rates from tuberculosis in urban and rural areas.
Figure 1 depicts the net-drift and local-drift of respiratory TB. net-drift refers to the average annual trend for the entire population throughout the research period, while local-drift signifies the average trend within specific age groups. The Net-drift demonstrated a significant reduction in respiratory TB mortality in both rural and urban areas of China for the time from 1987 to 2021. The mortality rate decreased by 9.21% [95% confidence interval (CI): −9.77% to −8.64%] in rural regions and 6.32% (95% CI: −6.82% to −5.81%) in urban areas. A more pronounced annual shift in overall respiratory TB mortality was noted among females compared to males. The Net-drifts for urban men and women were −5.81% (95% CI: −6.43% to −5.19%) and −7.76% (95% CI: −8.33% to −7.18%), respectively. The figures for rural men and women were −8.27% (95% CI: −8.83% to −7.70%) and −10.90% (95% CI: −11.58% to −10.22%), respectively. The local-drift showed a general enhancement in China’s respiratory TB mortality control, particularly noteworthy among women aged 30–60. However, progression in reducing respiratory TB fatalities was relatively slight for the age groups 10–20 and those 70 years and over, although it remained generally below the 0 lines.
 Figure 1.
Local-drift and net-drift for tuberculosis mortality and urban-rural difference by sex in China from 1987 to 2021. (A) Urban area; (B) Rural area.
Figure 2 illustrates the influence of age, period, and cohort on the mortality rate of respiratory TB. The age-related effect revealed significant disparities between urban and rural areas. Mortality amongst urban males increased before declining with age, peaking at 75. Conversely, the mortality rate for women steadily decreased after reaching its apex at approximately age 20. For rural men and women, a consistent decline in the rates became apparent from age 25 onwards. Period effects demonstrated similar trends between rural and urban populations but showed a quicker decrease in rural areas than in metropolitan ones. Furthermore, the situation improved remarkably for females. Prior to 2003, females had higher rates than males, however, this pattern inverted post-2003, indicative of the significant success of respiratory TB control, particularly amongst rural females. The cohort effect exhibited similar patterns across both genders and locations. From 1900 to 1955, the mortality rate ratio of Chinese birth cohorts saw a significant reduction, especially in rural regions. As for the post-1960 birth cohorts, this decline has somewhat decelerated, yet continues to trend downward. The rural female birth cohort experienced the most substantial improvement.
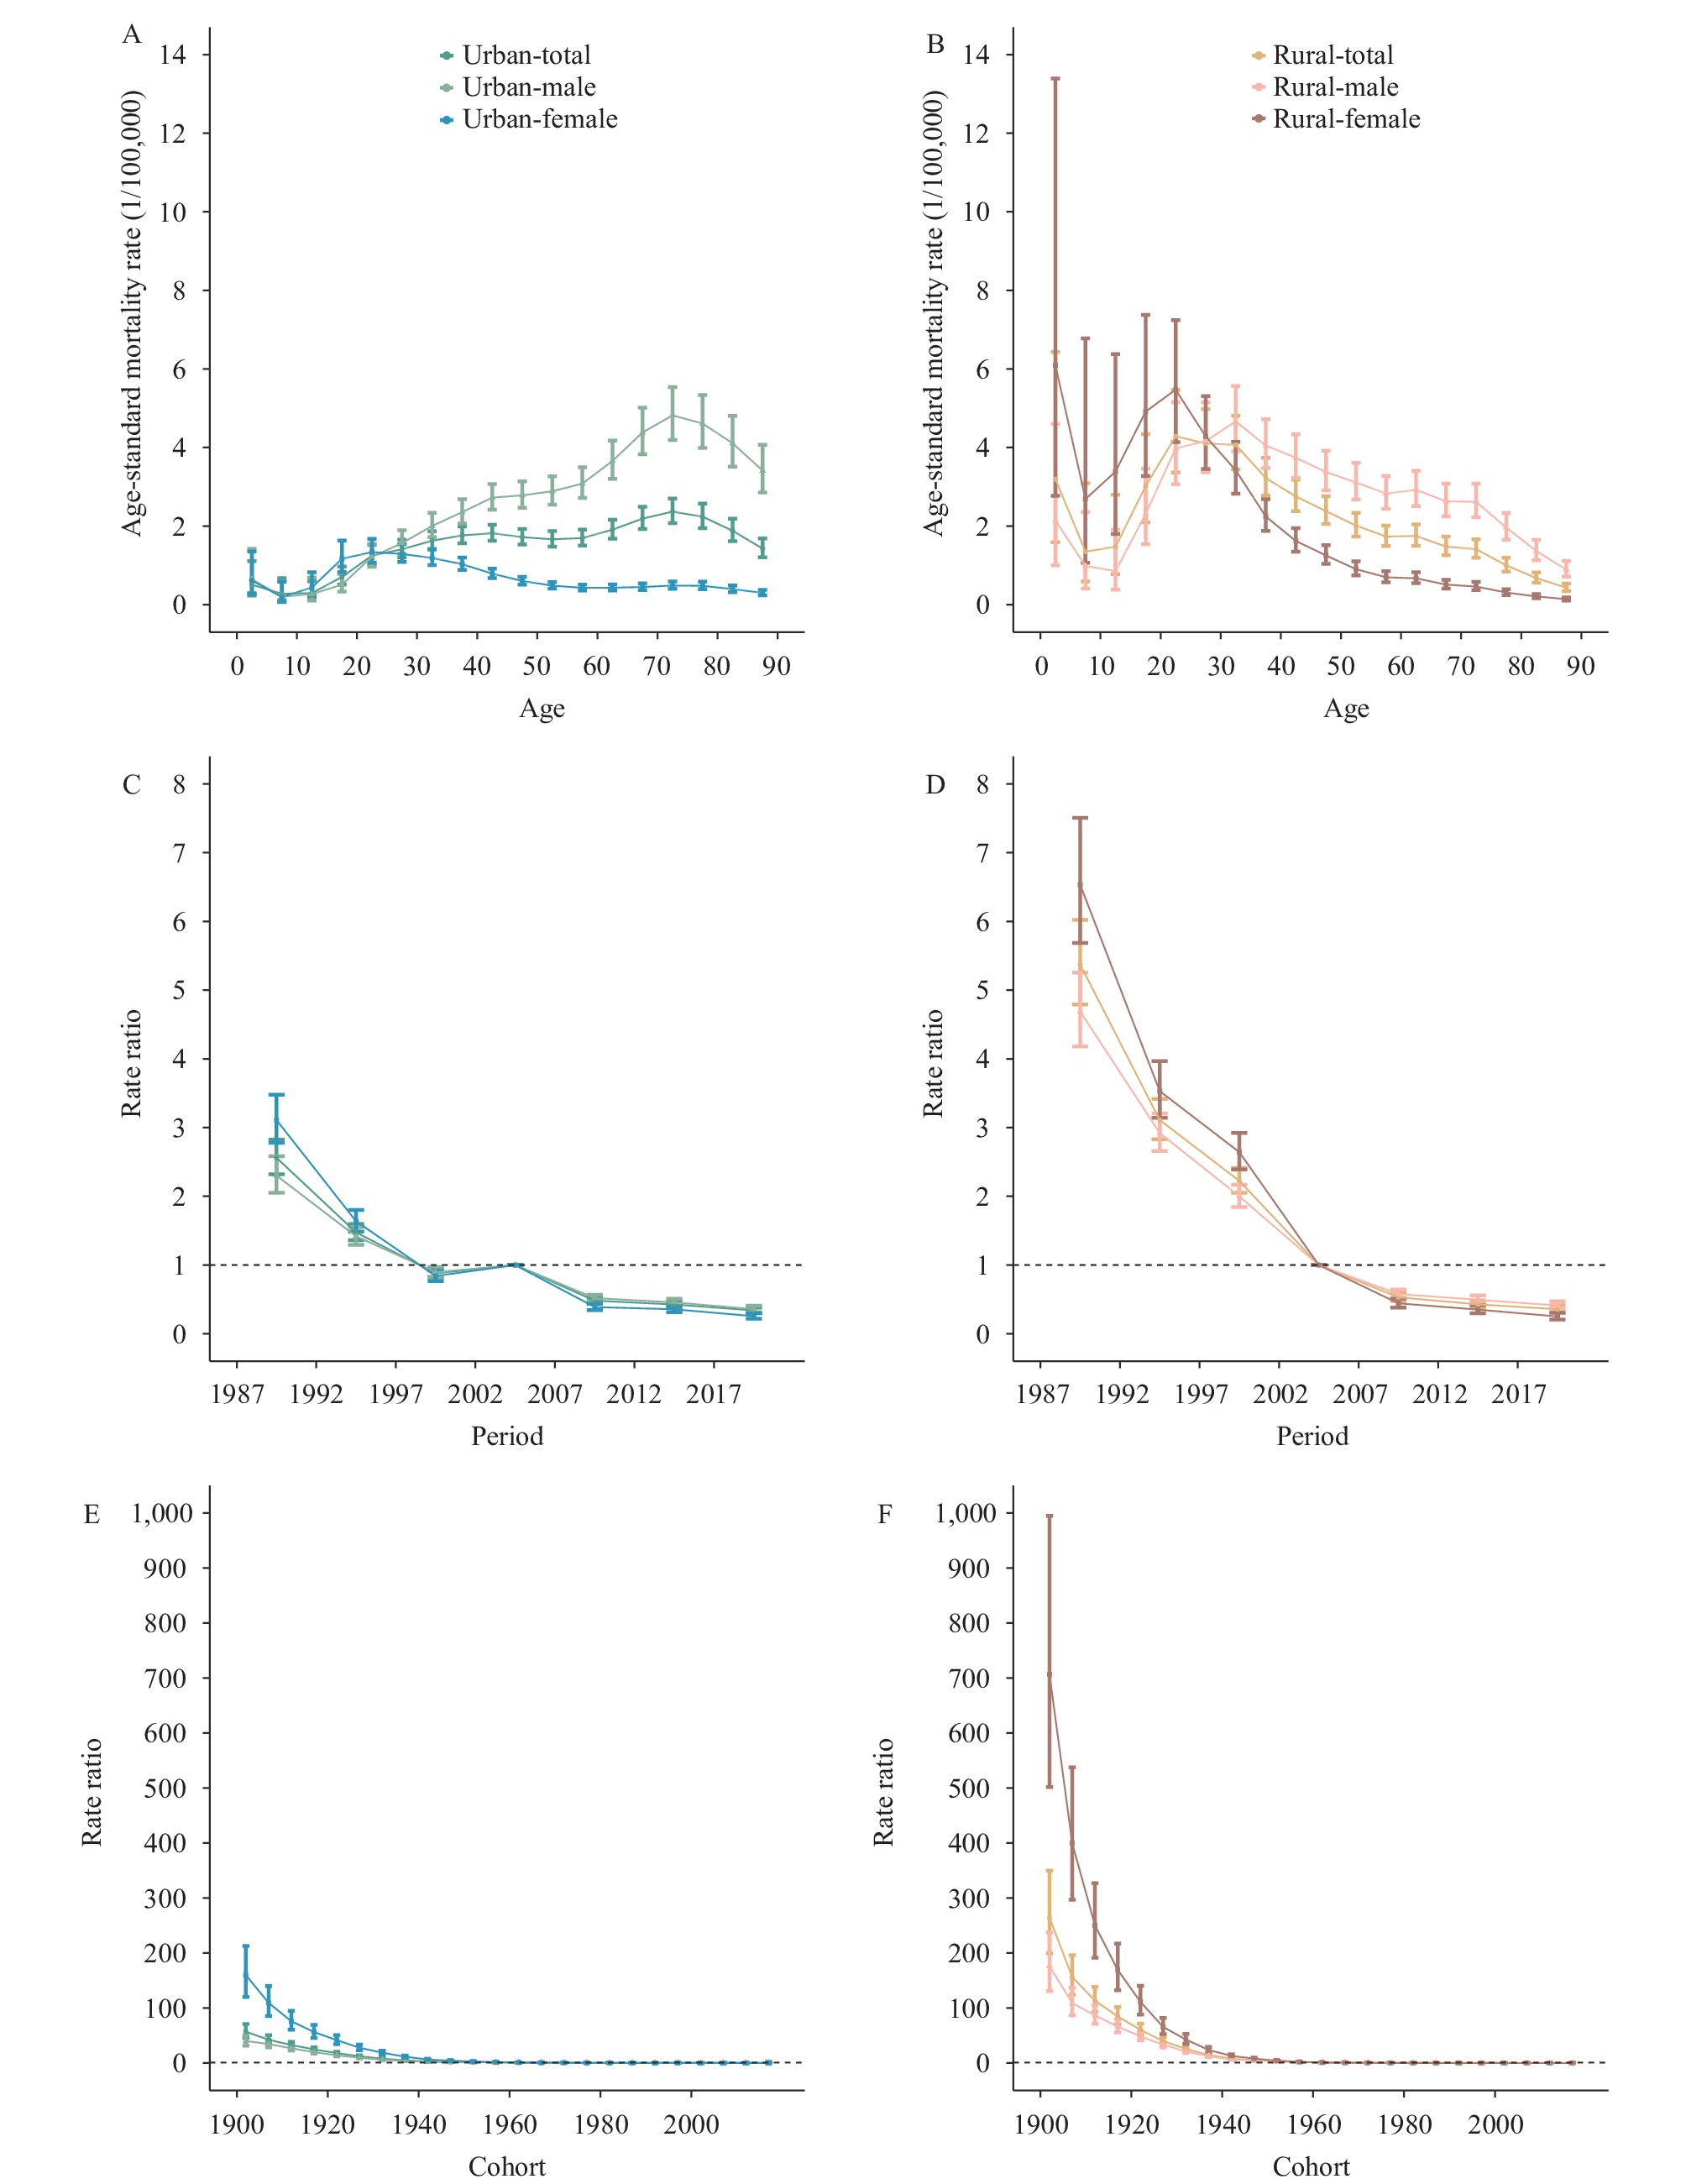 Figure 2.
Parameter estimates of age, period, and cohort effects on tuberculosis mortality rate in urban-rural China from 1987 to 2021. (A) Age effects in urban areas; (B) Age effects in rural areas; (C) Period effects in urban areas; (D) Period effects in rural areas; (E) Cohort effects in urban areas; (F) Cohort effects in rural areas.
-
This study revealed a continuous decline in tuberculosis (respiratory TB) mortality rates within China from 1987 to 2021, albeit at different rates between genders and geographical areas. Data from 1987 showed that the mortality rate due to respiratory TB in rural populations was 2.05 times higher than in urban areas. However, by 2021, the disparity had reportedly decreased to 1.32 times. The decline in mortality rates was documented at a rate of 5.5% and 6.6% per annum in urban and rural areas, respectively. Additionally, this study identified that the fastest trajectory of decreased respiratory TB mortality occurred from 1987 to 2000 in urban areas and from 2001 to 2008 in rural areas. Intriguingly, the rate of decline was more pronounced in rural areas compared to urban ones.
Significant gender disparities were observed in tuberculosis mortality rates. In the years 1987 and 2021, the male-to-female sex ratio for tuberculosis deaths stood at 1.96 and 3.44 in urban areas, compared to 1.65 and 3.45 in rural settings. This suggests a potential variation in TB risk factors according to gender, potentially linked to differing lifestyle behaviors, metabolic capabilities, and nutritional status (5). Another factor increasing the likelihood of TB infection is diminished immunity caused by chronic diseases (6).
The APC model revealed inconsistent variations in the age effects within urban and rural locales. In urban regions, the peak mortality rate for respiratory TB was observed among individuals aged between 70 and 80 years, while in rural areas, it reached its zenith among individuals in the 20–30 years age group. Up until the age of 25, women experienced a higher mortality rate in both urban and rural locations, but after the age of 30, the rate was higher among men. As age increased, this gender gap became particularly noticeable within urban areas (7). An analysis conducted in Jiangsu Province demonstrated that TB morbidity and mortality did not increase cumulatively with age. In fact, in women, mortality showed a downward trend post the age of 25 (8). Additional research is required to ascertain if age-related variables associated with TB risk could account for gender-specific and regional differences in these age effects. Throughout a 35-year observation period, we noted the cohort effect on respiratory TB mortality declining in both rural and urban locations. This suggests individuals in more recent birth cohorts have a lower likelihood of TB-related mortality. This can be attributed to fast-paced economic growth, enhanced healthcare coverage (especially in rural areas), and rigorous respiratory TB control policies. For instance, China incorporated the WHO’s TB control strategy in 1991, providing complimentary diagnostics for individuals exhibiting TB symptoms as well as free treatment for patients diagnosed with sputum smear-positive disease (9).
In conclusion, respiratory TB mortality trends exhibit significant variability across different regions, genders, and age groups. Priority groups for the prevention and control of respiratory TB are identified as children, rural young adults aged 20–30, and urban men aged 60 or older. According to the United Nations SDGs, global epidemics of tuberculosis must be extinguished by 2030 (10). To meet these targets, there is an urgent need for comprehensive strategies, such as tobacco control, promotion of healthy diets and nutrition security, the continued promotion of bacillus Calmette-Guérin vaccination, development of new TB vaccines, and improved diagnosis and treatment of drug-resistant tuberculosis. As specified in Healthy China 2030, there is also a need for an integrated service model for tuberculosis, aimed at curtailing the TB epidemic.
This study does have certain limitations. First, the effect quantified by the APC was derived from cross-sectional data, not data from cohorts. Second, the APC model does not include mortality data for respiratory TB in individuals under 20 years of age due to the exceptionally low incidence rate. Third, mortality data need to be further evaluated taking into consideration factors such as geographical divisions and significant socioeconomic disparities between local regions. Third, variances in the surveillance locations, populations under surveillance, and the determination of TB as the cause of death could potentially influence the results, given the extensive period over which the surveillance was conducted.
-
No conflicts of interest.
HTML
| Citation: |

|