
 Download:


-
A balanced consumption of various types of food items plays a crucial role in students’ physical and intellectual development, providing the foundation for their lifelong health (1). In recent years, the living standards in China have improved, leading to a steady improvement in the intake of various foods among Chinese students (2). However, uneven socioeconomic development and differing natural environments may lead to disparities in food consumption between rural and urban students (3). The prevalence of malnutrition among rural students has decreased but remains higher than among urban students (4). Furthermore, consumption of various healthy foods increased during the coronavirus disease 2019 (COVID-19) pandemic as a means to boost immunity and promote health (5).
This report aimed to investigate the status of food consumption in 2021 and the changes in the consumption frequencies of different foods between 2019 and 2021 for Chinese students. The goal is to provide basic data for promoting the health of students in China’s economically underdeveloped areas. Data were obtained from the “Nutrition Improvement Program for Rural Compulsory Education Students” (NIPRCES). The weekly frequencies of consuming meat, eggs, milk, legumes, fruits, and vegetables in 2021 were higher than those in 2019; however, they remained relatively low in rural areas in 2021. Therefore, efforts should be made to increase students’ consumption of various foods rich in high-quality protein, vitamins, and minerals, which is essential for eradicating malnutrition among rural students.
Data were obtained from the NIPRCES in 2019 and 2021. A multi-stage stratified random cluster sampling method was utilized to select students aged 8–15 years from grades 3 to 9 attending primary and junior high schools in rural areas of 50 national pilot NIPRCES counties across 22 provincial-level administrative divisions (PLADs) in China’s central and western regions during 2019 for key monitoring. In 2021, the key monitoring expanded to include 160 counties, encompassing students from rural and urban areas in western, central, and eastern regions, as well as national, local, and non-pilot areas.
A student questionnaire was administered to collect basic demographic information and the frequency of food intake over the previous week, including meat, eggs, milk, legumes, vegetables, and fruits. Notably, meat, eggs, milk, and legumes are protein-rich, whereas vegetables and fruits are abundant in vitamins and minerals. For the comparison of food consumption frequency differences between 2019 and 2021, only data from rural national pilot counties in central and western regions of China were included.
The frequency of food consumption among students was described using the number of cases and percentages. All statistical analyses were conducted using SAS software (version 9.4; SAS Institute, Inc., Cary, NC, USA). Chi-squared tests, Wilcoxon tests, and Kruskal-Wallis tests were employed for group comparisons, depending on the appropriateness. A bilateral P-value of less than 0.05 was considered statistically significant.
A total of 30,882 students in 2019 and 178,509 students in 2021 were included in this study (Table 1). In 2021, 36.9% of students consumed meat, 24.5% consumed eggs, 32.5% consumed milk, and 10.2% consumed legumes, all at least once a day. The proportion of males and primary school students consuming meat, eggs, milk, and legumes at least once a day was significantly higher than that of females and junior high school students (P<0.05). Urban students demonstrated a higher daily consumption of meat, eggs, and milk compared to rural students, while exhibiting a lower consumption of legumes (P<0.05). A higher proportion of students from the eastern region consumed meat daily compared to those from central and western regions. Conversely, central region students had lower daily consumption of milk, eggs, and legumes (P<0.05) (Table 2).
Variable 2019 2021 Age (years), mean±SD 12.3±2.15 11.7±2.29 Gender, n (%) Male 15,699 (50.9) 90,756 (50.8) Female 15,183 (49.1) 87,753 (49.2) School stage, n (%) Primary school student 18,357 (59.4) 106,418 (59.6) Junior high school student 12,525 (40.6) 72,091 (40.4) Area type, n (%) Urban – 53,584 (30.0) Rural 30,882 (100.0) 124,925 (70.0) Region, n (%) Eastern – 27,869 (15.6) Central 8,895 (28.8) 58,446 (32.7) Western 21,987 (71.2) 92,194 (51.7) Total, n (%) 30,882 (100.0) 178,509 (100.0) “–” means data not available. Table 1. Demographic characteristics of students aged 8–15 years — China, 2019 and 2021.
Variable Total Gender School stage Area type Region Male Female Primary Junior high Urban Rural Eastern Central Western Meat* Less than 1 time/week 7,021 (4.1) 3,560 (4.1) 3,461 (4.1) 4,281 (4.2) 2,740 (4.0) 1,763 (3.4) 5,258 (4.4)§ 704 (2.6) 2,151 (3.8) 4,166 (4.7)§ 1–6 times/week 101,389 (59.0) 50,579 (58.0) 50,810 (60.1)§ 59,272 (57.9) 42,117 (60.7)§ 30,443 (58.5) 70,946 (59.1) 15,331 (56.2) 37,277 (66.3) 48,781 (55.2)§ 1 time/day and above 63,423 (36.9) 33,140 (38.0) 30,283 (35.8)§ 38,859 (37.9) 24,564 (35.4)§ 19,562 (37.8) 43,861 (36.5)§ 11,239 (41.2) 16,822 (29.9) 35,362 (40.0)§ P-value <0.0001 <0.0001 <0.0001 <0.0001 Eggs* Less than 1 time/week 14,228 (8.3) 7,144 (8.2) 7,084 (8.4) 7,054 (6.9) 7,174 (10.3)§ 3,965 (7.7) 10,263 (8.6)§ 2,167 (8.0) 3,793 (6.8) 8,268 (9.4)§ 1–6 times/week 115,365 (67.2) 58,088 (66.6) 57,277 (67.8)§ 67,606 (66.1) 47,759 (68.8)§ 34,467 (66.6) 80,898 (67.5)§ 18,711 (68.7) 36,535 (65.0) 60,119 (68.1)§ 1 time/day and above 42,099 (24.5) 21,993 (25.2) 20,106 (23.8)§ 27,643 (27.0) 14,456 (20.8)§ 13,347 (25.8) 28,752 (24.0)§ 6,356 (23.3) 15,893 (28.3) 19,850 (22.5)§ P-value <0.0001 <0.0001 <0.0001 <0.0001 Milk* Less than 1 time/week 18,492 (10.8) 9,451 (10.8) 9,041 (10.7) 9,419 (9.2) 9,073 (13.1)§ 4,232 (8.2) 14,260 (11.9)§ 2,559 (9.4) 5,728 (10.2) 10,205 (11.6)§ 1–6 times/week 97,283 (56.7) 48,446 (55.6) 48,837 (57.9)§ 56,519 (55.3) 40,764 (58.8)§ 27,844 (53.8) 69,439 (58.0)§ 14,966 (55.0) 29,525 (52.6) 52,792 (59.9)§ 1 time/day and above 55,756 (32.5) 29,269 (33.6) 26,487 (31.4)§ 36,258 (35.5) 19,498 (28.1)§ 19,666 (38.0) 36,090 (30.1)§ 9,711 (35.7) 20,927 (37.3) 25,118 (28.5)§ P-value <0.0001 <0.0001 <0.0001 <0.0001 Legumes* Less than 1 time/week 28,680 (16.7) 14,517 (16.7) 14,163 (16.8) 16,299 (16.0) 12,381 (17.9)§ 7,965 (15.4) 20,715 (17.3)§ 4,535 (16.7) 8,362 (14.9) 15,783 (17.9)§ 1–6 times/week 125,208 (73.0) 63,337 (72.7) 61,871 (73.4)§ 74,351 (72.8) 50,857 (73.4)† 38,902 (75.2) 86,306 (72.1)§ 20,327 (74.7) 41,032 (73.1) 63,849 (72.5)§ 1 time/day and above 17,557 (10.2) 9,253 (10.6) 8,304 (9.9)§ 11,505 (11.3) 6,052 (8.7)§ 4,857 (9.4) 12,700 (10.6)§ 2,360 (8.7) 6,754 (12.0) 8,443 (9.6)§ P-value 0.0003 <0.0001 0.0033 <0.0001 Vegetables* Less than 1 kind/day 5,907 (3.5) 3,400 (3.9) 2,507 (3.0)§ 3,534 (3.5) 2,373 (3.4) 2,001 (3.9) 3,906 (3.3)§ 1,023 (3.8) 2,252 (4.0) 2,632 (3.0)§ 1 kind/day 38,618 (22.6) 20,245 (23.3) 18,373 (21.8)§ 23,835 (23.4) 14,783 (21.4)§ 12,768 (24.7) 25,850 (21.6)§ 6,896 (25.4) 14,597 (26.0) 17,125 (19.6)§ 2 kinds/day 69,934 (40.9) 35,200 (40.5) 34,734 (41.2)§ 40,047 (39.2) 29,887 (43.2)§ 21,554 (41.8) 48,380 (40.5)§ 12,706 (46.7) 23,447 (41.8) 33,781 (38.4)§ 3 kinds/day and above 56,715 (33.1) 28,104 (32.3) 28,611 (34.0)§ 34,616 (33.9) 22,099 (32.0)§ 15,298 (29.6) 41,417 (34.6)§ 6,578 (24.2) 15,765 (28.1) 34,372 (39.1)§ P-value <0.0001 0.4779 <0.0001 <0.0001 Fruits* Less than 1 time/week 9,165 (5.4) 5,158 (5.9) 4,007 (4.8)§ 3,910 (3.8) 5,255 (7.6)§ 1,868 (3.6) 7,297 (6.1)§ 1,101 (4.1) 2,870 (5.1) 5,194 (5.9)§ 1–6 times/week 110,055 (64.3) 56,023 (64.4) 54,032 (64.1) 62,586 (61.4) 47,469 (68.6)§ 31,290 (60.6) 78,765 (65.9)§ 17,173 (63.1) 36,107 (64.4) 56,775 (64.6)§ 1 time/day and above 52,017 (30.4) 25,818 (29.7) 26,199 (31.1)§ 35,521 (34.8) 16,496 (23.8)§ 18,521 (35.8) 33,496 (28.0)§ 8,930 (32.8) 17,109 (30.5) 25,978 (29.5)§ P-value <0.0001 <0.0001 <0.0001 <0.0001 * means the study subjects were partially missing.
† Chi-squared test between males and females; primary school and junior high school students; urban and rural areas; eastern, central and western regions, P<0.05.
§ Chi-squared test between males and females; primary school and junior high school students; urban and rural areas; eastern, central and western regions, P<0.01.Table 2. Frequency of food consumption among students aged 8–15 years — China, 2021 (n, %).
Approximately 33.1% of students reported consuming 3 or more types of vegetables per day. The proportions of female students, rural students, and those in western regions consuming three or more kinds of vegetables daily were significantly higher than their male, urban, and eastern or central counterparts (P<0.05). Around 30.4% of students consumed fruits at least once a day, while 5.4% reported consuming fruit less than once a week. The proportion of female students, primary school students, rural students, and those from eastern regions consuming fruits at least once a day was significantly higher than for male students, junior high school students, urban residents, and those from central or western regions (P<0.05) (Table 2).
The proportions of participants consuming meat, eggs, milk, legumes, and fruits once a day or more were 37.1%, 25.1%, 30.1%, 11.5%, and 28.0% in 2021; significantly higher than those in 2019, which were 28.5%, 13.1%, 14.0%, 8.6%, and 15.7%, respectively (all P<0.05). Conversely, the proportions of participants consuming meat, eggs, milk, legumes, and fruits less than once a week in 2021 were 4.6%, 8.3%, 11.6%, 16.6%, and 6.2%, respectively, and these were lower than the proportions in 2019 (9.5%, 15.3%, 19.4%, 22.0%, and 12.6%, respectively) (all P<0.05). Moreover, the proportion of participants consuming three or more types of fresh vegetables per day was higher in 2021 (38.3%) compared to 2019 (34.6%, P<0.05) (Figure 1).
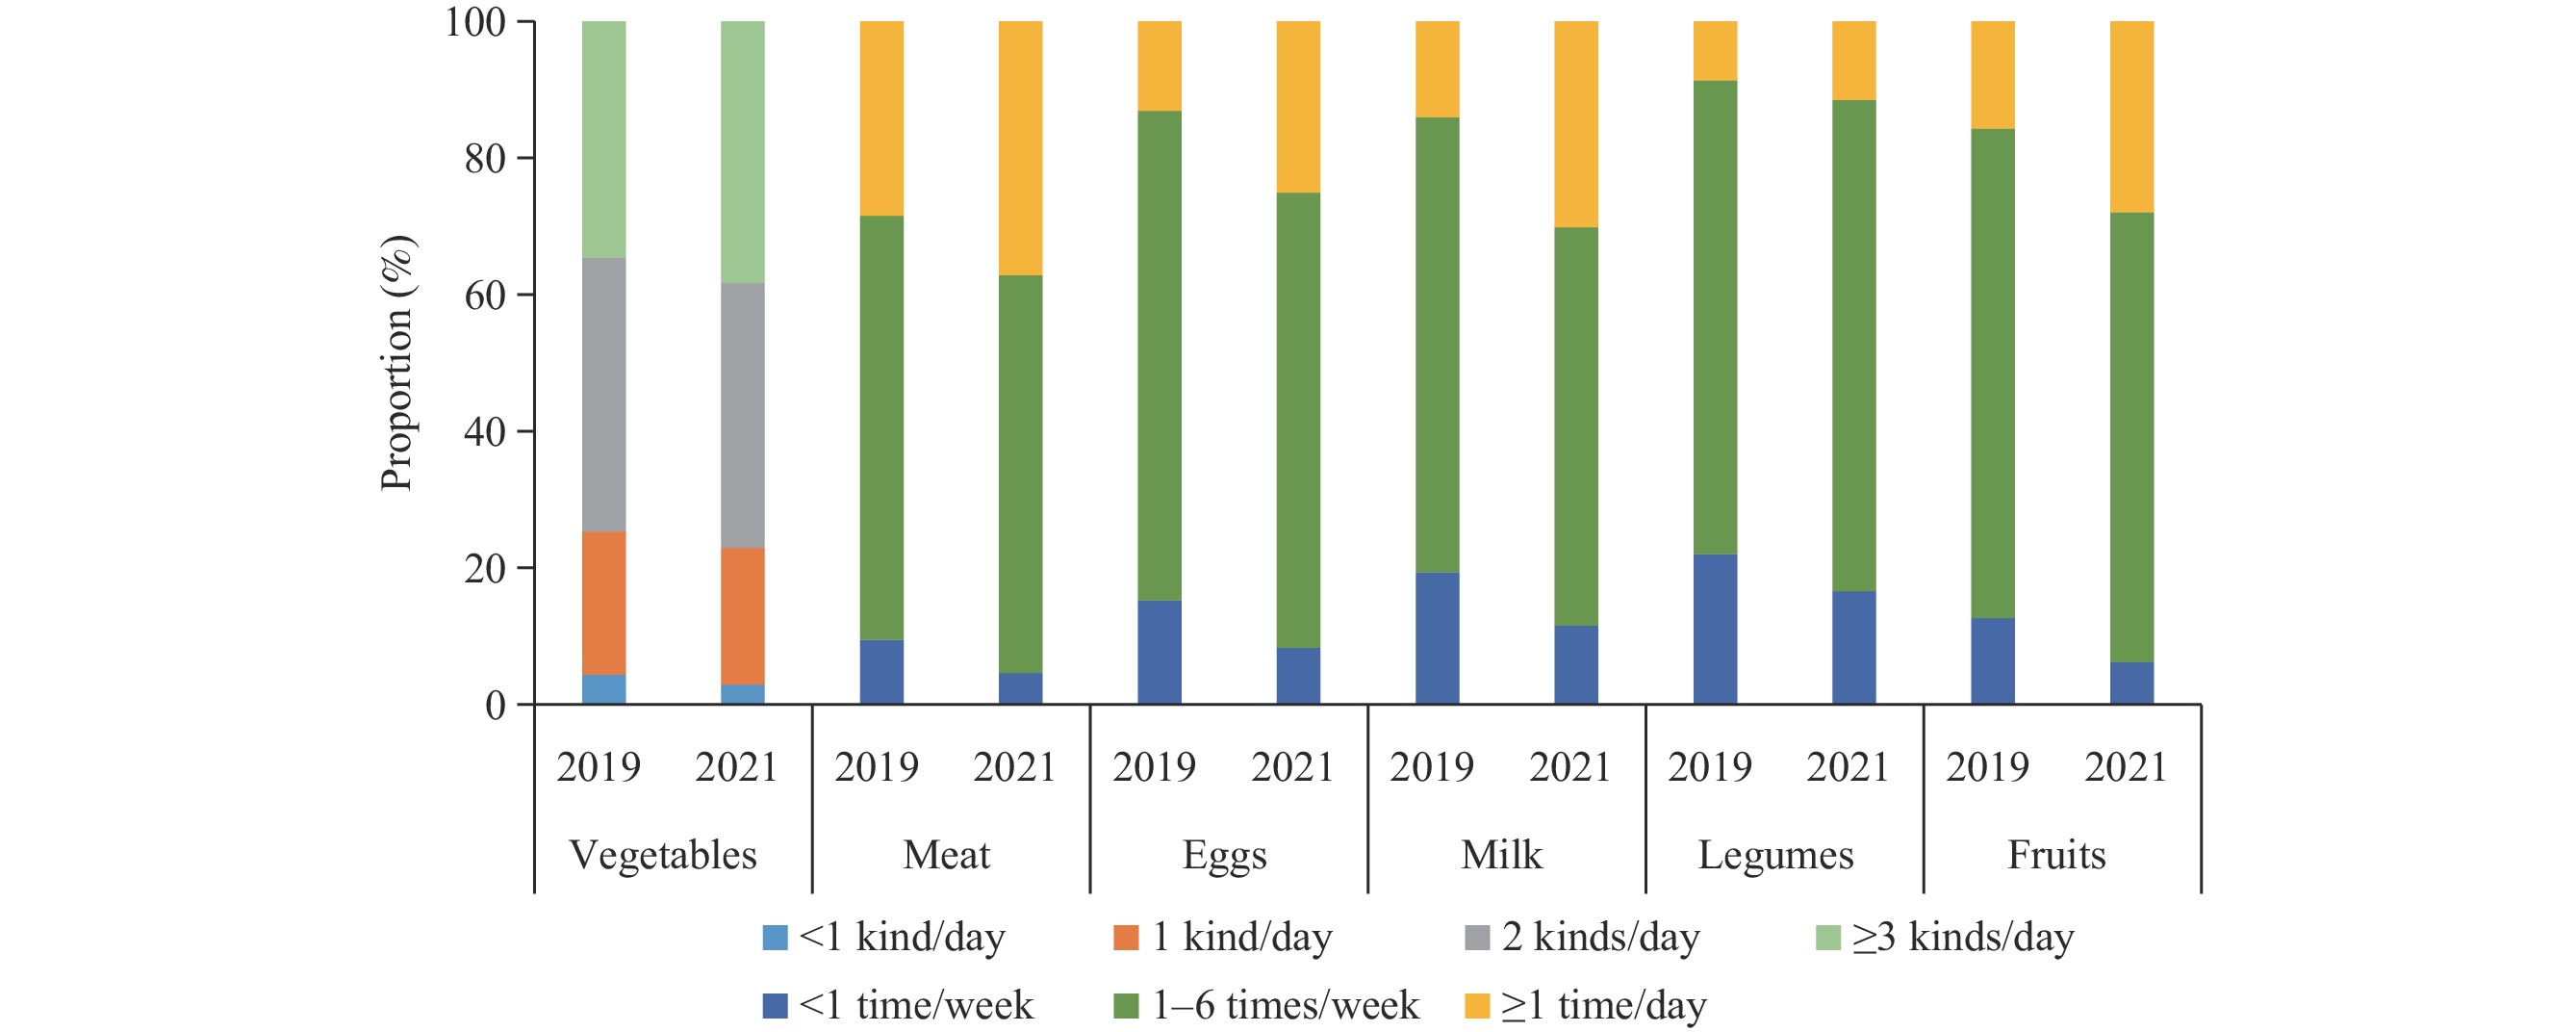 Figure 1.
Comparison of food consumption frequency for rural students aged 8–15 years — central and western regions of China, 2019 and 2021.
-
Diverse dietary intakes featuring a balanced combination of various food groups are essential due to the unique nutritional characteristics of different foods. This study’s findings indicate that in 2021, the frequency of daily consumption of meat, eggs, milk, legumes, and fruits in rural areas of central and western regions significantly increased compared to 2019, yet remained relatively low (1). Urban students, in contrast to their rural counterparts, exhibited higher weekly frequencies of meat, egg, milk, and fruit consumption in 2021.
Previous research has suggested that inadequate consumption frequency of various food categories may be associated with lower economic levels, limited access to healthy foods, and insufficient nutritional knowledge among students and parents in remote rural areas (6-7). This study contributes to the understanding of the two-year changes in consumption frequencies for diverse food groups among Chinese students and offers valuable insights to inform the development of policies and strategies aimed at controlling and preventing malnutrition.
Adequate consumption of foods rich in high-quality protein is a crucial strategy for addressing child malnutrition (8). The dietary guidelines for Chinese school-aged children advise moderate consumption of fish, poultry, and lean meat, one egg, and 300 g of milk daily, as well as legumes 4–7 times per week to ensure sufficient protein intake (1). Nonetheless, our study in 2021 found that only 36.5%, 24.0%, 30.1%, and 10.6% of rural students consumed meat, eggs, milk, and legumes once a day or more, respectively. A similar study conducted between 2015 and 2016 involving 2,107 students aged 6–13 years from impoverished rural areas in China reported that a mere 11.3%, 28.8%, and 24.5% of students consumed meat, eggs, and milk daily. This finding suggests that the low frequency of protein food consumption might be associated with regional economic status (9).
Fresh vegetables and fruits are abundant in essential vitamins, minerals, and dietary fiber. For Chinese school-aged children, dietary guidelines recommend the consumption of at least three or more varieties of fresh vegetables and one serving of fresh fruit daily (1). However, our study revealed that only approximately one-third of students in rural areas consumed fruits once a day or more, and vegetables in more than three types per day. Numerous studies have indicated that children in various countries exhibit low intakes of fruits and vegetables (10–11). Heinen et al. carried out a cross-sectional study with 123,100 children aged 6–9 years across 19 European countries, demonstrating that approximately 30%–80% and 30%–90% of children did not consume fruits or vegetables daily, respectively (10).
The frequency of consumption of various types of food among students may have increased following the COVID-19 outbreak. This study observed a rise in the weekly consumption frequency of meat, eggs, milk, legumes, fresh vegetables, and fruits in 2021 compared to 2019. Several studies suggested that this increase may be attributed to parents providing their children with diverse and balanced diets aimed at improving and maintaining their health after the COVID-19 outbreak (3,12–13). Nicholas et al. conducted an online survey among 254 Canadian households and found that more than half of the families reported a healthier diet, while 42% of children increased their intake of various foods since the onset of COVID-19 (12). It is important to note that although enhancing food intake to combat the virus during the COVID-19 pandemic may decrease undernutrition among students, it could also potentially increase the risk of overweight and obesity.
This study was subject to several limitations. First, the quantity of food intake was not assessed. Some students followed the suggested frequency of consumption but ingested smaller portions each time, leading to inadequate nutritional intake, which in turn may have influenced the accuracy of the study's findings. Second, the potential varying effects of different meat types were not considered separately; for instance, excessive consumption of red or processed meat may have negative health implications. Finally, factors associated with the frequency of food consumption will be examined more thoroughly in future research.
In summary, the weekly consumption frequencies of meat, eggs, milk, legumes, fruits, and vegetables in 2021 were higher compared to those in 2019. However, students in urban areas demonstrated a higher frequency of consuming meat, eggs, and milk, but a lower frequency of legumes and vegetables consumption in 2021, compared to their rural counterparts. It is recommended that the government and health education departments gradually increase financial investment and strengthen nutrition education, while fully considering regional differences, economic conditions, and pandemic factors. This approach aims to enhance food supply, availability, and accessibility in economically underdeveloped areas of China, potentially improving the nutritional status of students. Additionally, schools and parents should work collaboratively to guide children towards adequate intake of protein-rich foods, fresh vegetables, and fruits, thereby promoting their healthy growth.
-
No conflicts of interest.
-
Project teams from China CDC, provincial, city, and county level CDCs and Departments of Education, local school staff, and all participants.
HTML
| Citation: |

|