

 Download:


-
In China, there are over 300 million smokers, with approximately 19.8% having attempted to quit within the past 12 months (1). While numerous studies have demonstrated that cessation medication and counseling can improve quit rates (2–3), a mere 4.6% and 3.2% of those who tried to quit within the past 12 months reported using smoking cessation medication or receiving cessation counseling, respectively (1). This suggests that current cessation services are insufficient in addressing the needs of smokers aiming to quit.
In this study, the effectiveness of a comprehensive, community-based cessation intervention model was evaluated through a two-arm, parallel, cluster-randomized controlled trial conducted between August 2022 and March 2023 in Shenzhen, China. Eligible smokers were recruited through community health service centers (CHSC) and were assigned to receive either the community-based cessation intervention or self-help smoking cessation materials. Participants were followed up via telephone for three months. A total of 492 eligible participants were included in the analysis. The intervention group demonstrated a significantly higher self-reported quit attempt rate, 7-day point prevalence of abstinence rate (PPAR), smoking reduction rate, and continuous abstinence rate (CAR) compared to the control group at the three-month follow-up (59.75% vs. 40.63%, 33.05% vs. 21.88%, 33.47% vs. 23.05%, and 21.61% vs. 8.98%; P<0.05). Furthermore, participants who received the community-based cessation intervention [adjusted odds ratio (
aOR)=3.530, 95% confidence interval (CI): 1.942–6.413], had lower perceived difficulty of quitting scores (aOR=0.872, 95% CI: 0.773–0.984), and were married ( aOR=2.203, 95% CI: 1.025–4.736) exhibited a higher likelihood of achieving continuous abstinence (CA). Twenty matched communities in Shenzhen were selected and randomized (1∶1) into either the intervention or control group. Eligible participants were current smokers over 18 years of age who planned to quit within one month and signed an informed consent form; individuals with psychiatric or psychological disorders were excluded (Figure 1). For the intervention group, a “3+1” smoking cessation service model, developed based on the “5A” (Ask, Advise, Assess, Assist, Arrange) and “5R” (Relevance, Risks, Rewards, Roadblocks, Repetition) principles (4), was provided by trained and assessed CHSC physicians. The “3+1” model comprised three face-to-face interventions at the initial visit, 7 days, and 1 month after the quit date, as well as one telephone intervention on the quit date. The first visit featured a 40-minute face-to-face cessation counseling session, while the following two face-to-face interventions lasted for at least 20 minutes on the seventh day and first month after the quit date. The telephone intervention on the quit date typically spanned approximately 5 minutes.
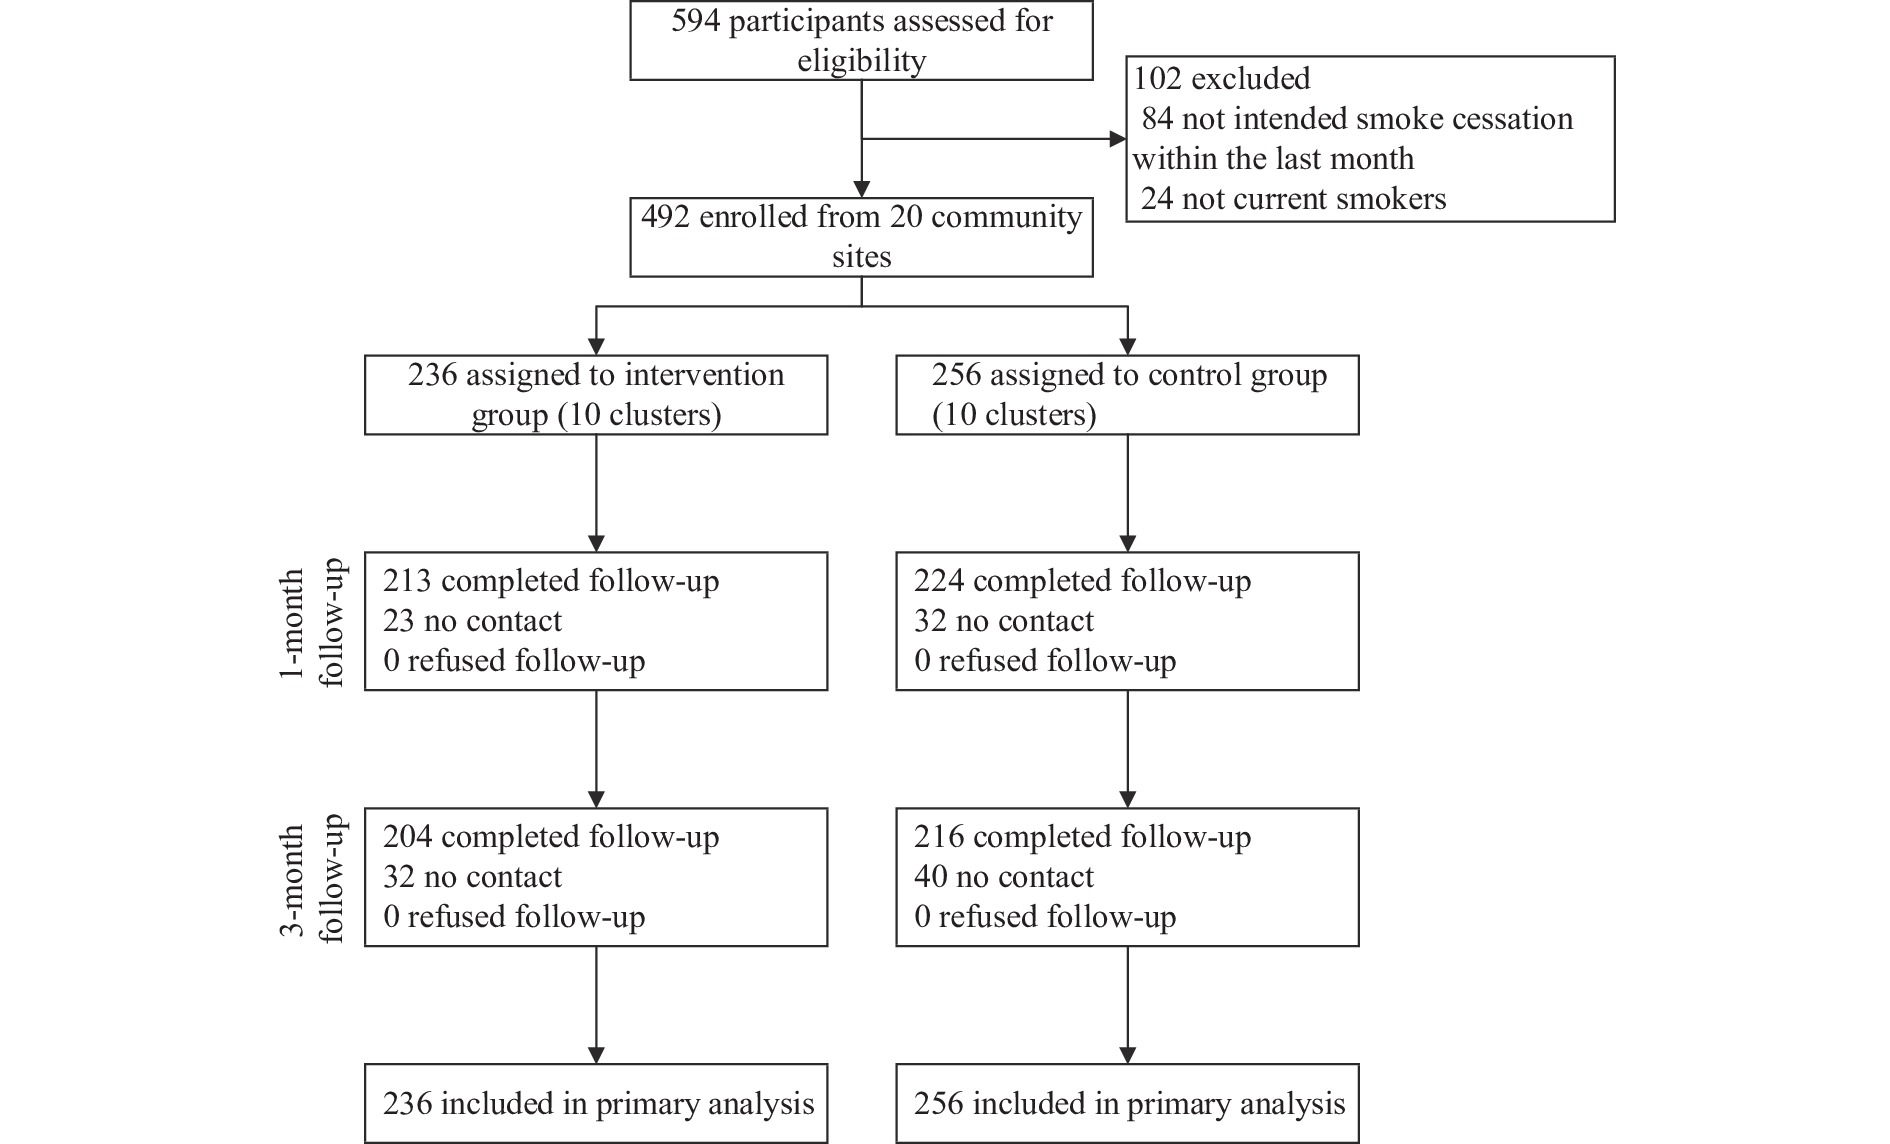 Figure 1.
Flowchart of participant recruitment and progression throughout the study — Shenzhen City, China, 2022.
Moreover, in the intervention group, community workers implemented advocacy initiatives and established smoke-free environments, including smoke-free schools, smoke-free households, and smoke-free government buildings, to foster an anti-tobacco atmosphere. Participants in this group also received self-help cessation materials. Conversely, the control group was solely provided self-help cessation materials, distributed by CHSC physicians. The study gained ethical approval from the Ethical Review Committee of the China CDC (202128) and was registered in the Chinese Clinical Trial Registry (ChiCTR2200056242).
In the current study, participants lost to follow-up were treated as continuing smokers with no decrease in cigarette consumption relative to baseline. Outcome measures encompassed quit attempts, 7-day point prevalence of abstinence (PPA), CA, and smoking reduction at the three-month follow-up. Among these measures, a quit attempt referred to self-reported abstinence from smoking for 24 hours or longer; 7-day PPA denoted self-reported abstaining from smoking for the preceding seven consecutive days or more; CA described self-reported sustained abstinence from smoking since the designated quit date; and smoking reduction was characterized as self-reported reduction in daily cigarette consumption by half or greater in comparison to the initial visit, excluding participants who self-reported cessation. An intent-to-treat approach was employed for this study.
Data analysis was conducted using SAS software (version 9.4; SAS Institute, Inc., Cary, NC, USA). Continuous variables adhering to a normal distribution were described using means and standard deviations, whereas non-normally distributed variables were presented as medians and interquartile ranges. Categorical variables were summarized using frequencies and corresponding percentages. Unconditional logistic regression analysis was utilized to examine factors associated with 3-month continuous abstinence. Odds ratios (OR) and 95% CI were calculated. All P-values were two-sided, with P<0.05 indicating statistical significance.
In the current research, a sample of 492 participants was gathered, comprising 236 individuals from intervention communities and 256 from control communities. The mean age of the participants was 42.34±13.14 years, with a majority being male (95.12%). Most participants were married (81.91%) and employed (70.53%), and approximately one-third (33.13%) had obtained a college degree or higher educational attainment (Table 1).
Characteristic Total, N (%) CAR, N (%) cOR* 95% CI P Total 492 74 (15.04) Group 2.793 1.646–4.739 <0.001 Intervention group 236 (47.97) 51 (21.61) Control group 256 (52.03) 23 (8.98) Demographic characteristics Gender 1.961 0.751–5.116 0.169 Male 468 (95.12) 68 (14.53) Female 24 (4.88) 6 (25.00) Age (years) (M±SD) 42.34±13.14 42.46±14.46 1.001 0.982–1.020 0.934 Marital status 1.717 0.960–3.071 0.068 Married 403 (81.91) 55 (13.65) Unmarried/divorced/widowed 89 (18.09) 19 (21.35) Education level Primary or lower 19 (3.86) 3 (15.79) 1.160 0.937–1.437 0.173 Secondary school 77 (15.65) 9 (11.69) High school/secondary specialized school 118 (23.99) 14 (11.86) Specialized school 115 (23.37) 19 (16.52) College or higher 163 (33.13) 29 (17.79) Employment status 1.015 0.591–1.743 0.958 Employed 347 (70.53) 52 (14.99) Unemployed 145 (29.47) 22 (15.17) Perceived health status at the first visit 0.637 0.378–1.072 0.090 Very good/good 305 (61.99) 53 (17.38) Fair 182 (36.99) 20 (10.99) Very poor/poor 5 (1.02) 1 (20.00) Presence of chronic non-communicable diseases 1.111 0.662–1.862 0.691 Yes 183 (37.20) 26 (14.21) No 309 (62.80) 48 (15.53) BMI (kg/m2) 0.889 0.710–1.112 0.303 Thin (<18.5) 12 (2.44) 0 (0.00) Normal (18.5–24) 250 (50.81) 41 (16.40) Overweight (24–28) 182 (36.99) 30 (16.48) Obese (≥28) 48 (9.76) 3 (6.25) Tobacco-related factors Age at initiation of smoking (years) 2.377 0.832–6.794 0.106 <18 55 (11.18) 4 (7.41) ≥18 437 (88.82) 70 (15.98) Duration of smoking (years) ($ \stackrel{-}{X} $±SD) 16.46±12.67 13.419±12.560 0.975 0.954–0.997 0.026 Price per pack of cigarettes (CNY) ($ \stackrel{-}{X} $±SD) 24.34±11.36 26.014±12.951 1.013 0.994–1.033 0.183 Fagerström test for nicotine dependence 0.644 0.458–0.905 0.011 Low (0–3) 247 (50.20) 49 (19.84) Moderate (4–5) 135 (27.44) 13 (9.63) Severe (6–10) 110 (22.36) 12 (10.91) Previous quit attempts 0.649 0.396–1.066 0.088 0 208 (42.28) 38 (18.27) ≥1 284 (57.72) 36 (12.68) Perceived importance of quitting ($ \stackrel{-}{X} $±SD) 7.87±2.24 8.351±1.801 1.134 1.000–1.286 0.049 Perceived difficulty of quitting ($ \stackrel{-}{X} $±SD) 7.24±2.47 6.689±2.590 0.904 0.823–0.994 0.037 Perceived confidence of quitting ($ \stackrel{-}{X} $±SD) 6.54±2.52 7.284±2.180 1.161 1.044–1.291 0.006 Knowing that smoking causes 4 diseases 0.782 0.476–1.285 0.332 Yes 247 (50.20) 41 (16.60) Not all 245 (49.80) 33 (13.47) Knowing that second hand smoke causes 4 diseases 1.057 0.619–1.805 0.839 Yes 344 (69.92) 51 (14.83) Not all 148 (30.08) 23 (15.54) Should smoking be allowed in indoor areas of
the following establishmentsWorkplace 0.979 0.501–1.913 0.951 No 411 (83.54) 62 (15.09) Yes/not sure 81 (16.46) 12 (14.81) Public place 1.007 0.526–1.929 0.983 No 406 (82.52) 61 (15.02) Yes/not sure 86 (17.48) 13 (15.12) Public transportation 1.076 0.521–2.224 0.843 No 429 (87.19) 64 (14.92) Yes/not sure 63 (12.81) 10 (15.87) Home 0.724 0.414–1.268 0.259 No 338 (68.70) 55 (16.27) Yes/not sure 154 (31.30) 19 (12.34) Abbreviation: CAR=continuous abstinence rate; BMI=body mass index; CI=confidence interval; CNY=Chinese Yuan.
* cOR: unadjusted odds ratio; the results of a single factor analysis by logistic regression model (unadjusted for factors).Table 1. Characteristics of study participants and those who achieved 3-month continuous abstinence — Shenzhen City, China, 2022.
At the three-month follow-up, successful smoking cessation was reported by 15.04% of participants. The CAR for the intervention group was 21.61%, which was significantly higher than the control group’s 8.98% [unadjusted odds ratio (cOR)=2.793, 95% CI: 1.646–4.739]. Participants with a shorter smoking history were more likely to quit (cOR=0.975, 95% CI: 0.954–0.997). Lower nicotine dependence was associated with a higher CAR, as low, moderate, and severe nicotine dependence levels resulted in CARs of 19.84%, 9.63%, and 10.91%, respectively (cOR=0.644, 95% CI: 0.458–0.905). Furthermore, higher CARs were observed among participants who perceived greater importance in quitting (cOR=1.134, 95% CI: 1.000–1.286), reported lower difficulty in quitting (cOR=0.904, 95% CI: 0.823–0.994), and expressed higher confidence in quitting (cOR=1.161, 95% CI: 1.044–1.291) (Table 1).
A logistic regression model was employed to investigate the predictors associated with CAR (1: cessation maintained for three months, 0: cessation not maintained for three months). The results revealed that participants in the intervention group had a higher likelihood of achieving continuous abstinence (aOR=3.530, 95% CI: 1.942–6.413), while perceiving greater difficulty in quitting smoking was associated with a reduced probability of sustaining abstinence for three months (aOR=0.872, 95% CI: 0.773–0.984). Additionally, married participants were more likely to remain abstinent from smoking for three months (aOR=2.203, 95% CI: 1.025–4.736) (Table 2).
Three-month follow-up Intervention group (N=236) Control group (N=256) aOR* 95% CI P n (%) n (%) Quit attempt rate 141 (59.75) 104 (40.63) 3.063 1.965–4.774 <0.001 7-day PPAR 78 (33.05) 56 (21.88) 2.364 1.481–3.773 <0.001 Smoking reduction rate 79 (33.47) 59 (23.05) 1.738 1.113–2.716 0.015 CAR 51 (21.61) 23 (8.98) 3.530 1.942–6.413 0.003 Abbreviation: CI=confidence interval; PPAR=point prevalence of abstinence rate; CAR=continuous abstinence rate.
* aOR: adjusted odds ratio; adjusted for characteristics and tobacco-related factors.Table 2. Comparison of cessation outcomes between the intervention and control groups at a three-month follow-up — Shenzhen City, China, 2022.
A similar method was utilized to investigate differences between the intervention group and the control group in relation to quit attempts, PPA, and smoking reduction at a three-month follow-up. The findings revealed that a higher proportion of participants in the intervention group (59.75%) attempted to quit smoking as compared to the control group (40.63%), with an
aOR of 3.063 and a 95% CI of 1.965–4.774. Moreover, the intervention group displayed a higher PPA rate (33.05%) in contrast to the control group (21.88%), with an aOR of 2.364 and a 95% CI of 1.481–3.773. Lastly, there was a statistically significant difference between the proportions of participants who reduced daily cigarette consumption by half or more in the intervention group (33.47%) compared to the control group (23.05%), with an aOR of 1.738 and a 95% CI of 1.942–6.413 (Table 2). -
This study revealed that the community-based smoking cessation intervention significantly enhanced quit attempt rates, 7-day PPAR, CAR, and smoking reduction rates among participants in the intervention group. These findings indicate that the community-based cessation intervention, administered by trained physicians at CHSC and aided by community workers, is both effective and feasible in promoting smoking cessation. Moreover, this model complements the existing cessation service system and necessitates the integration of such services.
It is worth noting that the three-month CAR for the intervention group (21.61%) was significantly higher than that for the control group (8.98%). Results from the multivariable logistic regression analysis indicated that participants who received the community-based smoking cessation intervention had a 3.530 times greater likelihood of achieving three-month continuous abstinence compared to those in the control group (aOR=3.530; 95% CI: 1.942–6.413). These findings suggest that the community-based smoking cessation intervention was effective in supporting participants in their efforts to quit smoking.
Furthermore, the results from the multivariable logistic regression analysis demonstrated that an increased perceived difficulty of quitting among smokers was associated with a decreased likelihood of achieving three-month continuous abstinence (aOR=0.872, 95% CI: 0.773–0.984). This relationship might be partially explained by the concept of self-efficacy, as a lower perceived difficulty of quitting suggests greater self-efficacy, which subsequently enhances the probability of successful smoking cessation (5). These findings indicate that community-based interventions should emphasize reducing the perceived difficulty of quitting and boosting self-efficacy to further encourage smoking cessation at the community level.
Compared to the three-month CAR (19.3%) achieved in the psychological combined telephone follow-up intervention conducted by Wu et al. (6) at the Smoking Cessation Clinic (SCC) of the PLA General Hospital, our community-based smoking cessation intervention yielded similar cessation results. However, CHSCs are more accessible and convenient for smokers seeking professional assistance in quitting smoking due to their location within communities. Unlike SCCs in professional tertiary hospitals, CHSCs have stronger connections with residents and greater potential to improve smokers’ willingness to quit through health education related to smoking.
Research has shown that varenicline can effectively increase the CAR among smokers (2,7). However, in CHSCs, cessation medications remain inaccessible due to high costs and inadequate insurance coverage. Consequently, the CAR in our study was notably lower than the rate reported by Jiang Bin and colleagues (31.3%) (8), who examined a combination of varenicline use and psychological intervention. To enhance cessation efficacy, integrating smoking cessation medications into community-based intervention programs is recommended.
In the present study, the average age of participants was over 40 years, which resulted in limited representation of young smokers. However, past research suggests that quitting smoking at an earlier age can yield significant health benefits (9–10). Therefore, it is critical to increase the involvement of young smokers in community-based smoking cessation interventions to promote public health. Future studies should investigate the factors that prevent younger smokers from participating in such interventions and develop strategies tailored to their unique needs. This may potentially involve the use of smoking cessation apps or other mobile technologies to increase the appeal and accessibility of the intervention for younger individuals.
The present study has several limitations. Firstly, the cessation rate was based on self-reported data, without biochemical validation. Secondly, intermediate and long-term cessation outcomes, including those at 6 and 12 months, were not available for evaluation. Finally, smokers who missed appointments were considered unsuccessful quitters, which might result in an underestimation of the quit rate for the community-based cessation intervention service.
The community-based smoking cessation intervention effectively promoted and supported quit attempts among smokers, significantly enhancing their success rates in discontinuing smoking. Moreover, the intervention facilitated a reduction in daily cigarette consumption for those who were unable to quit successfully. These findings indicate that the community-based smoking cessation intervention is efficient in endorsing smoking cessation. Given its feasibility and effectiveness, the government should advocate for and establish a community-based smoking cessation service system that integrates daily tobacco control activities as part of community health services. Additionally, the CHSC should enhance physicians’ capacity to provide smoking cessation services to community smokers seeking to quit.
-
No conflicts of interest.
-
Shenzhen CCDC and those who participated in the study and collected data.
HTML
| Citation: |

|